A growing need for affordable housing everywhere
In the past 10 years, many influences have shaped the affordable housing landscape in the seven-county region. Some of these influences include:
- The growing competitiveness of affordable housing funds and programs
- Increasing development of multifamily and affordable housing options in the suburbs of the region
- The COVID-19 pandemic
- Increasing inflation rates
- An increased focus on racial inequities in housing following George Floyd’s murder in 2020
- Record production of housing units
Throughout all these changing factors, the shortage of affordable housing units available for low-income households has remained persistent.
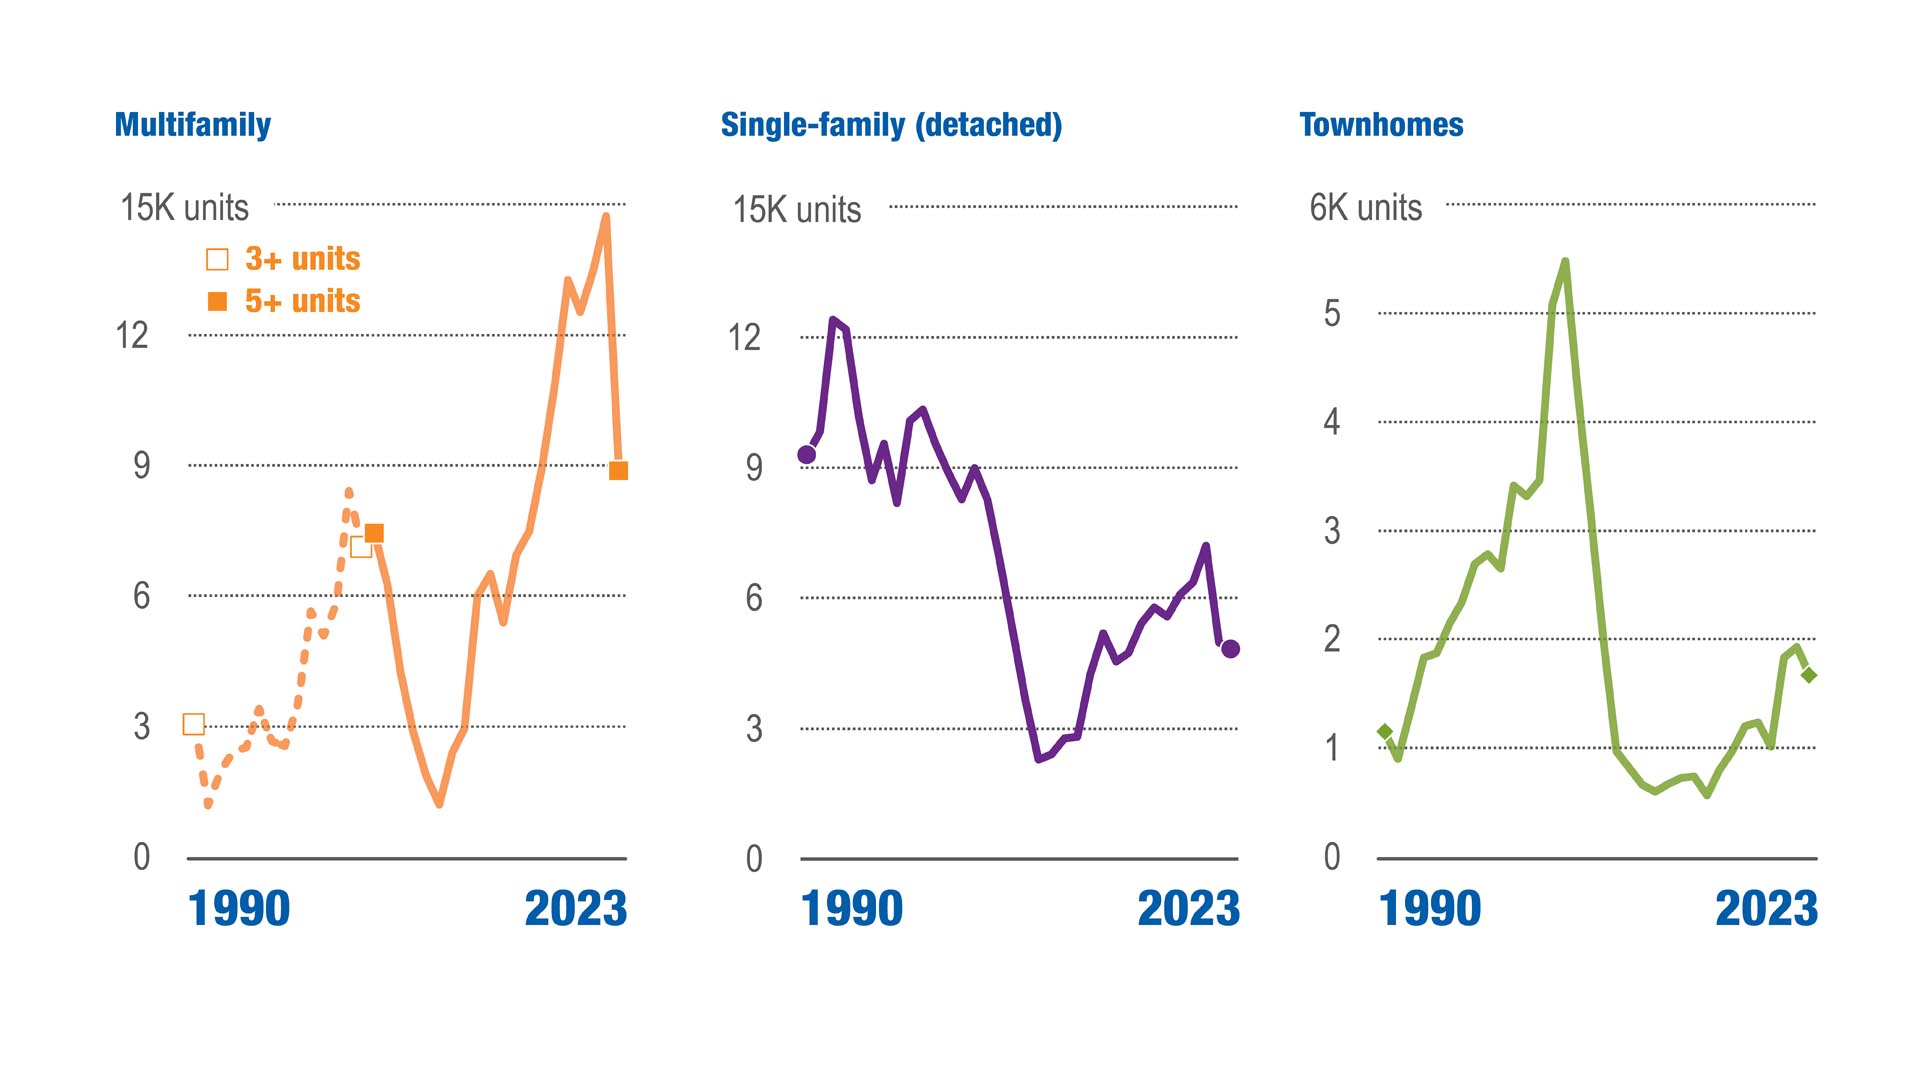
After the 2008 housing crisis, multifamily construction increased

Source: Metropolitan Council's Building Permit Survey, 2003 to 2023. Duplex, Triplex, and Quads and Accessory Dwelling Units (ADUs) are also tracked housing types in our annual survey but were not included here because of comparably small totals.
The seven-county region has had a less volatile housing market than other U.S. metropolitan areas and has seen record production numbers in recent years relative to the previous decade (2011-2020). However, the need for affordable housing still far outstrips the availability. From 2014 to 2022, housing production in the seven-county region has steadily increased. Between 2018 and 2022, more than 105,000 units of housing were added to the seven-county region, primarily multifamily and rental units.31 While production remains high in 2023, the effects of inflation rates, labor shortages, and other factors resulted in a decrease to production, although production is still relatively high in comparison to other metro areas.
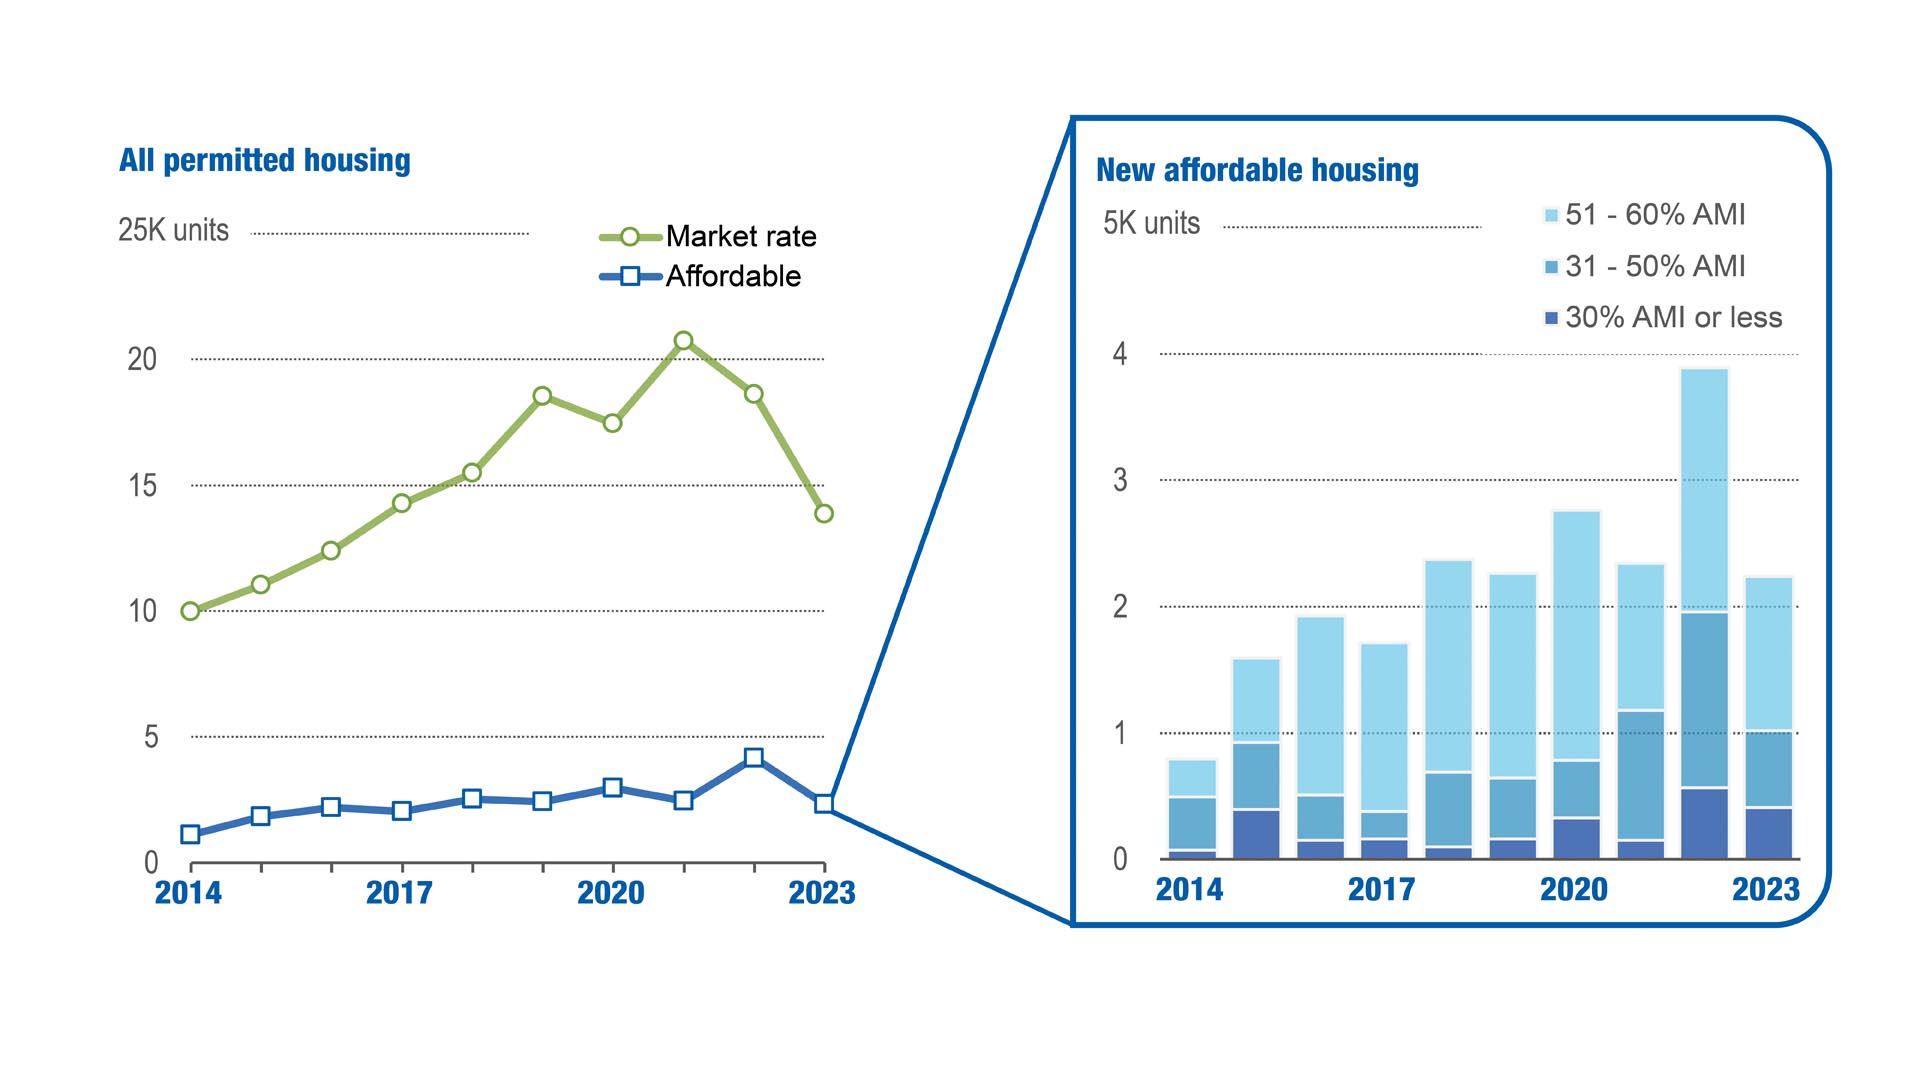
Affordable housing is only a small share of new housing construction across the region

Source: Metropolitan Council's Building Permit Survey and Housing Policy and Production Survey, 2014-2023. "Affordable" refers to rental units that are affordable to households earning below 60% area median income (AMI) and/or owner-occupied units that are below 80% AMI. Area median income is calculated annually by the U.S. Department of Housing and Urban Development (HUD) for the 15-county MSA. The area median income for the Twin Cities metro in 2024 was $124,200.
While production of housing units at all income levels increased, affordable housing units32 remained steady at about 8-14% of all housing unit production since 2014. Deeply affordable housing units, those that are affordable to households earning 30% of the area median income or less33 and the highest need in the region, were only 1% of overall production since 2014. This low production of affordable and deeply affordable housing units has deepened the shortage of affordable housing units needed in the region. Since the addition of units to the market is mostly from new construction, affordable housing development rates are largely dependent on market costs for building materials and the availability of deep subsidies from state and federal sources. The shortage of affordable housing supply has been exacerbated by material costs and labor shortages due to the COVID-19 pandemic as well as rising inflation rates. This shortage is represented in the decrease in housing unit construction, especially of multifamily units, in 2023.
Affordability Limits and Area Median Income (AMI)
Each year the federal government calculates the Area Median Income (AMI) for the region using Census data. The AMI is the midpoint of the region's income distribution, meaning that half the households in a region earn more than the median and half earn less than the median. In 2024, the region's AMI for a family of four was $124,200.
Federal Area Median Income for a family of four in the 15-county region, 2024
| Area Median Income | $124,200 |
| 80% of AMI | $97,800 |
| 60% of AMI | $74,520 |
| 50% of AMI | $62,100 |
| 30% of AMI | $37,250 |
Often affordable housing is defined as housing that is affordable to low-and-moderate-income families. Different levels of the AMI are used to describe various types of households and their income levels. These levels, or bands of affordability, are often used to determine if certain housing is affordable to certain households, or if a household is eligible for certain housing assistance. This plan considers rental housing affordable to those at or below 60% AMI, and ownership opportunities affordable to those at or below 80% AMI.
Rental and home prices have been rising at a higher rate than wage growth.34 Housing costs have remained untenable for renters and buyers, with over 27% of all households in the region experiencing housing cost-burden, meaning they spend over 30% of their gross income on their housing costs. Black and American Indian households have a disproportionate number of cost-burdened households. In 2022, over 49% of the region’s Black and over 53% of the region’s American Indian households experiencing housing cost-burden due to ongoing inequities in access to economic resources and affordable housing. Both renter and ownership households experience cost burden, but renters face larger financial burdens for housing costs. As many as 47.5% of renters are housing cost-burdened, while only 18.4% of homeowners are housing cost-burdened.35
"Even those with the adult working 40+ hours a week, when childcare is factored in and entry-level job wages for youth, even 50% AMI is simply not affordable if they are spending 60% of income on housing."
Quote footnote: 36
Staff engaged with residents, social service professionals, and affordable housing providers in the region, who all expressed that affordable housing is not affordable to all residents in the region due to the high costs of housing and other basic needs.37
"With wages, most people aren't able to pay because their salaries aren't high enough, so they're working 2-3 jobs."
Quote footnote: 38
Engagement data highlighted that even for units that are required to be affordable due to housing subsidies, rental costs are still out of reach for many residents. With other rising household expenses such as food, childcare, health care, and other basic needs, combined with the fact that many jobs do not pay a living wage, many lower-income households cannot afford to spend 30% of their limited income on housing. This can be true even when residents work multiple jobs. Combined with the affordable housing supply shortage, the lowest-income households continue to be heavily housing cost-burdened, are burdened by other household expenses and costs of living, have the slowest or no wage growth, and face the largest barriers to finding housing units that are affordable.
"I grew up in section 8 housing. We were lucky to be a part of that type of housing to find affordable housing for my parent's income. ...Honestly, it is becoming increasingly harder to be in welfare programs, and to be in section 8, and everything in that boat ... A lot of families are not qualifying even though they really need it. ... I think we need to be more flexible, rather than just looking at the numbers, especially if you have more kids, especially if you are in school."
Quote footnote: 39
While the lack of affordable housing affects most demographics, young people, in particular, are feeling the financial strain of these challenges. Met Council engagement with youth residents in 202340 found that many young people could not afford to move into their own rental unit, much less buy a house, a need felt most acutely by those historically excluded from wealth-building opportunities. To provide opportunities for the next generation, it is important to ensure youth have diverse affordable options to live where they choose.
In terms of affordable homeownership options, manufactured housing and shared ownership housing represent lower-barrier opportunities for ownership and wealth accumulation through housing. Manufactured housing can be an attractive option for renters and low-income households because manufactured homes are significantly cheaper than a detached single-family home. Renters and low-income households also pay a higher portion of their income on housing costs than those who own their home. This is even the case when compared to homeowners who rent or share their land such as manufactured homes, cooperatives, or land trust homes. Shared ownership models, including community land trusts and cooperatives, can be an affordable alternative to renting with the added benefit of potential wealth accumulation. However, these housing choices are limited in supply and can be perceived as financially or physically less desirable due to stigma and lack of familiarity.
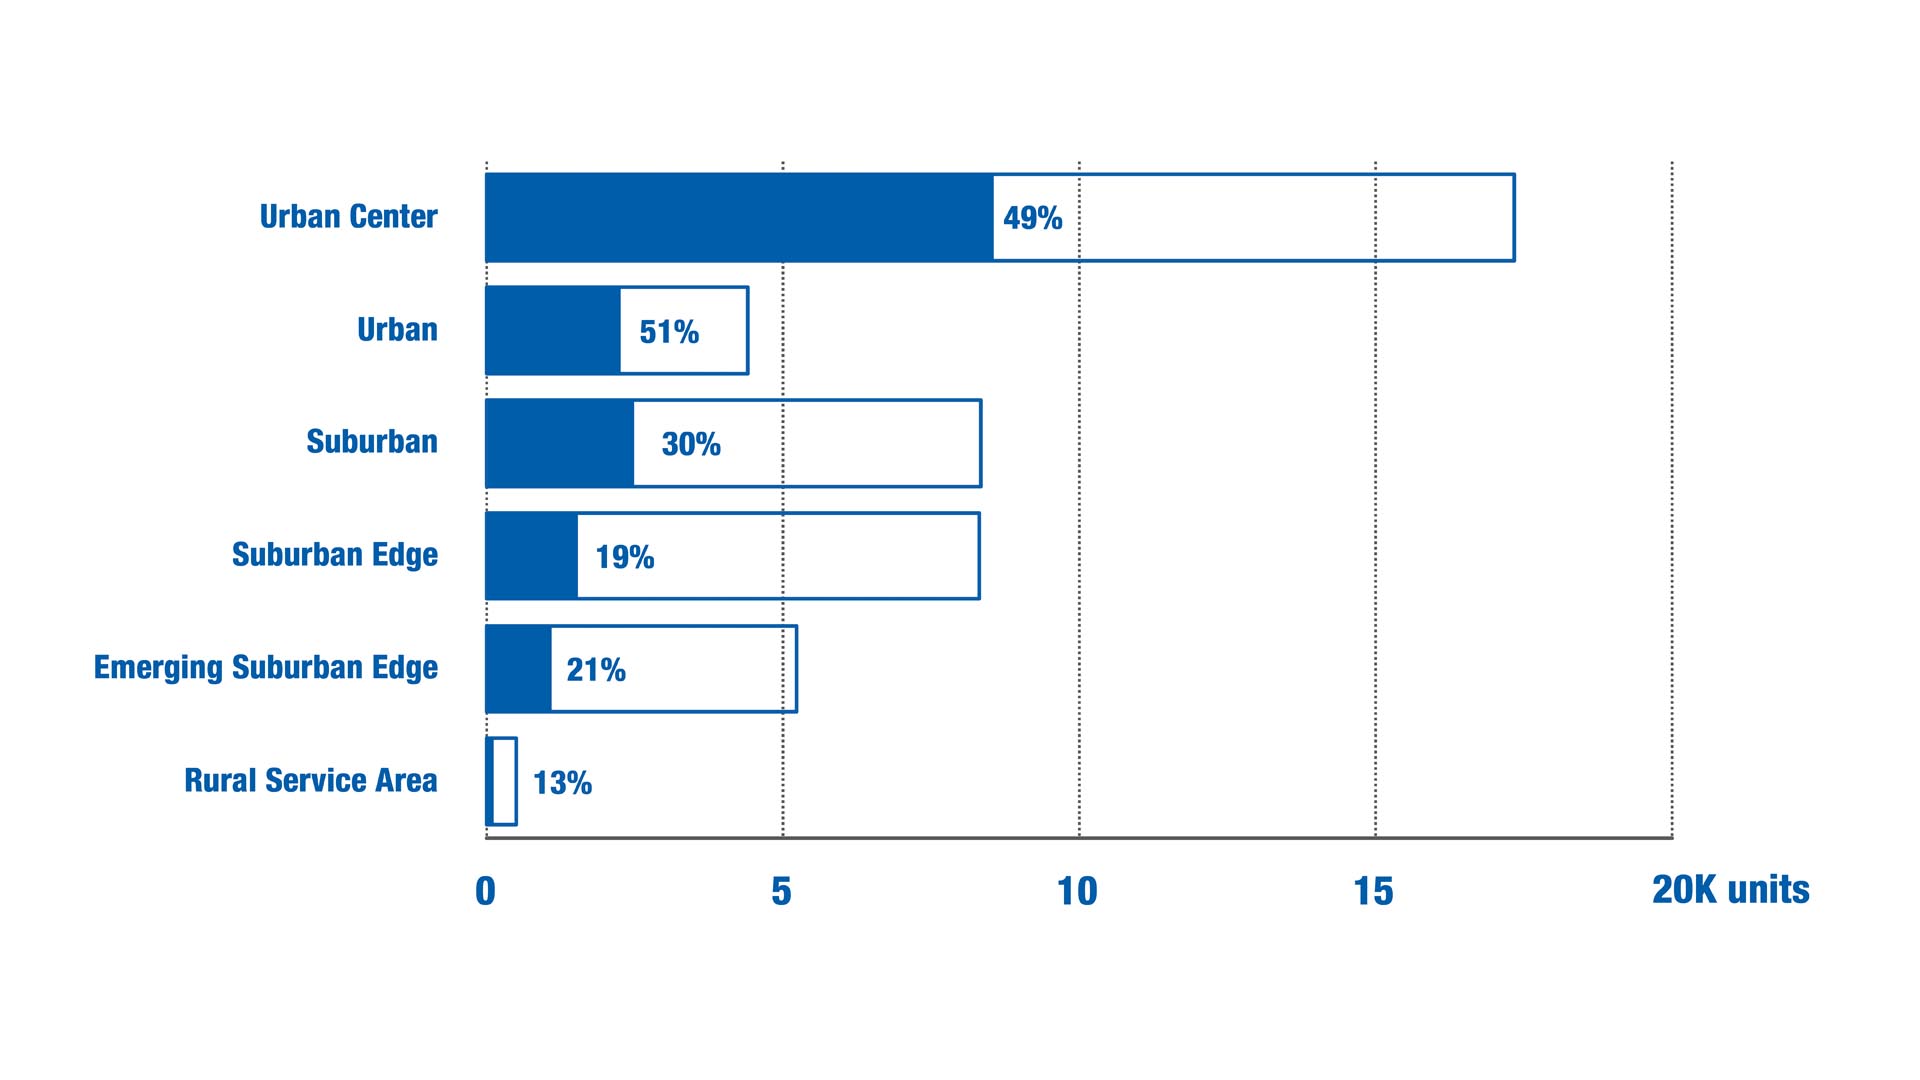
Affordable housing production from 2011 to 2020 was less than the regional need

Source: Metropolitan Council's Building Permit Survey and Housing Policy and Production Survey, 2011-2020. The percentage indicates the number of affordable housing units permitted in the 2011-2020 decade that are affordable at 60% of the area median income (AMI) or less of the total new affordable units needed in each community designation for the 2011-2020 decade. Note: The need for affordable housing units is only calculated for 2011-2020 sewer-serviced cities. The need for affordable units has been adjusted to reflect the actual growth, rather than forecasted growth, for each community designation in the 2011-2020 decade. The area median income is for the Twin Cities metro.
Allocation of Future Affordable Housing Need
The allocation of Future Affordable Housing Need is a regional policy tool that attempts to provide the most objective and accurate prediction possible of the number of new low-income households that will need affordable housing without considering the cost of, resources available for, or barriers to building that housing. The Met Council provides these numbers at the regional and local level for each planning decade.
Looking ahead, the Met Council forecasts that between 2030 and 2040, our region will add 39,700 low-income households that will need new affordable housing; of those households, 21,150 will need deeply affordable housing. The Future Need only measures future affordability demand and does not incorporate existing or previous decade (2011-2020) and the current decade (2021-2030) show the region falling short of meeting demand for affordable housing.
As shown in Figure 1-9 above, the region fell significantly short of producing the number of affordable units needed in the 2011-2020 decade. Currently, even with record-high, deeply affordable housing production in recent years, the region is behind in meeting the need for the 2021-2030 decade.
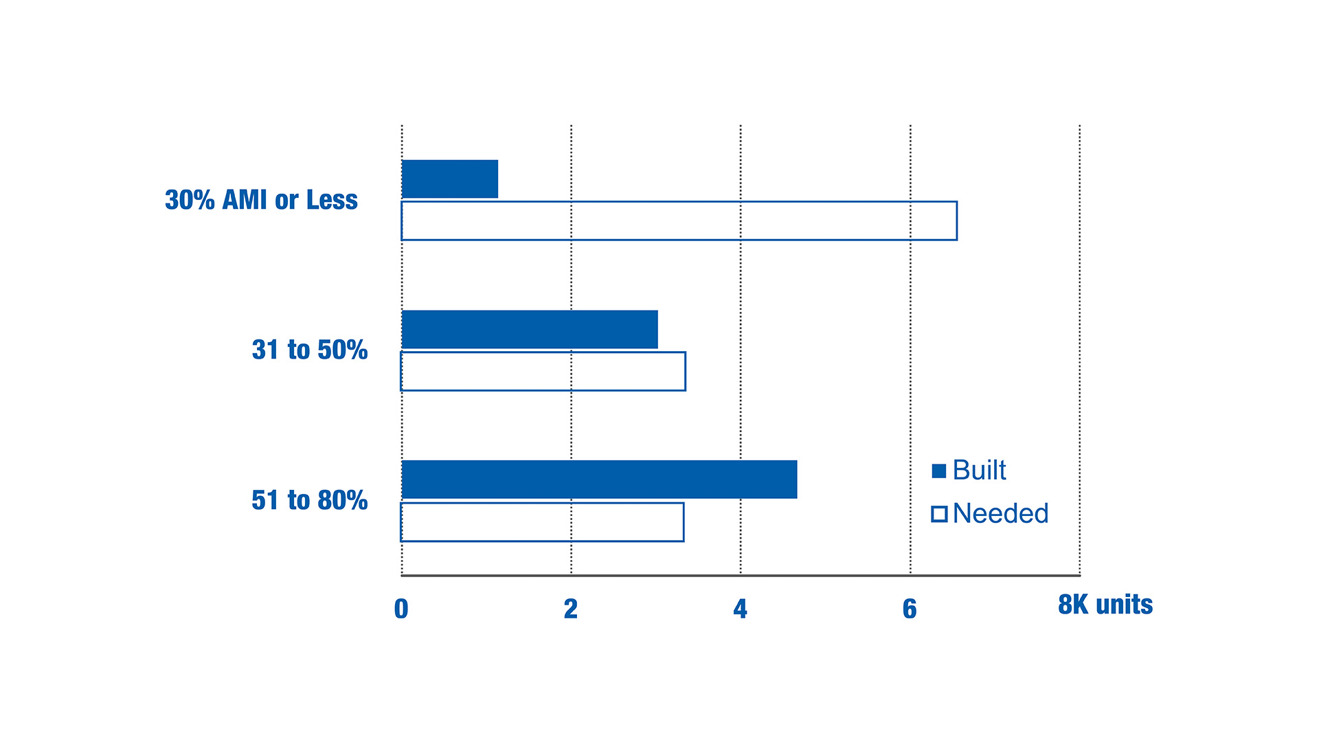
Deeply affordable housing production lags regional future need

Source: Metropolitan Council's Building Permit Survey, 2021-2023.
After the first three years of the current decade (2021-2023), only six cities are on track to meet their 2021 to 2030 allocation of Future Affordable Housing Need at 30% AMI or less units.41 The reliance on government subsidies for deeply affordable units and the impact of high building costs are barriers to the production of deeply affordable units across the region. These issues elevate the need to dedicate, prioritize, and layer funding sources for deeply affordable housing to increase production and preservation of these units.
31. Met Council Affordable Housing Production dataset, 2018-2022.
32. “Affordable” units are those which are affordable at incomes that are 60% AMI or less for rental units and 80% AMI or less for ownership units.
33. In 2024, 30% of the area median income was $37,250. More information can be found here: Ownership and rent affordability limits - Metropolitan Council. https://metrocouncil.org/Housing/Planning/Affordable-Housing-Measures/Ownership-and-Rent-Affordability-Limits.aspx?viewmode=0
34. Met Council Rent Trends dataset, CoStar, 2024, 7-county region. To read more about rent trends for the region and by city please see: https://metrotransitmn.shinyapps.io/twin-cities-rent-trends/
35. 2040 Housing Policy Plan Indicators. American Community Survey (ACS) Summary Files. Twin Cities Region (7-county). ACS 2022 5-Year Estimates. https://metrocouncil.org/Housing/Planning/Housing-Policy-Plan-Dashboard/Housing-Dashboard-Cost-Burden-(1).aspx
36. Metropolitan Council. Quote from a 2023 Affordability Limits Survey participant. https://metrocouncil.org/Housing/Planning/2050-Housing-Policy-Plan/HPP-2050-Engagement.aspx
37. Metropolitan Council. (2024.) 2050 housing policy plan community exchange sessions report & affordability limits survey results. https://metrocouncil.org/Housing/Planning/2050-Housing-Policy-Plan/HPP-2050-Engagement.aspx
38. Metropolitan Council. (2024). Quote from an engagement participant of Raices Latinas, Hennepin County 2023. Please see Housing policy recommendations report. https://metrocouncil.org/Planning/Imagine-2050/Community-Engagement.aspx
39. Metropolitan Council. (2024). Quote from an engagement participant of Esperanza United - 2023 Esperanza United Story Session. Please see Housing policy recommendations report. https://metrocouncil.org/Planning/Imagine-2050/Community-Engagement.aspx
40. Metropolitan Council. (2023). Young leaders share their visions for the region. https://metrocouncil.org/News-Events/Communities/Newsletters/Young-leaders-2050-vision.aspx
41. Metropolitan Council. Affordable Housing Production dataset, 2021-2023.
 An official website of the