A more diverse region
By 2050, the region is projected to grow to 3,813,400 residents, a gain of 650,300 residents from 2020. This means a gain of 311,059 low-income households, and these new households will require 3,900 affordable3 housing units a year on average between 2020 and 2050.4
The region has seen profound demographic changes over the past decade and this trend is expected to continue. The region’s population will be 45% Black, American Indian, and people of color by 2050,5 an increase from 31% in 2022.6 This change is largely driven by growth in existing communities of color in the region, such as East African and Hispanic or Latine communities.
While most of the growth in households of color will be from racial and ethnic groups currently in the region, immigrant and refugee residents make up a large part of the region’s current economic and social systems. In 2022, foreign-born residents made up 12% of the total population in the region, but 15% of the employed labor force of the region, and 17% of all business owners. These numbers are expected to increase as foreign-born residents of the region increase.7 The immigrant population is and will continue to be a fundamental asset to the economic vitality of the region, but immigrants and refugees continue to face disparities in housing access.
The ongoing growth of racial and ethnic diversity in our region will be most notable among youth. Households with youth under 18 years old are more diverse in terms of race and ethnicity than the region as a whole. Thirty-five percent (35%) of households with youth are households of color, compared to 23% overall in the region.8 A greater share of households of color currently rent, 53%, compared to 24% of white households.9 Considering the current rental housing stock, this can mean smaller living spaces for large families. Even with the region growing more diverse, the economic and housing access disparities for youth in households of color continue to persist.10
"[I need] more space for our family in the apartment! Rarely are there more than 2 bedrooms available."
Quote footnote: 11
"In terms of size of home needs, you have different generations living at home at one time...I'd like the size of my house to be 5 bedrooms. You have a guest room, each kid has a room, grandparents could have one, parents can have one."
Quote footnote: 12
With changing demographics, household types, and community needs, our region has changing needs for housing size, types, and amenities. Additionally, the inability to access homeownership hinders generational wealth opportunities for current and future generations. Resident engagement has highlighted the need for larger affordable housing units for multigenerational families and more opportunities to access wealth generation.
"Big companies are buying houses and flipping them. People are used to owning [their] own home and values of community. Companies buy them and flip them, and it becomes a super expensive place. This impacts the [number and ability of young people] to access home ownership based on not being able to do it and having to keep renting for years."
Quote footnote: 13
Increasing diversity is not solely limited to urban areas. Diversity is increasing in all areas of the seven-county region, emphasizing the need to supply inclusive and diverse housing opportunities in all neighborhoods across all city and township types.
In addition to becoming more racially diverse, in the coming decades, our region will be home to increasing numbers of older residents as more households transition into retirement than ever before. This creates a larger need for age-restricted housing, across income levels, that can support people at varying degrees of independence. Many older households may be living in housing that does not meet their full accessibility needs. In 2023, 40% of voucher holders in the region were over the age of 62, but very few age-restricted units accept vouchers, or available units may be too expensive for a voucher holder to rent.14 An increasing number of these older households will also represent different family structures than before, such as single-person households or multigenerational households. These households will also need access to units or services that help them maintain independence in their communities.
Household types and incomes
Source: U.S. Census Bureau, American Community Survey (ACS). Twin Cities Region (7 county). 2021. Five-Year Public Use Microdata Sample (PUMS).
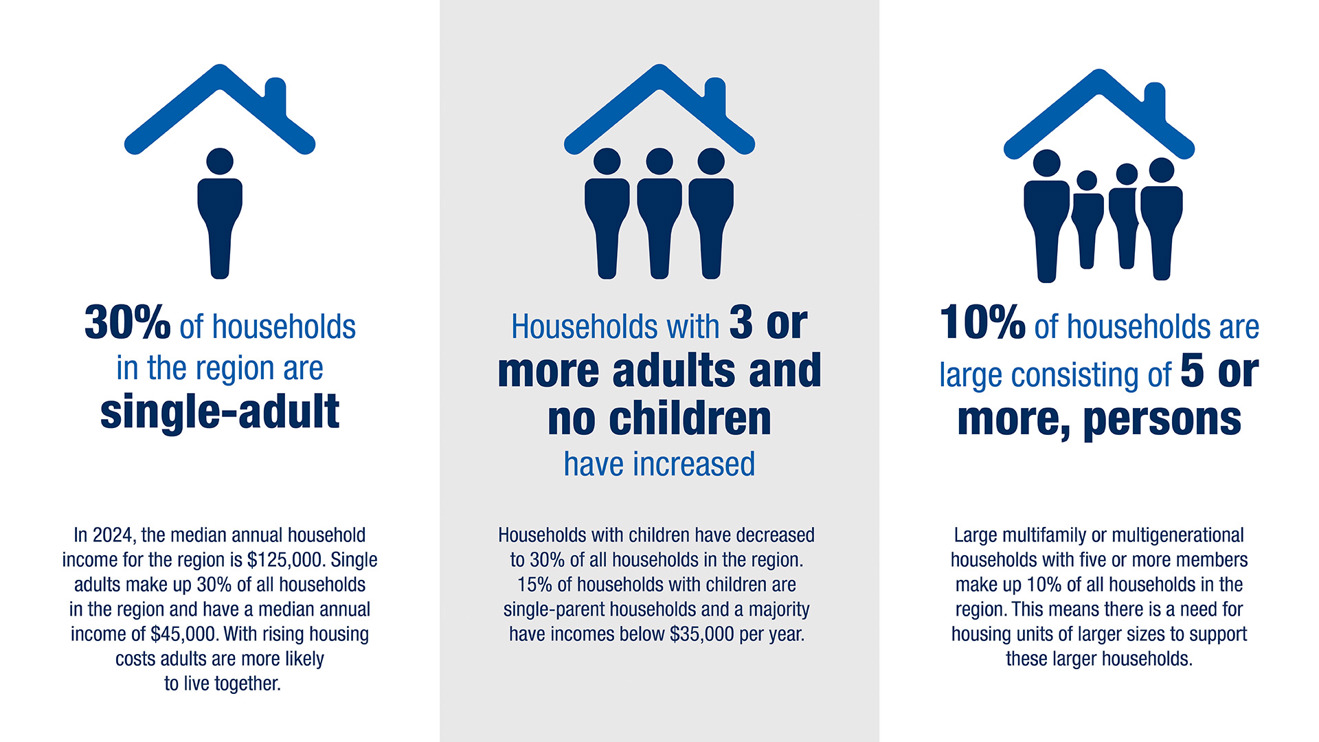
Different family structures, a large increase in the number of older residents, diverse living arrangements, and multigenerational living also mean that household sizes and structures often do not correspond to the standards used for public funding. Many low-income households have different income-earning scenarios and number of dependents than the affordability standards use. Only a small share of households in the region fit the U.S. Department of Housing and Urban Development (HUD) family model that assumes a four-person household with two income-earning adults and two dependents, which is used to determine household income limits for subsidized affordable housing.15 More single-income households are present in the region—making up 34% of all households—while only 9% of households contain two income-earning adults and two dependents.16 The mismatch of the region’s actual household types with the definition of family that is used by funding programs creates increased cost burdens for households who do not fit the standard family assumptions. The result is affordability standards can increase the cost burden for households who have fewer income earners or live in a household with more than two dependents.
3In this document, affordable housing refers to housing units that are affordable to households making 60% of the Area Median Income (AMI). More information about AMI can be found at: Ownership and rent affordability limits. https://metrocouncil.org/Housing/Planning/Affordable-Housing-Measures/Ownership-and-Rent-Affordability-Limits.aspx?viewmode=0
4Metropolitan Council. (2025). Imagine 2050 local forecasts to 2050 (adopted February 2025). https://metrocouncil.org/Data-and-Maps/Research-and-Data/Thrive-2040-Forecasts.aspx
5Ibid.
6U.S. Census Bureau, American Community Survey (ACS). (2022).15-County MSA. 2022. 5-Year Estimates, people of color defined as all people that are not white non-Hispanic.
7U.S. Census Bureau, American Community Survey (ACS). (2022). Twin Cities Region (7 county). 2022. One-Year Public Use Microdata Sample (PUMS).
8U.S. Census Bureau. (2020.) Population by Race and Ethnicity in the Twin Cities Region. Twin Cities Region (7-county). 2020. Note: 2020 Census using Households not population, the population of residents of color remains at 31%
9U.S. Census Bureau. (2022). American Community Survey (ACS),15-County MSA. 2022. 5-Year Estimates, households of color are defined as all households that are not white non-Hispanic
10Please see Landscape of the Region section of the Imagine 2050 regional development guide.
11Metropolitan Council. (2024). Quote from engagement with a Housing Choice Voucher participant (Eden Prairie) - 10/17/23. https://metrocouncil.org/Housing/Planning/2050-Housing-Policy-Plan/HPP-2050-Engagement.aspx
12Metropolitan Council. (2024). Quote from an engagement participant of the Islamic Center of Minnesota Youth Group - 9/9/23. https://metrocouncil.org/Housing/Planning/2050-Housing-Policy-Plan/HPP-2050-Engagement.aspx
13Metropolitan Council. (2024). Quote from engagement participant of the Young Leaders Collaboration - 2023. Please see Housing policy recommendations report. https://metrocouncil.org/Planning/Imagine-2050/Community-Engagement.aspx
14U.S. Department of Housing and Urban Development. (2023). Picture of subsidized households dataset,15-county MSA.
15Read more about rent and income limits here: Ownership and Rent Affordability Limits - Metropolitan Council https://metrocouncil.org/Housing/Planning/Affordable-Housing-Measures/Ownership-and-Rent-Affordability-Limits.aspx?viewmode=0
16U.S. Census Bureau, American Community Survey (ACS). (2021). Twin Cities Region (7 county). 2021. One-Year Public Use Microdata Sample (PUMS).
