An older population
The considerations and needs of the older population are not new, but with demographic trends, a clearer picture is emerging of the increasing housing needs of this population, particularly regarding housing cost-burden, affordability, physical accessibility, and access to services.
The region is aging rapidly. Met Council local forecasts indicate more than 22% of the population will be over the age of 65 in 2050, compared to 14% in 2020. Many older households, 49%, will be individuals living alone, with many needing some level of support services as they age. Additionally, the region has an increasing older population of color. By 2050, 28% of people 65 and older will be Black, American Indian, or a person of color, compared to 11% in 2022.48 Older individuals and households of color experience compounded challenges with access to and cost of housing. Many Black, American Indian, and households of color experience a lower rate of homeownership and lower wealth accumulation than white households. These demographic shifts and the sheer size of the older population will create increasing challenges for housing affordability, disability accommodation, and independent living.
The population is, on average, living longer, which can correlate with higher healthcare costs and the need for accessibility accommodations for longer periods of time than in previous years. In 2022, 68% of residents over the age of 75 were not receiving institutionalized care but experienced challenges with vision, hearing, mobility, personal care, or daily tasks.49 The number of households that will require some kind of institutionalized or specialized assistance will increase as the region’s older population continues to increase through 2050. The increasing costs for supportive services and care, compounded by the shortage of laborers in the healthcare market, has made accessing safe age-restricted housing competitive and expensive.
Older and younger households are more likely to experience housing cost-burden
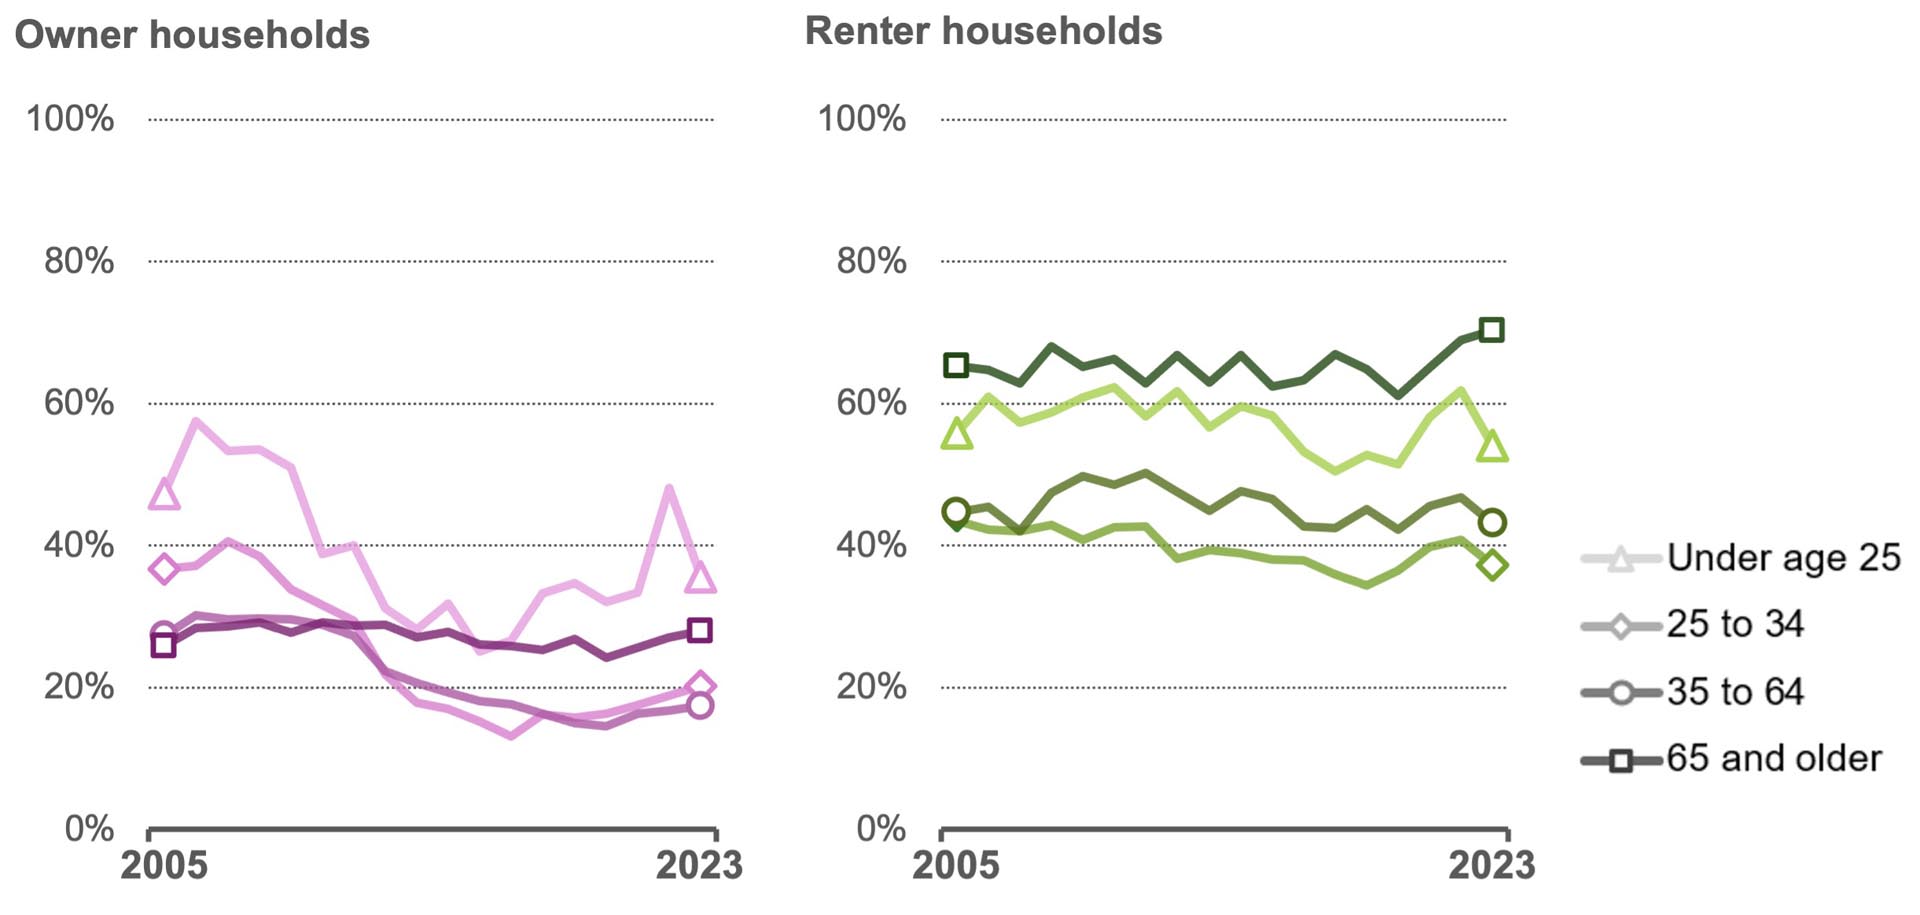
Source: U.S. Census Bureau, American Community Survey, one-year summary files, 2005 to 2023. Data summarize the 15-county MSA. Cost burden refers to households that are spending at least 30% of their monthly income on housing.
Nearly one-third (32%) of households over age 65 in the region are housing cost-burdened.50 With housing becoming increasingly cost prohibitive and limited in supply, many households with older people are choosing to stay in their current houses longer. This may result in deferred home maintenance as households with older residents are forced to balance the safety of their living environment with undertaking a large cost for home repairs or accessibility upgrades. A household’s choice to age in place, by living in their housing longer, also constrains homebuying opportunities for other households looking to buy a home in the market. In addition, an increasing proportion of the older population does not own their home. Housing cost-burden for older households is particularly severe among those who rent, with nearly 60% of renter households over age 65 paying more than 30% of their income on housing.51 For these households, especially with a fixed income, any increase in household costs may lead to housing instability or loss.
Between 2030 and 2040, the region will have an additional 11,000 older adults that will need some kind of institutionalized living arrangement (skilled nursing, memory care, hospice etc.).52 Collaboration with other government agencies, advocacy groups, and financers to coordinate on the need for substantial subsidy for these units will be ever more necessary to meet the need of our aging community.
48. Metropolitan Council. (2025). Imagine 2050 Local Forecasts to 2050. https://metrocouncil.org/Data-and-Maps/Research-and-Data/Thrive-2040-Forecasts.aspx
49. U.S. Census Bureau, American Community Survey (ACS), 5-Year Estimates, 2022. 15-county region.
50. U.S. Census Bureau, American Housing Survey (AHS). 2021. 7-county region.
51. U.S. Census Bureau, American Community Survey (ACS), Five-Year Estimates, 2023. 15-county MSA.
52. Metropolitan Council staff analysis of U.S. Census Bureau data (2020 Census, Demographic and Housing Characteristics file; 2018-2022 American Community Survey Five-year Public Use Microdata Sample).
