Housing Appendix C - Methodology of Calculating Future Affordable Housing Need
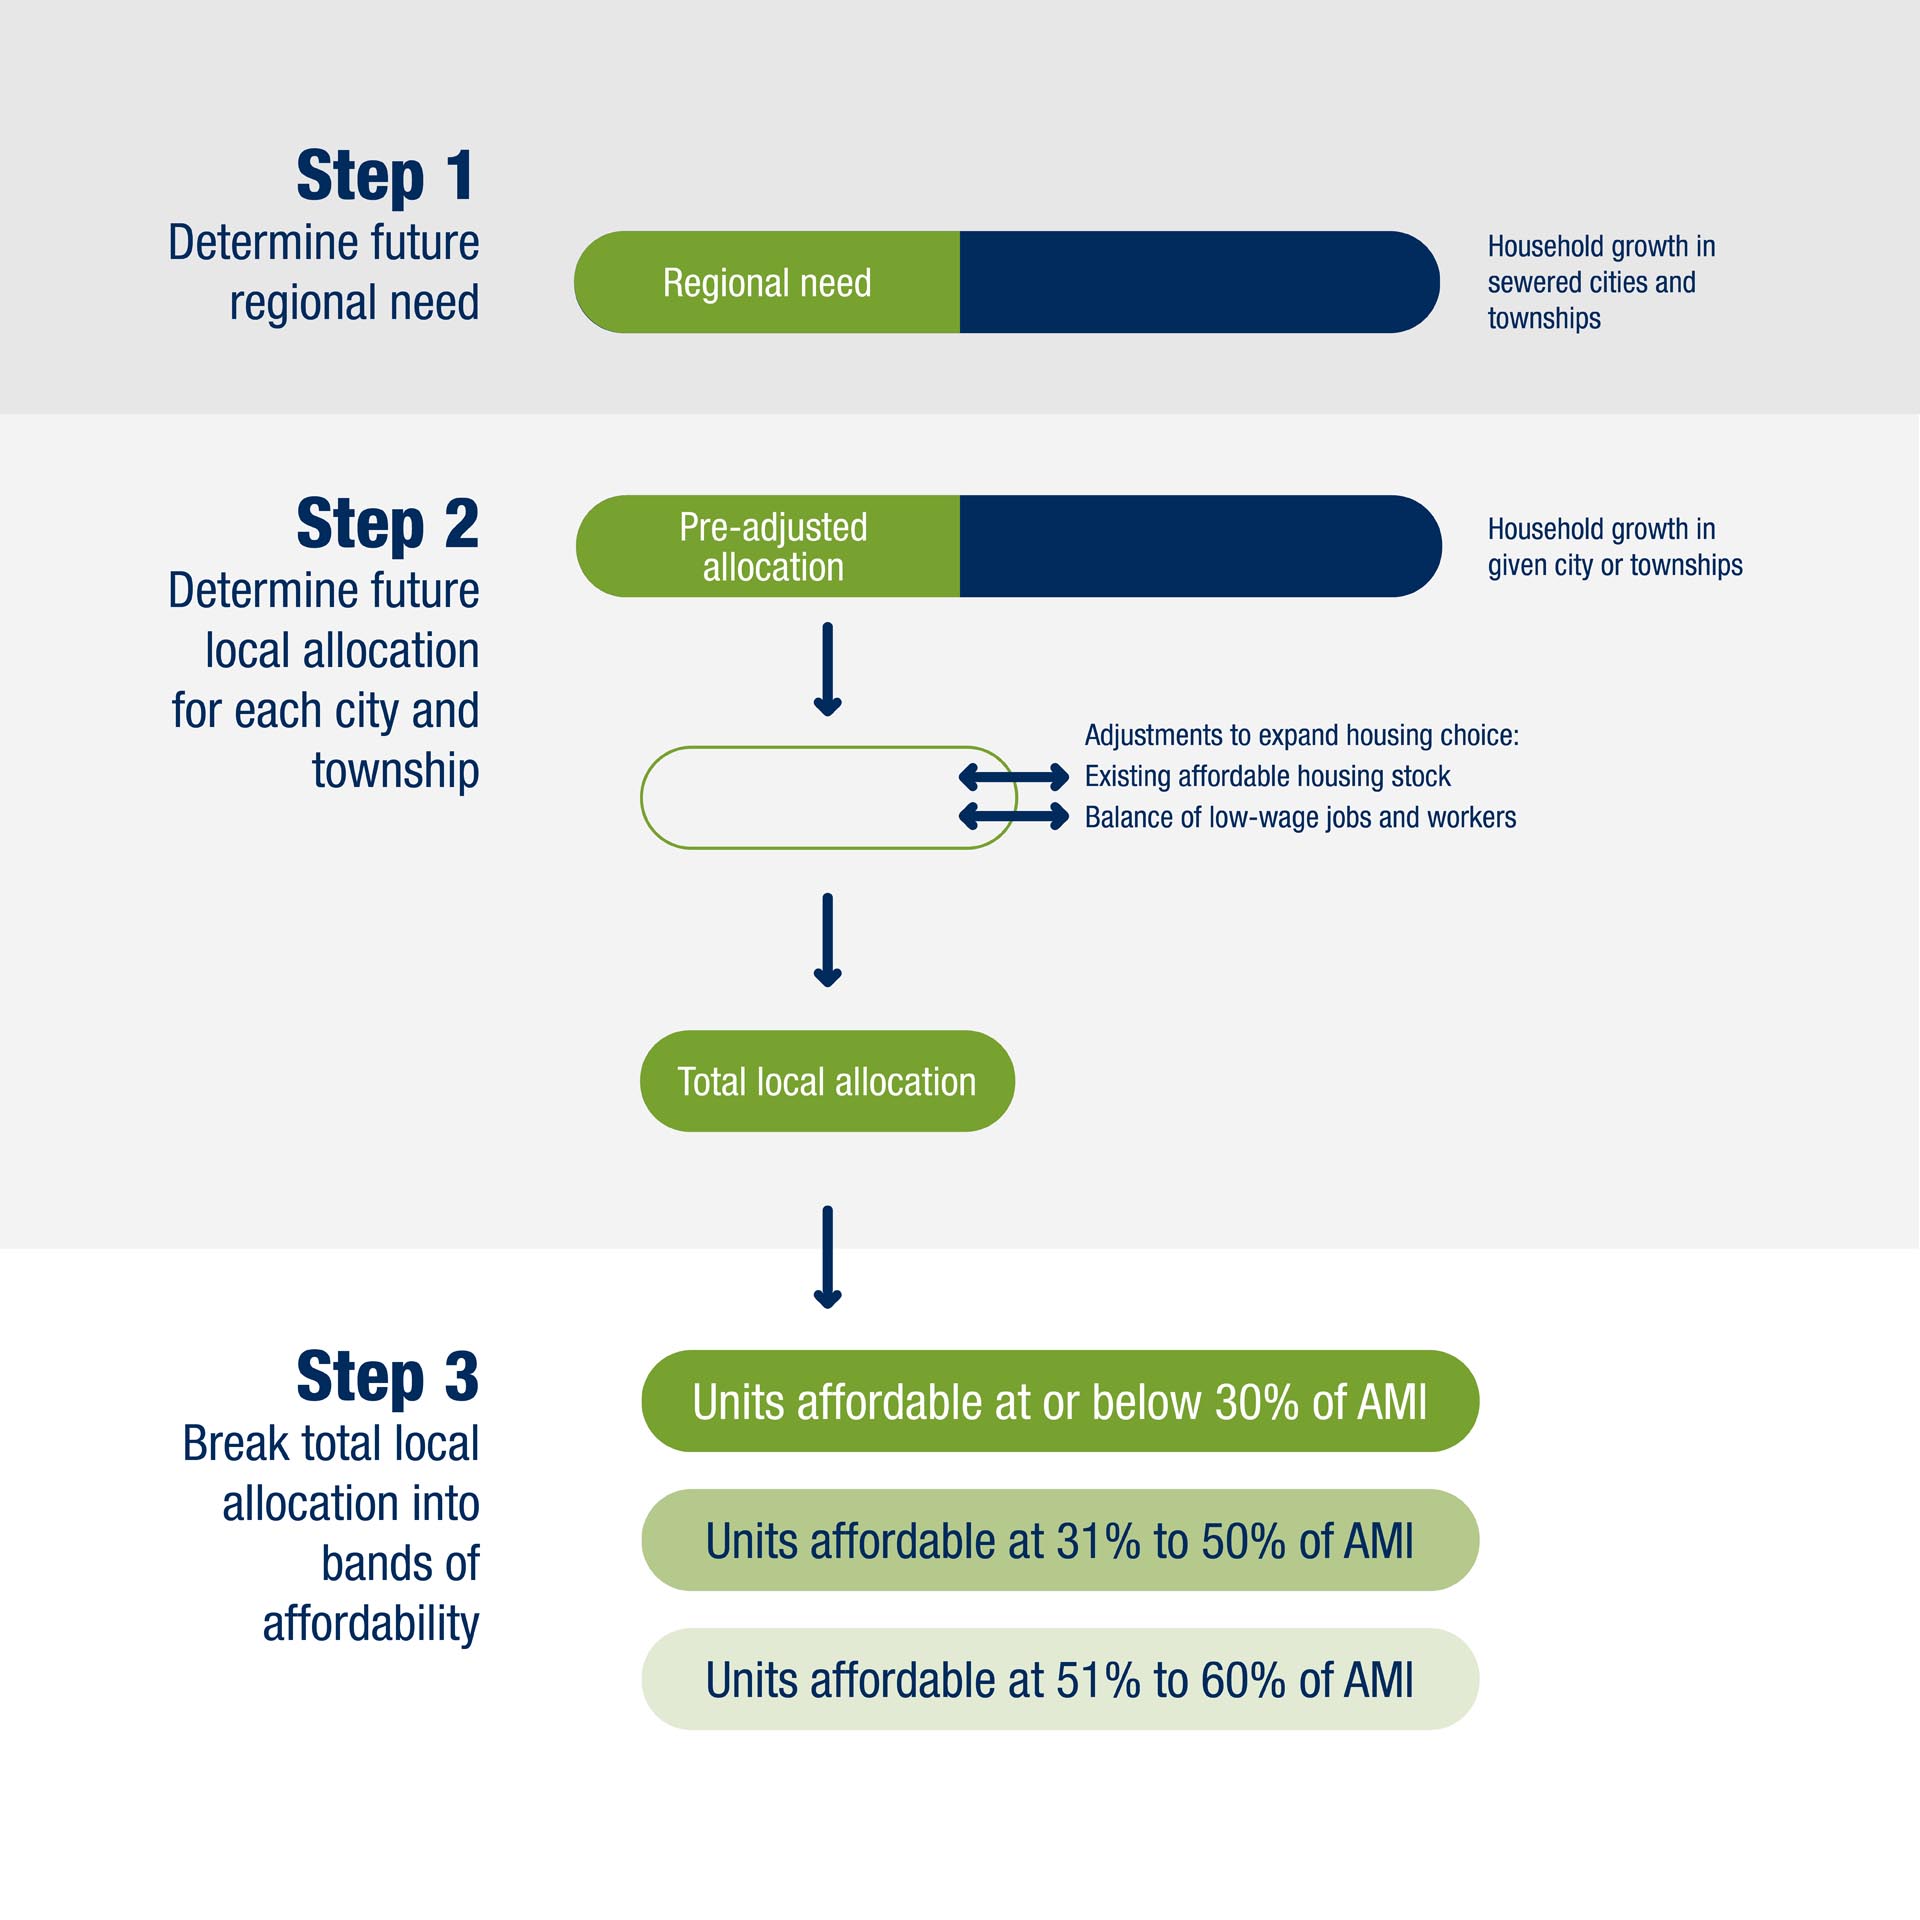
The allocation process has three main steps, as shown in the figure below. The first step requires forecasting the proportion of net 2031-2040 household growth that will require additional affordable housing units, resulting in a total regional Future Affordable Housing Need (Future Need) of 39,700 new affordable housing units. In the second step, we allocate the total regional Future Need to each city and township in the region with sewer service, making adjustments that allocate relatively more additional affordable housing where the housing will expand housing choices the most. In the third step, we distribute each adjusted local allocation into three bands of affordability.
Methodology for the allocation of Future Affordable Housing Need for the 2031 to 2040 decade
The following sections describe each of the three steps behind the Future Need allocation. A figure of the allocated Future Need for sewered cities and townships can be found in Appendix B.
Step 1: Forecast the number of new affordable units needed in the region
The Met Council’s proposed regional forecast shows that the region will have 1,349,733 households in 2030 and 1,450,420 in 2040. Of the 100,687 additional households the region is expected to add between 2030 and 2040, around 40% will have incomes at or below 60% AMI. These projections come from historical income distribution patterns, applied to 2030 and 2040 household forecasts.
Not all low-income households will need additional affordable housing units. Some will be low-income households, such as older households, who own their home outright without experiencing cost burden. To determine how many of the low-income households will need additional affordable housing units, we need to filter out those households, resulting in an adjusted regional total of 37.9% (38,154) of added low-income households requiring additional affordable housing units.
If the region only added the 38,154 housing units identified above, the market for affordable housing would continue to become increasingly tight, therefore a healthy vacancy rate relative to the income band is applied to the total regional Future Need. To ensure a 3% to 5% vacancy rate that is required for a healthy housing market, the region needs 39,700 additional affordable housing units: 21,150 at 30% or less AMI, 13,700 at 31% to 50% AMI, and 4,850 at 51% to 60% AMI, yielding a total regional Future Need of 39,700 units.
Step 2: Develop the total allocation for each sewered city and township
The 39,700 total affordable units should be allocated across the region’s communities in a way that places relatively more affordable housing units where they will expand housing choices the most. Recognizing that Met Council policies do not encourage development beyond sewer-serviced areas, we allocated a Future Need only for the 124 cities and townships with sewer service for the 2031-2040 decade.
A city or township’s initial “pre-adjusted” allocation is proportionate to its local forecasted household growth: the more households it is expected to add, the higher its allocation will be. Forecasts for each city and township already incorporate the following factors specific to that city or township and how much housing they can support or are expected to add such as:
- Planned land use
- Transit access
- Economic activity and migration
For the 2031-2040 decade, the pre-adjusted allocation is 42.2% of each sewered local government’s forecasted household net growth. This percentage comes from dividing the region’s Future Need (39,700) by the forecasted household growth across all sewer-serviced areas (94,017). The pre-adjusted allocation is then adjusted upwards or downwards according to the balance of low-wage jobs and workers and the existing affordable housing stock in a community. The pre-adjusted allocation is adjusted as follows:
- Existing affordable housing stock: A local allocation is increased if its existing affordable housing share is less than that of the average city or township with sewer service. A local allocation is decreased if its existing affordable housing share is greater than that of the average local share.
- Balance of low-wage jobs and workers: A local allocation is increased if the city or township brings in workers in low-wage jobs to a greater extent than the average. A local allocation is decreased if it brings in workers in low-wage jobs to a lesser extent than the average. This is measured by the ratio of low-wage jobs to residents working in low-wage jobs.
Step 3: Break down total local allocations into bands of affordability
Low-income households have a wide variety of needs and preferences for the types and locations of their housing. To provide nuance, and highlight the needs for households at different income levels, the Met Council is allocating Future Need into three bands of affordability:
- Need for housing units affordable to households with incomes at or below 30% of AMI (53% of the regional Future Need)
- Need for housing units affordable to households with incomes between 31% and 50% of AMI (35% of the regional Future Need)
- Need for housing units affordable to households with incomes between 51% and 60% AMI (12% of the region Future Need)
Simply applying these regional shares to each local adjusted allocation does not reflect the diversity within the city or township’s existing housing stock. For example, a city or township might have a higher-than-average share of housing in the 51-60% AMI band and lower-than-average shares of housing in the other two affordability bands. To expand housing options and choice we would reduce the city or township’s allocation in the 51-60% AMI band and increase its allocation in the other two affordability bands.
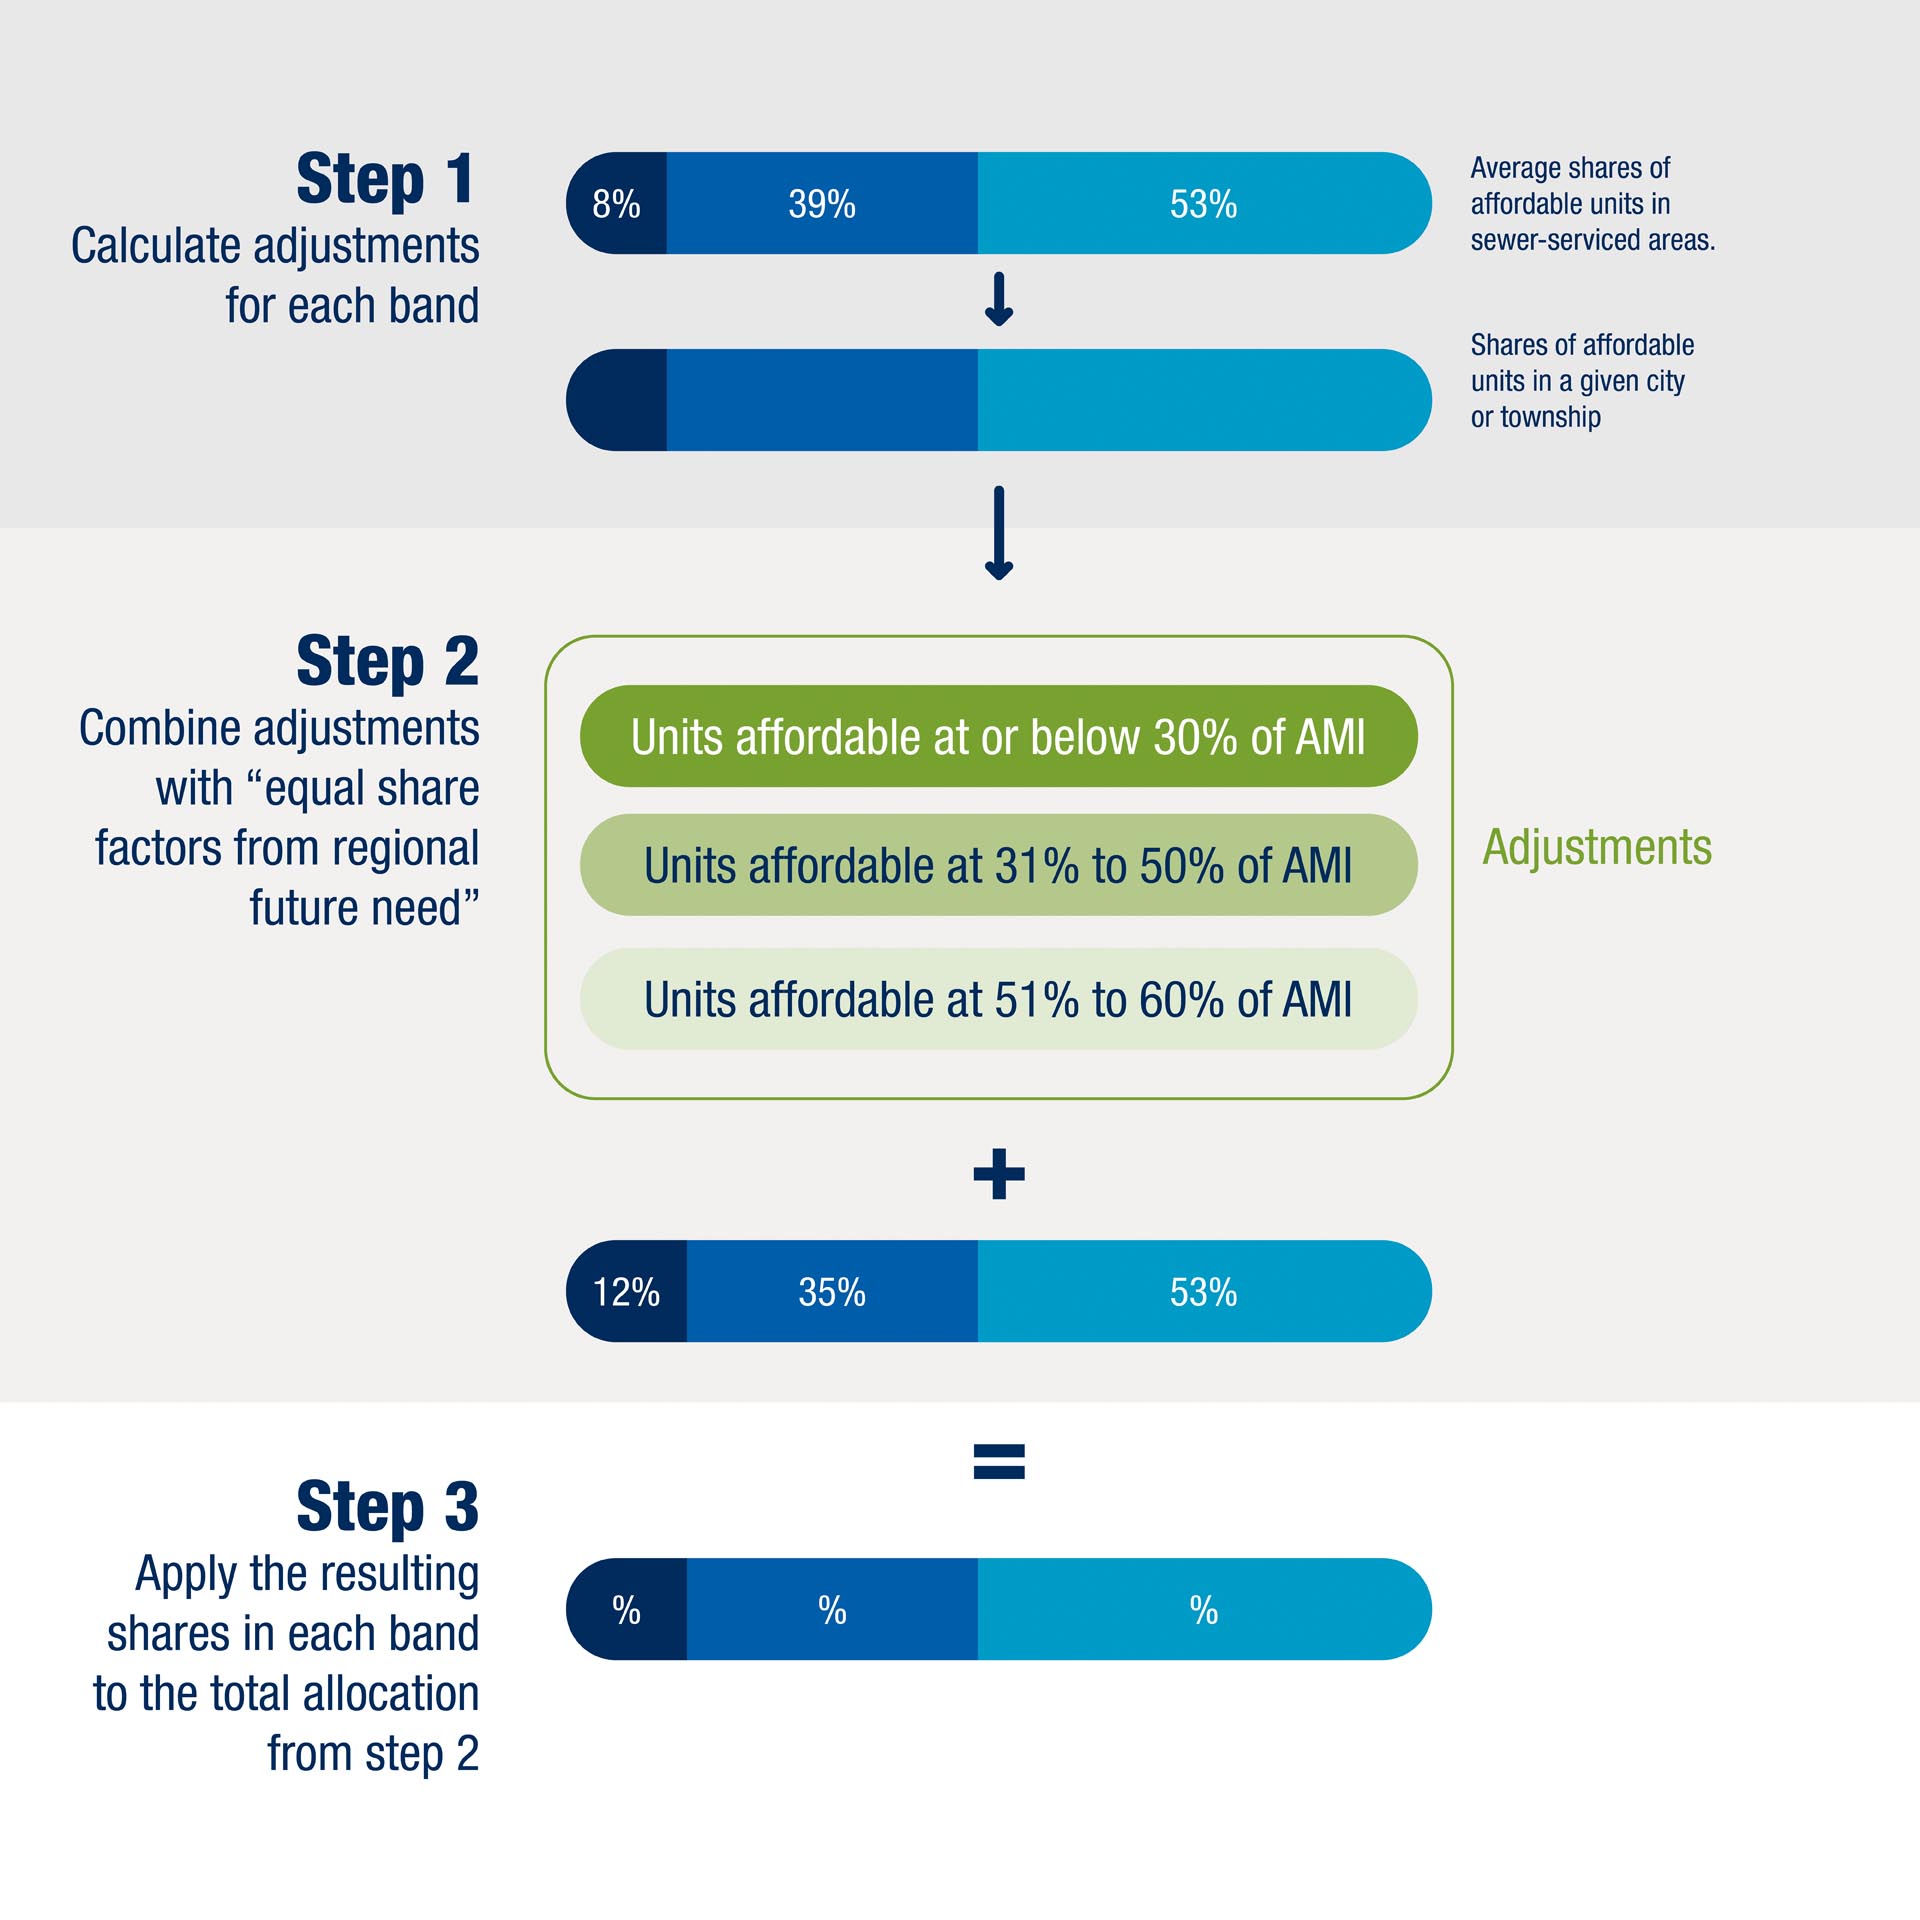
Overview of the breakdown of the total local allocation of Future Affordable Housing Need into bands of affordability
In this part we examine the shares of each city and township’s affordable housing in each AMI band and compare them to the average shares of all sewered cities and townships. The difference between them provides an adjustment that will help determine the share of each city and township’s total allocation to place in each band. The affordability of units used to determine the existing housing stock in a city or township are holistic and include both subsidized and unsubsidized housing units.
When this adjustment is combined with the regional shares of each AMI band, this results in each city or township’s share of its allocation for each band. This share is then applied to the total local allocation for the city or township to calculate the number of units needed in each band. This adjustment does not change the overall allocation for cities and townships developed in Step 2; it is simply assigning different shares of each city or township’s allocation to different affordability bands. Accordingly, we are not examining differences across communities in the overall levels of affordable housing, but differences in affordability within each city or township’s set of affordable units.