Regional Vision, Values, and Goals
Introduction to the regional development guide
Table of Contents
Imagining and Planning for an Equitable and Resilient Future
The role of regional planning
How Imagine 2050 is organized
How this plan works and relates to the other Met Council plans
Dakota Makoce k'a Mni Okiciyaka
One decade's two eras: How our region has changed since 2014
Socially and environmentally, our region is changing
The people of our region
Our region's economy
Regional Vision, Values, and Goals
Vision for Imagine 2050
Shared regional values
Regional goals
Our region is equitable and inclusive
Patterns of historical injustices
Equity framework
Environmental justice framework
Anti-displacement framework
Community-centered engagement
Land, water, and people acknowledgment and Met Council commitments to act
Our communities are healthy and safe
Health and safety begin in communities
Social connection combats the loneliness epidemic
A built environment where residents "feel seen" cultivates a sense of dignity
Rewarding lives are created in communities where residents feel safe and respected
Healthy and safe communities in Imagine 2050
Our region is dynamic and resilient
Our region's economic assets
What holds our economy back now and in the future
Opportunities for an economically resilient future
We lead on addressing climate change
Renewed commitment on climate
Climate connections to natural systems
Climate connections to environmental justice
Regional greenhouse gas emissions
We protect and restore natural systems
Connection to climate change
Connection to American Indians and traditional knowledge
Connection to state efforts and Met Council roles
Risks and opportunities related to natural systems
Imagining and Planning for an Equitable and Resilient Future
When the Minnesota Legislature created the Metropolitan Council in the late 1960s, they were motivated by the conditions in the Twin Cities metro region to imagine a better, coordinated way forward. We were given the challenge to consider the long-term future of our communities as a whole. To effectively apply that long-term lens, we need to be able to imagine what is possible in the future.
While our region is thriving in many ways, we have also faced significant challenges in recent years, from the COVID-19 pandemic to civil unrest, and other social and economic changes. As we look out to 2050 and imagine the region we want to have, we need both the innovation and expectations that live in our imagination. Looking into the future and pairing that with the possibility of providing an equitable and resilient future for generations to come compels us to think creatively about how we get there. This plan, however, is far from imaginary. It is grounded in the policy and investment directions for the region’s future, with objectives to guide our specific work, and policies and actions to implement.
As directed by state law, the Met Council is responsible for preparing a comprehensive development guide for the seven-county metropolitan area. Imagine 2050 is the shared vision for the future of our region through 2050. While the Met Council is responsible for developing Imagine 2050 and plans for housing and the three statutory regional systems – wastewater, transportation, and regional parks – the vision in Imagine 2050 can only be accomplished through partnerships across the region with residents, local governments, nonprofit organizations, businesses, and philanthropic organizations.
Imagine 2050 tackles issues that are greater than any one neighborhood, city, township, or county alone can solve or address to reach the regional vision. Our region has tackled complex challenges in the past. This plan builds on our region’s past planning accomplishments and drives toward the regional vision with a focus on residents of the region, increased partnerships in the region, and integrated planning approaches across the Met Council’s responsibilities.
The role of regional planning
Under state statute, the Met Council is responsible for developing the comprehensive development guide:
The Metropolitan Council shall prepare and adopt, after appropriate study and such public hearings as may be necessary, a comprehensive development guide for the metropolitan area. It shall consist of a compilation of policy statements, goals, standards, programs, and maps prescribing guides for the orderly and economical development, public and private, of the metropolitan area. The comprehensive development guide must recognize and encompass physical, social, or economic needs of the metropolitan area and those future developments which will have an impact on the entire area including but not limited to such matters as land use, climate mitigation and adaptation, parks and open space land needs, the necessity for and location of airports, highways, transit facilities, public hospitals, libraries, schools, and other public buildings. (Minn. Stat. 473.145)
The Met Council develops a comprehensive development guide at least once a decade following the updates to the long-term forecasts that follow the decennial U.S. Census. Imagine 2050 encompasses the requirements of the comprehensive development guide as well as the policy and system plans. All of these elements were developed in coordination with one another in order to better align the regional planning efforts and realize opportunities to further advance regional goals. State statute defines three metropolitan systems plans:
- Transportation Policy Plan (Minn. Stat. 473.146)
- The development of the Transportation Policy Plan also is guided by federal transportation planning requirements.
- Water Policy Plan (Minn. Stat. 473.146 and 473.157)
- The Water Policy Plan also includes the Metropolitan Area Water Supply Plan (Minn. Stat. 473.1565)
- Regional Parks and Trails Policy Plan (Minn. Stat. 473.147)
In addition to the three statutory metropolitan systems plans, Imagine 2050 includes a Housing Policy Plan. The Housing Policy Plan provides an expanded policy framework to inform the Met Council’s review of the housing elements and housing implementation programs of local comprehensive plans required in statute (Minn. Stat. 473.859, subd. 2 and subd. 4) as well as direction for our housing-related programs.
Imagine 2050 assists local governments to create consistent, compatible, and coordinated local comprehensive plans that together advance local visions within the regional policy framework and help ensure efficient and cost-effective regional infrastructure. The Met Council reviews local comprehensive plans based on the requirements of the Metropolitan Land Planning Act, state and federal guidelines referenced in this document, and the policies contained in all chapters of the comprehensive development guide. The Met Council considers each local comprehensive plan’s compatibility with the plans of neighboring and affected jurisdictions, consistency with adopted Met Council policies, and conformance with metropolitan system plans.
If the Met Council finds that a community’s local comprehensive plan is more likely than not to have a substantial impact on or contain a substantial departure from metropolitan system plans, the Met Council can require the community to modify its local plan to assure conformance with the metropolitan system plans (Minn. Stat. 473.175)
How Imagine 2050 is organized
Imagine 2050 describes the region’s values and vision for 2050 and the goals, objectives, policies, and actions to achieve it, given the region’s existing conditions and emerging trends. Regional goals are broad directional statements that more specifically describe the desired end states for the region. These goals are shared across all policy and system plans included in Imagine 2050 (housing, land use, water, regional parks, and transportation).
Specific to each policy and system plan chapter are objectives, policies, and actions that together advance the shared regional goals and the regional vision. Objectives articulate the achievable results that advance each regional goal. Regional policies are the statements of intent and approach to regional issues or topics, independently and with partners. Policies are implemented through specific actions by the Council and partners.
How this plan works and relates to the other Met Council plans
While the Met Council has developed Imagine 2050 as a consolidated comprehensive development guide inclusive of the systems and policy plans, we recognize that different components of Imagine 2050 are required to be updated more frequently than the decennial planning process and that other amendments may be needed in policy plans from time to time. To that end, chapters of Imagine 2050 (for example, the 2050 Transportation Policy Plan) are intended to be independently updated and amended as required by the applicable state and federal statutes and following the procedures already established for them. Amendments to a chapter do not necessarily require amending the whole of Imagine 2050.
During the development of Imagine 2050, the Met Council convened an American Indian Advisory Council, described in greater detail elsewhere in this document. The Advisory Council created the paragraphs included here that acknowledge and describe the importance of the region’s land, water, and people to the Dakota people.
Dakota Makoce k’a Mni Okiciyaka
Dakota Land, Water, and People Acknowledgment
The seven-county region sits upon a creation site of the Dakota Oyate, where Mnisota Wakpa (Minnesota River) and Haha Wakpa (Mississippi River) converge on a sacred site called Bdote (where the rivers meet). Mni Sota Makoce (The Land of Mist), also known as Minnesota, holds immense significance as the origin of Dakota identity, languages, stewardship practices, and ways of life. For the Dakota people, there is not a separate creator and creation, a belief that is meaningfully encapsulated in the saying "Mitakuye Oyasin," which translates to "we are all related." This interconnectedness guides the original instructions the Dakota hold for the land, their traditions, and their place within the broader circle of existence. It is the spiritual source from which the Dakota Oyate originated and where they committed themselves to conserve, transmit, and steward their ancestral lands and ways of life for the next seven generations. For countless generations, Mni Sota Makoce has always been the primary identity shaper for the national character and life of the Dakota Oyate.
Land that makes up Minnesota is also the ancestral homelands of the Ojibwe, Ho-Chunk, and the Ioway peoples. Violent settler-colonial policies – such as the passing of the Homestead Act, which facilitated the influx of settlers into these lands, and the 1863 Dakota Removal Act, which resulted in the systematic incarceration and forced displacement of most Dakota people from Minnesota – and other historical injustices and traumas inflicted upon the Tribal communities have had far-reaching and enduring impacts. Despite the legacy of genocide, the sovereignty of Tribal Nations and the right to exist as distinct Nations persist to this day.
The Metropolitan Council acknowledges that the land we currently call Minnesota, and specifically the seven-county region, is the ancestral homeland of the Dakota Oyate who are present and active contributors to our thriving region. The Metropolitan Council commits to address the unresolved legacy of genocide, dispossession, and settler colonialism and the fact that government institutions, including the Metropolitan Council, benefitted economically, politically, and institutionally after the forceable removal of the Dakota Oyate. The Metropolitan Council is dedicated to action – starting with the 2024 Land, Water, and People Commitments – to support the Dakota Oyate, the 11 federally recognized Dakota and Ojibwe Tribes in Minnesota, Ho-Chunk Nation, and the American Indian Communities representing over 150 diverse Tribal Nations that call the seven-county region home.
We are dedicated to ensuring a rights-based approach in our partnerships and decisions and promoting the well-being of the Dakota and Ojibwe Nations, as well as American Indian communities in the seven-county metro region. We will adhere to the Native American Graves Protection and Repatriation Act and Minnesota Private Cemeteries Act, and actively pursue restoration of Dakota Lands where feasible, recognizing the importance of returning lands to their rightful stewards.
Landscape of the Region
Across nearly 3,000 square miles, centered around the confluence of three major rivers – Mississippi (Ȟaȟáwakpa / Wakpá Tháŋka), Minnesota (Mnísota Wakpá), and St. Croix (Hoǧáŋ Waŋká kiŋ) – live more than 3.2 million people who call the Twin Cities region home.1,2 Our mid-sized midwestern metro has much to offer the people who live, work, and play here.
The integration of our region’s built environment and natural systems is the foundation of a high quality of life valued by our residents, from new arrivals to multigenerational Minnesotans alike.3 From the clean waters above and below ground that make our lives, neighborhoods, and economy possible, to our nationally renowned parks and trails, our region’s diversity in landscapes and outdoor recreation is unique for a major metropolitan area and reflects a long history of thoughtful planning for growth and environmental stewardship.4
As a key road, rail, and air hub for the Upper Midwest, our regional transportation system is well-developed and reliable, with multimodal freight infrastructure, a highway system, and a growing public transit network. Since our last regional development guide was adopted in 2014, several major transit investments were completed: the METRO A, C, and D lines, our region’s first mixed-traffic bus rapid transit (BRT) lines, and our second light rail line, the METRO Green Line. Two additional transit projects – extensions of the METRO Blue and Green Lines – secured federal and local approvals. Not only does the regional transportation system facilitate our region’s strong and industry-diverse economy, but new transit infrastructure has sparked more housing development, particularly multifamily housing.5
Infrastructure and investments in our regional parks, wastewater, and transportation systems support vibrant and varied communities across the region, but it is the investments in our residents that create the greatest returns: Our strong regional economy is underpinned by state, county, and local funding of education, health care, and social services. Minnesota is nationally recognized for high levels of educational attainment and home to a considerable number of educational institutions, including 37 trade schools, colleges, and universities, which attract students from around the world. Minnesota often ranks above the national average for health care quality and costs, rates of insurance coverage, and health outcomes (despite large inequities by race, income, and disability status describe later).6,7 Lastly, the people of our region and state invest in themselves as well through strong civic engagement, such as high rates of volunteerism and voter turnout.8
The high quality of life in our region isn’t happenstance. It reflects a shared commitment to the betterment of our region even in the face of great challenges – perhaps especially so. The decades of partnership and a civic tradition of shared action by a variety of partners across the region have been foundational to the successes the region has achieved and equipped this region to successfully overcome challenges it has faced.
Underlying the civic tradition is the coordinated, regional planning approach that was at the heart of the establishment of the Metropolitan Council and further defined in the Metropolitan Land Planning Act. Community leaders then saw the value in collaboration to solve regional issues. As then Governor Harold LeVander noted, the Metropolitan Council “was conceived with the idea that we will be faced with more and more problems that will pay no heed to the boundary lines which mark the end of one community and the beginning of another.”
Through those partnerships, we were able to identify the most pressing regional issues and plan ahead – rather than react to – those issues. Our region has also been able to imagine the future we want to have and to deliver on that vision for a high quality of life and a world-class metropolitan area. Looking ahead, the Twin Cities region is uniquely positioned to build on our past successes and to take on the challenges of today and tomorrow.
One decade’s two eras: how our region has changed since 2014
The Twin Cities region had begun a definitive upswing in 2014, following years of economic turmoil resulting from the Great Recession. By September 2013, the region surpassed its previous peak employment, thanks in part to key industries of our economy.9 This period of economic expansion continued until early 2020. In 2012, median household income began to rise again for the first time since the recession began in 2008.10 However, heightened poverty and unemployment rates among the region’s Black and American Indian populations remained, widening inequities in economic well-being compared with the white population.11
Rapid multifamily development led new housing production overall.12 Most of these new units were built in urban areas, particularly Minneapolis, marking a shift in the region’s development patterns – prior to the recession, most new housing was built in suburbs and the developing edge of the region. Though increased housing production was sorely needed after years of standstill, the production of new affordable housing was only a small share of this new housing market activity and well below what was needed to serve our region’s current and future low- and moderate-income households.13 The lack of new affordable housing production, coupled with development pressures resulting in losses of naturally occurring affordable housing, slowly eroded housing stability.14
Not all trends are quantifiable: Narrative shifts in our regional conversation hold power, too. Between 2012 and 2014, the Met Council completed a federally required fair housing and equity assessment of the Twin Cities region. The report analyzed spatial patterns of race and income, and described how uneven access to different opportunities based on location reinforced our region’s large and persistent inequities by race and ethnicity across nearly all dimensions, from poverty to education to homeownership.15 During the public comment period of Thrive MSP 2040, Met Council was repeatedly called upon to turn the report’s findings into a commitment to use our influence as a regional planning agency and name equity as a regional outcome – and we did. As equity became part of local comprehensive plans and more deeply embedded into regional planning, policies, and investments, dialogue about equity matured from simply reciting present-day inequities to a more thorough look at root causes and systems.16
This momentum—here and everywhere else—was halted in March 2020 when the World Health Organization (WHO) declared an outbreak of a new novel coronavirus (COVID-19) as a global pandemic.17
COVID-19 pandemic upends and reshapes our lives
Public health and peacetime emergencies orders were made at every level of government. Within weeks, stay-at-home mandates were issued, schools and universities closed, and nearly all areas of the U.S. economy shutdown to “flatten the curve” and “stop the spread.”
Job losses were staggering. In February 2020, the region’s economy was strong with just over two million jobs. Two months later, 283,000 fewer jobs were reported, a decline of 14%.18 The COVID-19 pandemic upended people’s everyday lives and four years later, many remain that way.
The health, economic, and social impacts of the COVID-19 pandemic were extraordinary and touched every corner of our region. That they were largely borne by the region’s vulnerable and marginalized population groups was not. Like previous economic downturns, the pandemic simply made structural inequities across population groups in the Twin Cities region more visible. For example:
- American Indian, Black, and Latine communities experienced higher rates of COVID-19 infection and deaths, mirroring pre-existing racial disparities in overall health and health insurance coverage in Minnesota.19,20 People with disabilities, LGBTQ+ people, and people who lack housing stability or were unhoused also experienced elevated rates of COVID-19 infection relative to their share of the population.21 Older adults (over age 65) were far more likely to succumb to COVID-19, particularly those in long-term care facilities.22
- Workers of color and immigrant workers experienced the highest unemployment rates during the shutdowns. Though federal relief packages and expanded unemployment insurance benefits helped to offset some of the initial economic shock waves – temporarily reducing disparities in lost income by race and ethnicity – immigrant and refugee workers, especially undocumented workers, were not eligible.23,24
- People with disabilities have benefited from employers’ widespread adoption of remote work arrangements, as observed in increased labor force participation in Minnesota.25 At the same time, more people became disabled because of the pandemic.26,27
- Nationwide, young adults, people who identify as LGBTQ+, and people with disabilities were more likely to report heightened rates of anxiety and depression compared to pre-pandemic years.28
Not all impacts were as tangible as those described above; in fact, the pandemic brought physiological concepts such as “ambiguous loss” (a sense of grief, confusion, or anxiety that results from a loss that is unclear or lacks resolution) and Prolonged Grief Disorder (intense and persistent grief that interferes with daily life) into mainstream conversation.29,30 The simple fact is that everyone lost something, if not someone, in the pandemic. The impacts of such widespread grief are still unfolding for many individuals, within our communities, and across society at large.
As the COVID-19 pandemic compromised people’s lives and livelihoods, it also altered our daily interactions with our region’s built and natural systems. These trends were shared across large metros in the U.S. to varying degrees.31
COVID-19's lasting impacts on Minnesotans
- Nearly 2 million cases of COVID-19 have been reported across the State of Minnesota as of January 2025. Infection rates have largely mirrored already well-established health and health care inequities, with disproportionately higher rates among American Indian, Black, and Hispanic/Latine communities. Older adults, especially those living in long-term care or other institutional settings, also experienced heightened rates of infection and serious illness.
- Nearly 16,500 Minnesotans have lost their lives since the pandemic began, including 8,300 residing in our seven-country region.
- Over 238,000 COVID-related hospitalizations have taken place across Minnesota since the pandemic began, including 66,000 in the region.
- An estimated 365,000 adults in Minnesota may have experienced Long COVID symptoms, most commonly fatigue, trouble breathing, and brain fog.
Whether the result of a missed milestone, cancelled event, disruption of a job or schooling, the past four years had limitless ways of creating a sense of grief and loss, challenging our individual and collective resilience.
People spent more time outdoors for recreation, exercise, social gatherings, and mental health – a trend noted in various regional data. For instance, visits to our Regional Parks and Trails System considerably increased between 2021 and 2022.32 And, according to the Travel Behavior Inventory, walking as a mode of transportation was also up across most areas in the region between 2019 and 2021.33
Changes in people’s travel behavior and shifts in the transportation needs of businesses have impacted the regional transportation system in various ways. Many workers ended their daily commutes.34 In 2021, one in every nine of the region’s 2.8 million workers worked from home, a share that is largely consistent across the region’s seven counties.27F35F34F35 Once thought to be temporary, remote and hybrid work arrangements are shaping up to be a permanent feature of the post-COVID economy.36 For example, with less demand for trips to and from workplaces, the region’s public transit experienced significant losses in ridership. In 2021, region-wide transit ridership was about 42% of 2019 ridership.37,38 Even with less vehicle travel overall, traffic fatalities and serious injury crash rates in the Twin Cities metro increased in 2020 and 2021.39
Housing choices expanded for some households but narrowed for many during the pandemic. Lost and reduced income increased housing instability, especially for renters, who already had high rates of housing cost burden. Federal, state, and local authorities enacted protections such as eviction and foreclosure moratoriums, emergency rental assistance, and mortgage forbearance and loan modification programs to prevent widespread housing losses during the pandemic’s peak.40 Research suggests the effectiveness of these programs was mixed, however.41,42,43 Further, most housing protections ended sometime in 2021, despite only partial economic recovery and the still-high prevalence of COVID-19.44 In contrast, more financially secure households took advantage of historically low mortgage interest rates in 2020-21 to better align their housing situation with their household’s needs and preferences.45
Thirty-eight months after COVID-19 was declared a pandemic, the federal public health emergency expired – a new beginning that somehow also lacked a conclusive end. The first two years of the post-pandemic recovery (2023 and 2024) have ushered in new headwinds across U.S. metro areas including the tightening labor markets due to workforce shortages; rising consumer costs, especially in housing; and high vacancy rates and property value losses in office and commercial spaces, particularly in urban downtowns.46 While the challenges may not be unique, each metro area’s competitive advantages and limitations will inform their response and successes to overcoming these emergent issues.
Socially and environmentally, our region is changing
Our region’s reckoning with racism
The COVID-19 pandemic was both an unprecedented event and a real-time case study of structural inequities in the U.S. healthcare system, economy, housing markets, and immigration systems. The disproportionately negative outcomes of the pandemic for low-income people, Black people, American Indians, people of color, people with disabilities, and immigrants and refugees in our region occurred precisely because the inequities pre-dated the crisis. These inequities, particularly by race and ethnicity, are—and have always been—our region’s most malignant pre-existing conditions (Figure 1).
Figure 1.1: Racial inequities in the Twin Cities Metro
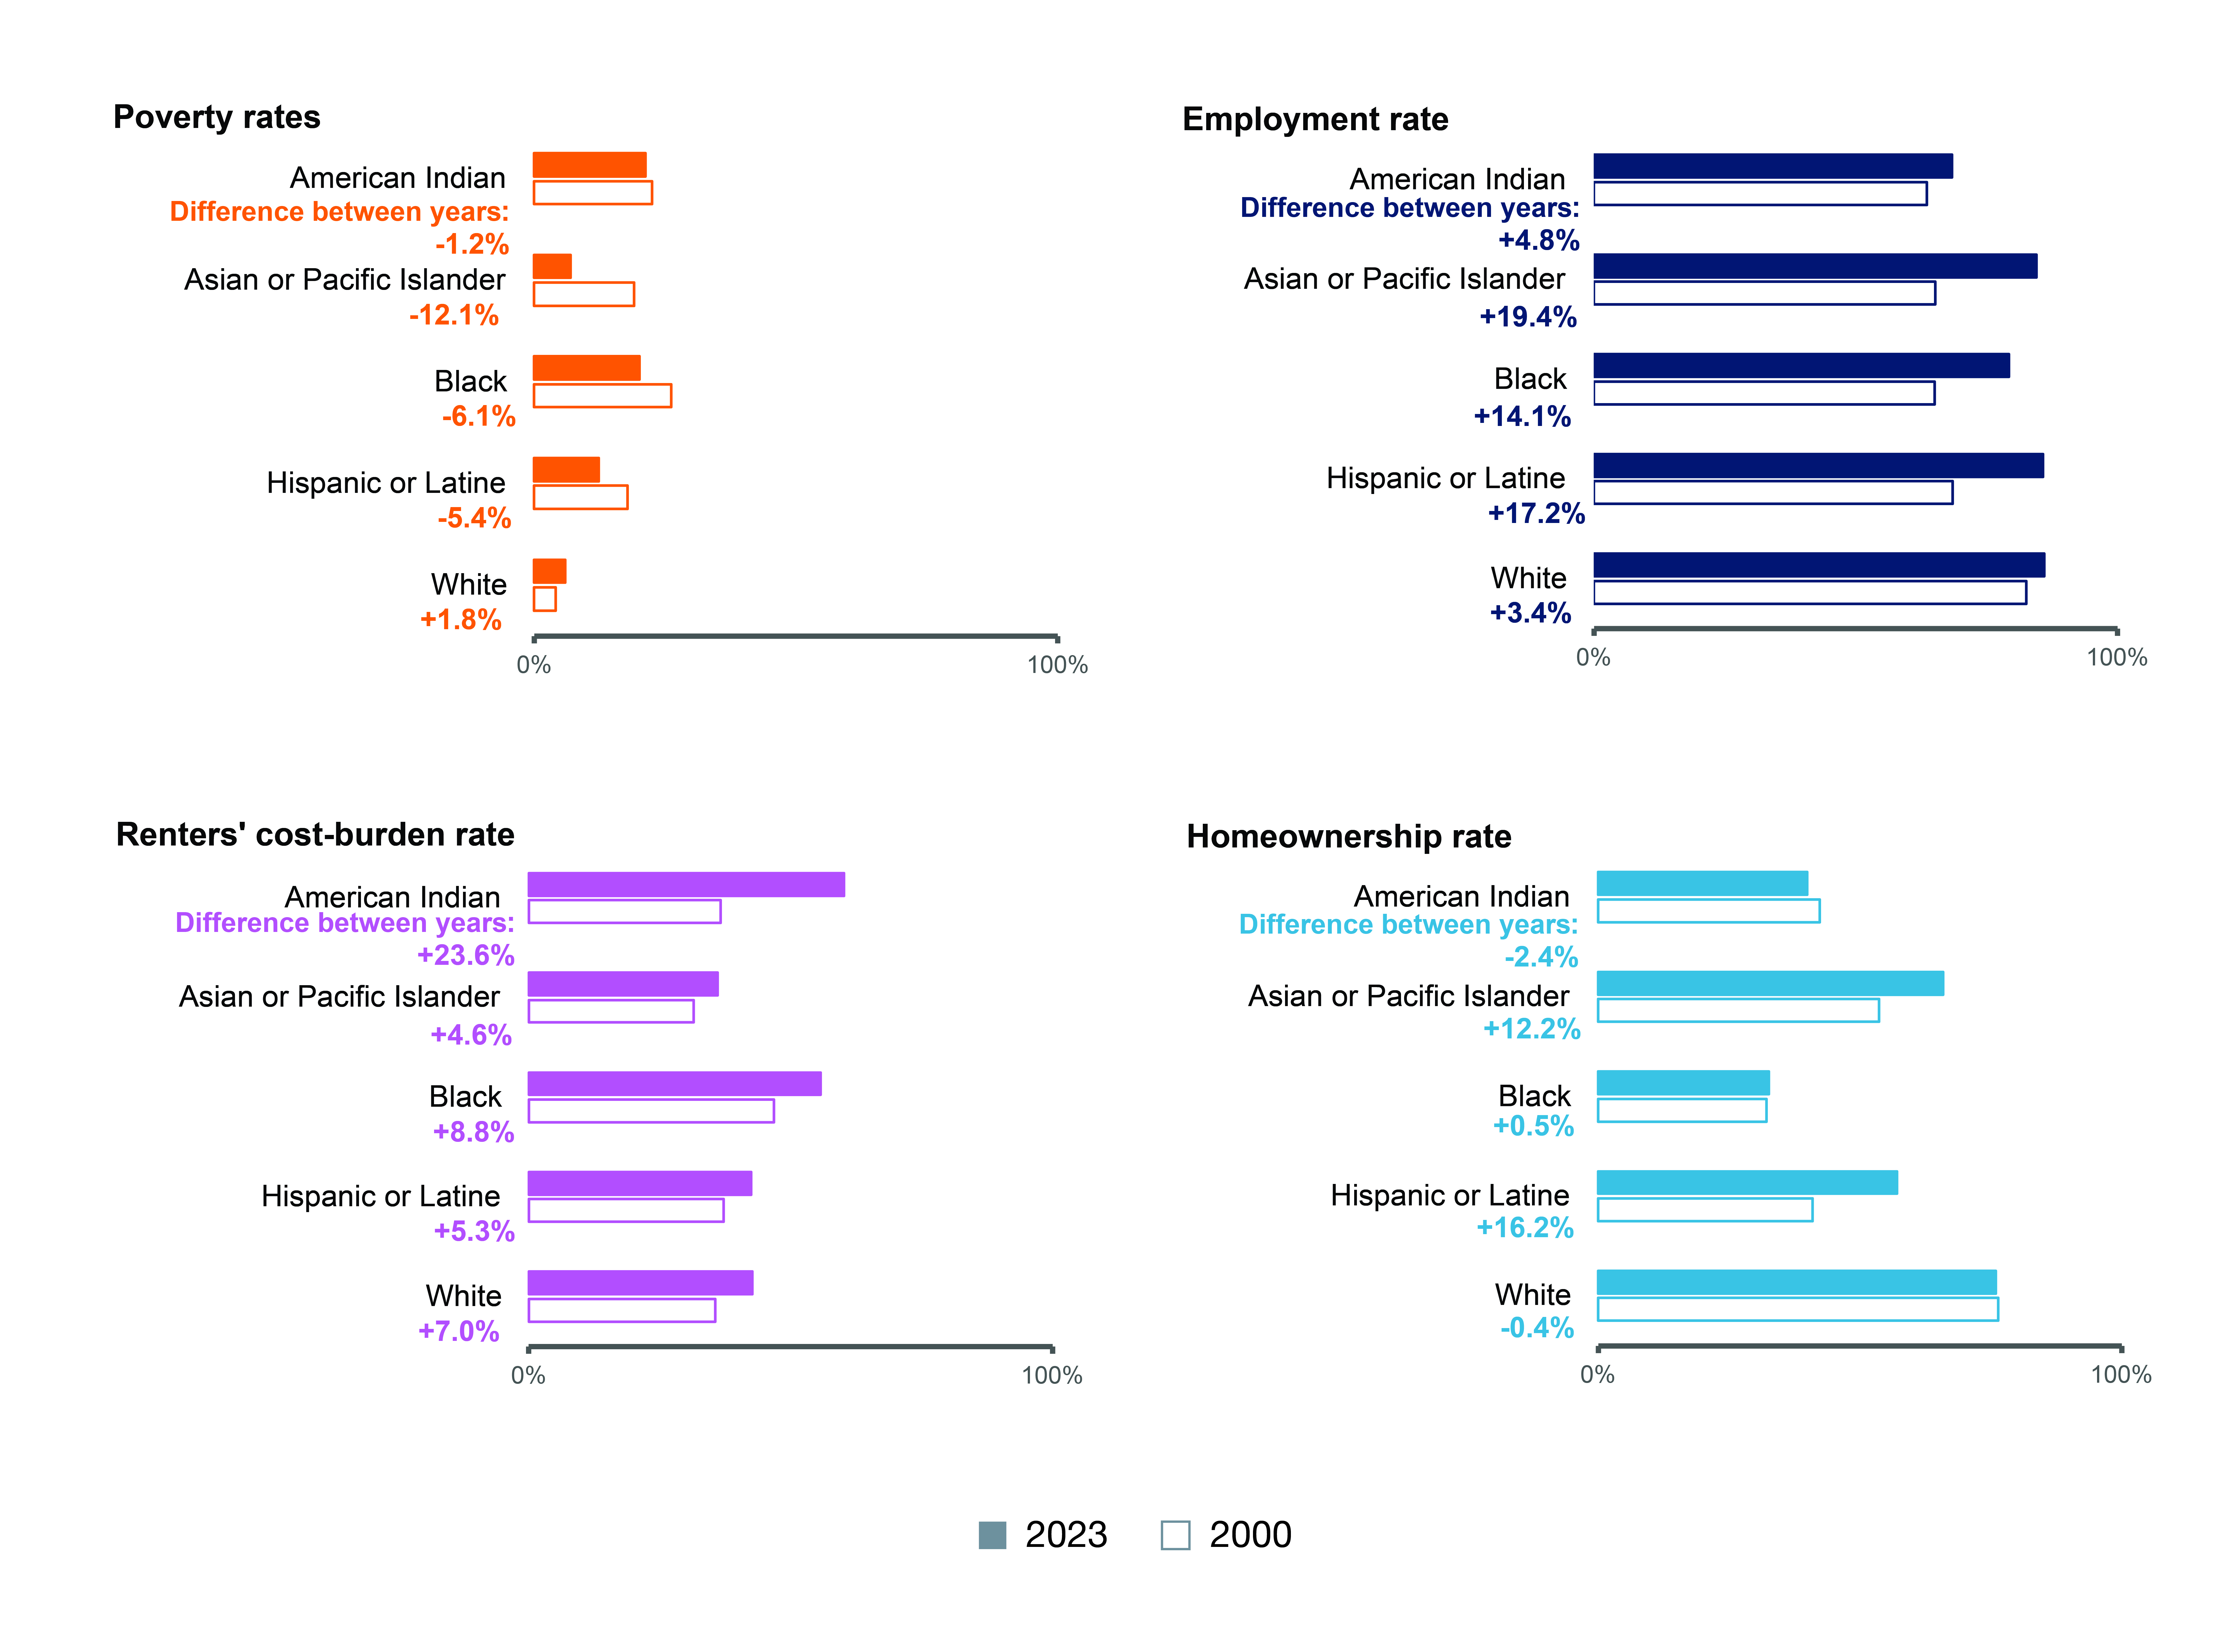
Source: Metropolitan Council analysis of U.S. Census Bureau’s American Community Survey (ACS) One-Year Estimates, Summary Files and Public Use Microdata (ACS PUMS), 2000. 2022 and 2023. Data summarize the 15-county Minneapolis-Saint Paul-Bloomington, MN-WI metropolitan statistical area (MSA) as defined by the U.S. Office of Management and Budget (OMB).
In 2020, the Twin Cities region faced significant challenges beyond the ongoing presence of a global pandemic. In May, following the death of George Floyd while in police custody, protests turned violent, and ultimately, both law enforcement officers from around the state, and the National Guard were called in to assist in restoring order. The four officers involved were immediately fired, ultimately charged criminally, and were sentenced to prison. The cities of Minneapolis and Saint Paul experienced significant property damage, totaling more than $500 million, primarily along the Lake Street corridor, which was one of the most diverse commercial corridors in the region.
Concerns prompted a robust debate over the future of public safety and law enforcement locally, at the state level, and more broadly. Over the next few years, the Minneapolis Police Department lost about a third of its sworn officers to retirement, disability, transfers, and resignations, and as of 2024, staffing remained below the minimum required by city charter. Other police departments in the region, including the Metro Transit Police Department, have struggled to meet their staffing goals since then.
The entire region experienced the impact of overlapping community crises occurring within the same calendar year. Homicides increased 58% in Minnesota between 2019 and 2020. The increase in homicides in the city of Minneapolis was even greater, at 77% year over year. As of 2023, the homicide rate remained well above pre-COVID numbers, although overall crime numbers have been decreasing and returning to a pattern more in alignment with pre-pandemic levels.47
Increases in crime disproportionately impacted Black residents. According to City of Minneapolis data, in 2021, 83% of shooting victims were Black and 89% of suspects with descriptions were Black. In 2021, there was 1 Black shooting victim for every 150 black residents of Minneapolis, with 1 white shooting victim for every 3,768 white residents.48
These recent, history-shaping events highlighted disparate experiences of residents across the Twin Cities region, while also fitting into longstanding patterns within data sets that demonstrate ongoing and persistent racial disparities within regional systems and structures that touch on many aspects of a resident’s daily life. Beyond outcomes-based data, additional data points highlight how discrimination, and its resulting harms are experienced by people of color, ethnic groups, and immigrants.
According to a 2021 statewide survey about experiences with discrimination, 64% of American Indians and 60% of Black adults surveyed said have been called a racial or ethnic slur by someone in Minnesota.49 The same was true for 53% of Hmong and 49% of Latine respondents. Nearly half of adult children of immigrants (49%) also reported this experience. Other findings from the study reveal high rates of perceived and experienced discrimination in employment, policing, and housing that vary across racial or ethnic group but that are consistently high for the Black adults and American Indians surveyed.
The Twin Cities region will need to continue to grapple with and address the acute and broad impacts of racism and discrimination to eliminate existing headwinds to growth, opportunity, and prosperity in the years ahead. What will emerge from a period of pandemic impacts, civil unrest, and overall societal instability remains to be seen. Individuals and communities are adjusting to and recovering from the health and societal changes wrought by COVID-19. The Minneapolis Police Department is now under a consent decree with the Minnesota Department of Human Rights and a consent decree with the U.S. Department of Justice, and a memorial at the site of George Floyd’s murder is currently under development.
At an outcomes level, recent health and economic data do not show meaningfully better outcomes toward racial and health equity than in past years. Across measures such as housing instability, life expectancy, household wealth, access to healthy food, and educational attainment, race remains the most predictive statistical factor in projecting likely outcomes for a resident of the Twin Cities region. Until race is no longer a predictive factor across the region, work remains in the effort to build an equitable, prosperous, and inclusive community in which every resident is valued and can thrive.
We live in a warming, wetter region
Evidence of climate change clearly exists within our region today, and climate impacts are expected to increase and intensify. According to a 2022 survey conducted by the University of Minnesota, 76% of Minnesotans are concerned about climate change, especially youth and young adults.50 The recent summer days filled with wildfire smoke (2021) and a virtually snow- and ice-free winter (2023) are harder to ignore than slower-developing trends, but regional data show that we are already experiencing climate hazards and the human and economic costs associated with these changes.
Temperatures are rising, warming our winters and adding more days of extreme heat and drought events. Between 1895 and 2023, the region warmed 2.5 degrees F.51 The average daily minimum winter temperatures have increased 4 degrees F, and 6 of the 10 warmest winters have occurred since 2000.52 With warmer winter temperatures comes more freeze/thaw cycles, which can be hard on roads and other infrastructure. More frequent freeze/thaw cycles cause an increase in the use of deicing salt, adding additional strain to stormwater and wastewater infrastructure and contamination to groundwater and surface water.53 Warming is not limited to winters: our region has experienced eight days of heat over 100 degrees F since 1990, with projections of more days dangerously high temperatures in the next 50 years.54,55 Extreme heat is dangerous to people and natural systems and has economic ripple effects as it makes outdoor work unsafe and damages infrastructure over time.
Since 1895, average annual precipitation in the Twin Cities Region has increased by 4.7 inches.56 More recently, the region experienced the equivalent of seven years of rainfall between 2014 and 2019, a five-year period. Long-term observations have shown a dramatic increase in major rainstorms in Minnesota and are projected to keep increasing.57 Major rainstorms – including extreme flooding events – overflow surface waters (such as lakes and rivers), then oversaturate soil to the point it cannot absorb additional water and the region’s stormwater systems cannot keep up.58 Flooding poses a further threat to the region’s waters, as pollutants from the surface may either runoff into our waterways or concentrate and contaminate shallow drinking water supplies.
Human activities have accelerated the levels of greenhouse gases in the Earth’s atmosphere, which drives climate change. In 2021, with over half of the state’s population, the seven-county region was responsible for approximately 33% of the state of Minnesota’s total greenhouse gas emissions.
The region’s greenhouse gas emissions come from diverse sources, ranging from powering our workplaces, to heating our homes, to driving vehicles (Figure 2). Healthy natural systems can offset emissions through carbon sequestration and stocks.
Figure 1.2: Sources of region’s greenhouse gas emissions (in metric tons of CO2e) in 2021
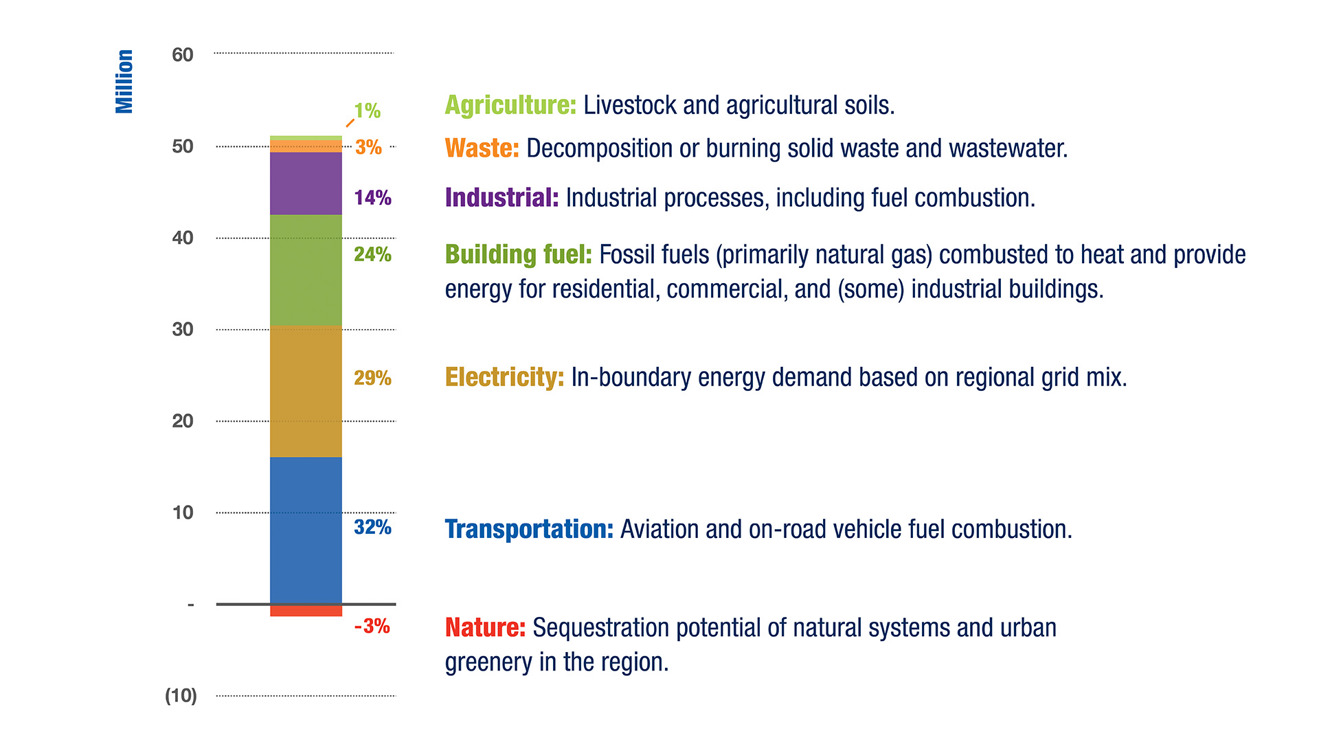
Source: Metropolitan Council analysis of state, federal, utility, and scientific sources of sector data.
The impacts of climate change will not equally affect the people of our region, our built and natural systems, or areas of our economy. The regional goals and policy areas of Imagine 2050 describe this in more detail.
The people of our region
Indigenous people are the first people of this land. The land we all occupy in the seven-county Twin Cities region is historic Dakota land. More than 10,000 years before European and British North, the Dakota had developed an extensive communal society and held deep connections to the land and waters, which remain sacred sites and areas of significance today.59 The Dakota – and Ojibwe, who later migrated to the region and built alliances with the Dakota before external pressures created conflict – faced violent removal and genocide at the hands of early European settlers in the 1800s.60 The federal government continued the physical displacement of American Indians and advanced their cultural erosion through broken treaties and policies of assimilation through the end of the 20th century. Despite these gross injustices, 72,000 American Indians live the Twin Cities region today.61
Immigrants drove region’s early population growth—and will again
The same policies that forcibly removed American Indian populations created pathways for white immigrants to claim their lands.62 First British, then Swedish, Norwegian, and German immigrants arrived followed by Jewish, Italian, and Irish people. By the 1890s, nearly half (40%) of the state’s population were (predominately white) foreign-born immigrants, a much higher share than the U.S. overall at that point in history.63
The 20th and 21st centuries brought more racially diverse immigrants to the state and region. Chinese Americans and immigrants began moving to Minnesota as an alternative to growing hostilities on the West Coast. Fifty years later, 350 Japanese Americans, who had been forced into concentration camps established by the U.S. government at the start of World War II, were resettled in Saint Paul.64 Southeast Asian refugees, including Hmong, Laotian, and Vietnamese people, began arriving in the mid-1970s, fleeing increasing political instability and war.65 During this period, Mexican immigrants came to the Saint Paul’s East Side and West Side neighborhoods seeking economic opportunities created by labor force shortages; when these jobs dried up, some were targeted for deportation. In the 1990s, Somali refugees and immigrants established a large community in the Cedar-Riverside neighborhood of Minneapolis.66 Every immigrant group has contributed to the vibrant cultural fabric of our region.
Immigration will continue to play an important role in future population and economic growth. Today over 377,000 immigrants live in the Twin Cities region, which is about one in every eight residents (Figure 3). The pace of immigration slowed down in the 2000s, and again in the 2010s, though immigration growth rates still outpaced overall population growth in those periods. In the 2020s, the region’s immigration and population growth rates are equal so far at 2%. The city of Saint Paul has the highest share of immigrants relative to their population, closely followed by Minneapolis, and suburban Hennepin and Ramsey counties.
Figure 1.3: Recent immigration trends in the Twin Cities region
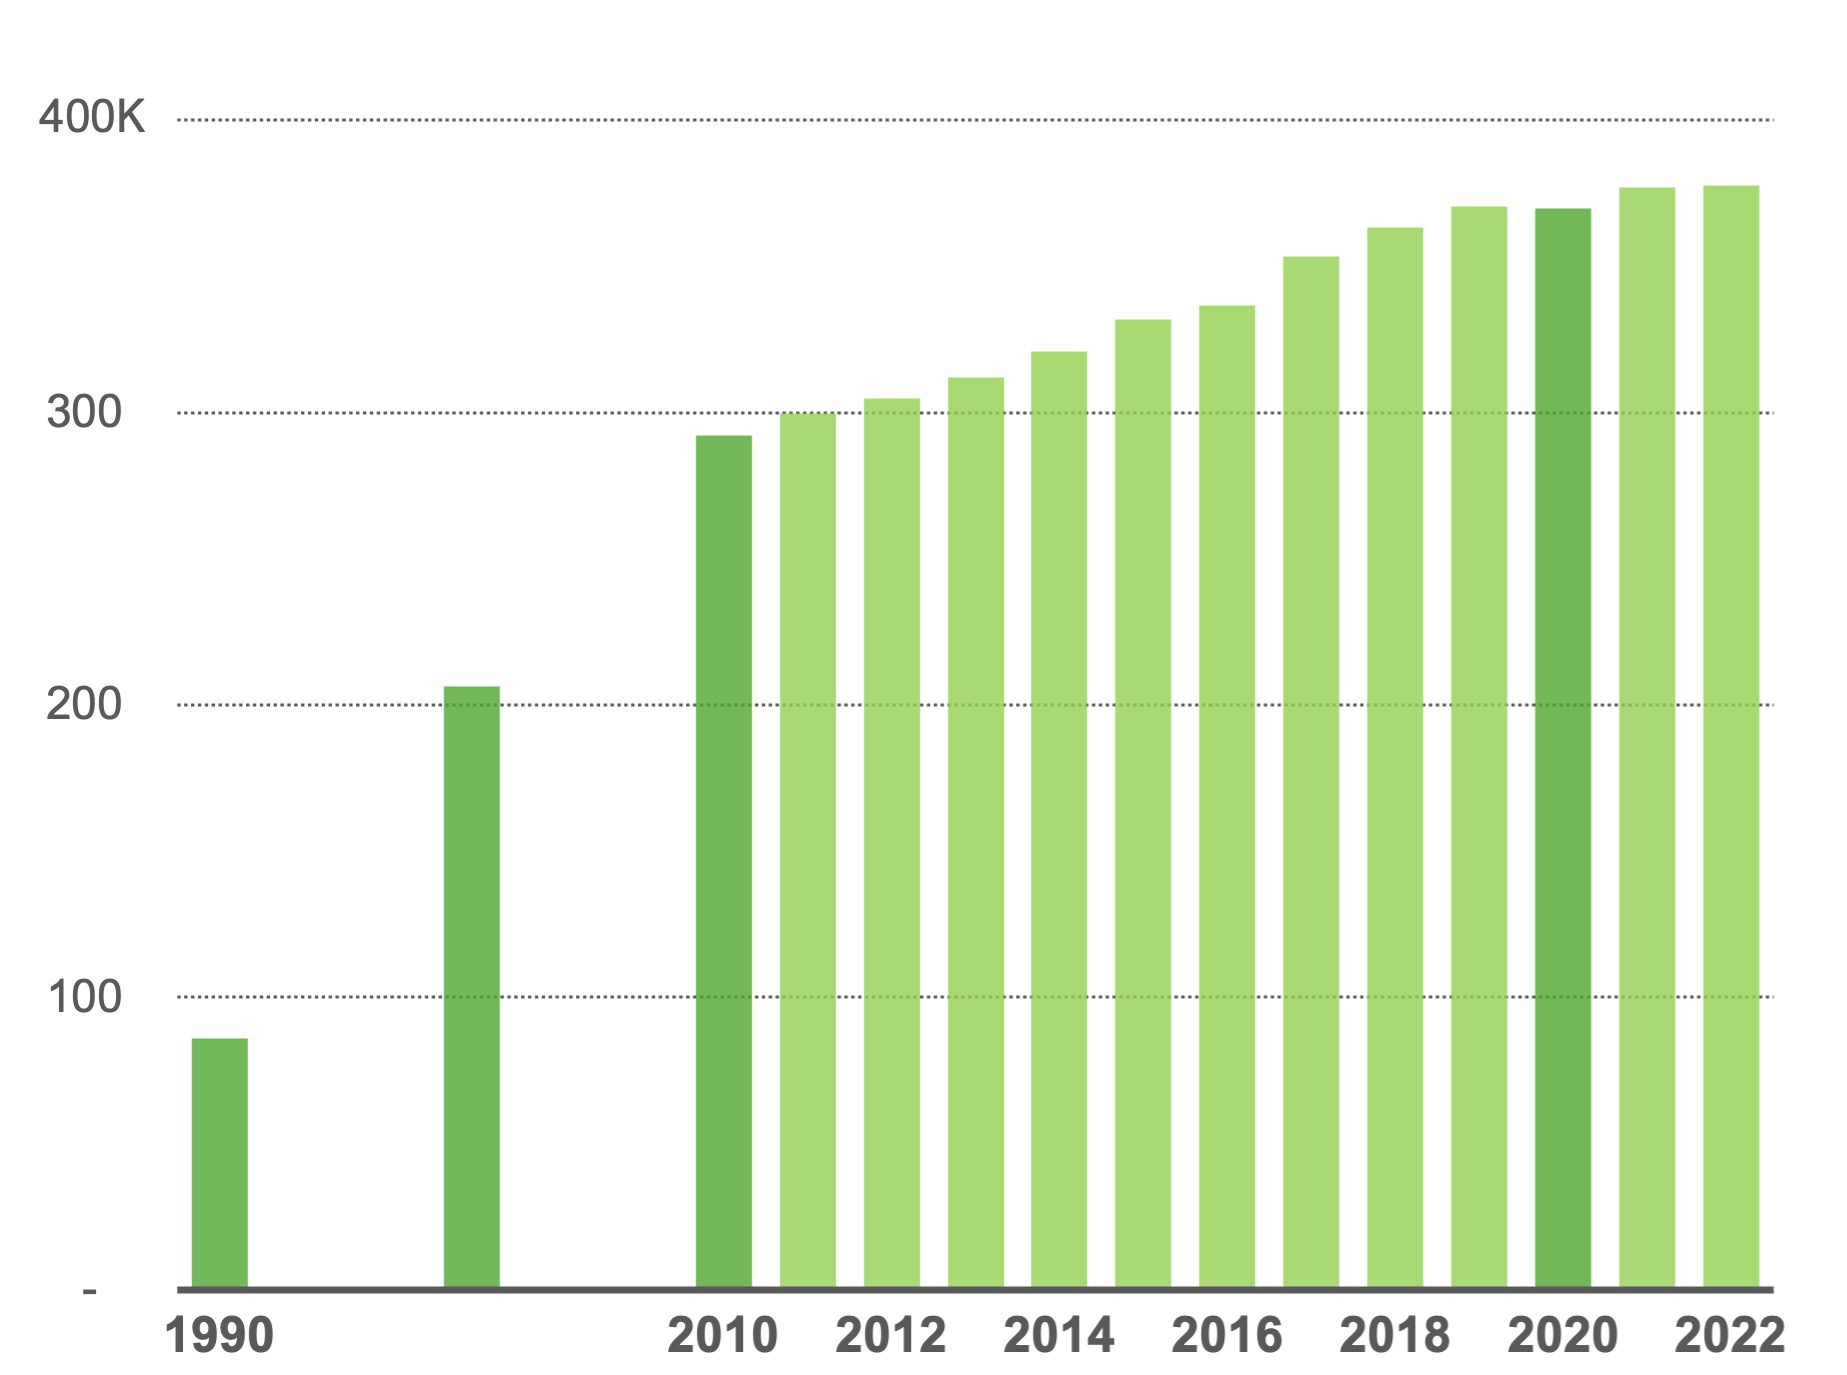
Source: U.S. Census Bureau, American Community Survey, five-year estimates (2011-2022).
Immigration will continue to play an important role in future population and economic growth. The region is expected to add approximately 311,000 immigrants between 2020 and 2050.67 In fact, immigration alone will account for nearly half (47%) of the region’s forecasted population growth to 2050.
Our population will grow and demographically transform by 2050
Today, the seven-county Twin Cities region is home to 3.2 million residents.68 The region’s population growth since 1990 was robust at 38%, outpacing the state of Minnesota (30%) and the U.S. (33%) over the same period (Figure 4). There is more population growth to come over the next 30 years: Met Council’s regional forecast shows a gain of 657,000 residents by 2050, an increase of 21%.
Regional population growth is the result of natural growth (that is, more births than deaths) and net migration (more people move to the region than leave). Natural growth will account for just over half (52%) of the region’s forecasted population to 2050.69 However, more people will leave the region than arrive from other parts in the state or U.S. in the 2020s and 2030s. This trend will reverse in the 2040s but not enough to overcome the earlier losses.70 Without immigration levels like the 1990s and 2000s, growth will stagnate.
Figure 1.4: Population in the Twin Cities region forecasted to 2050
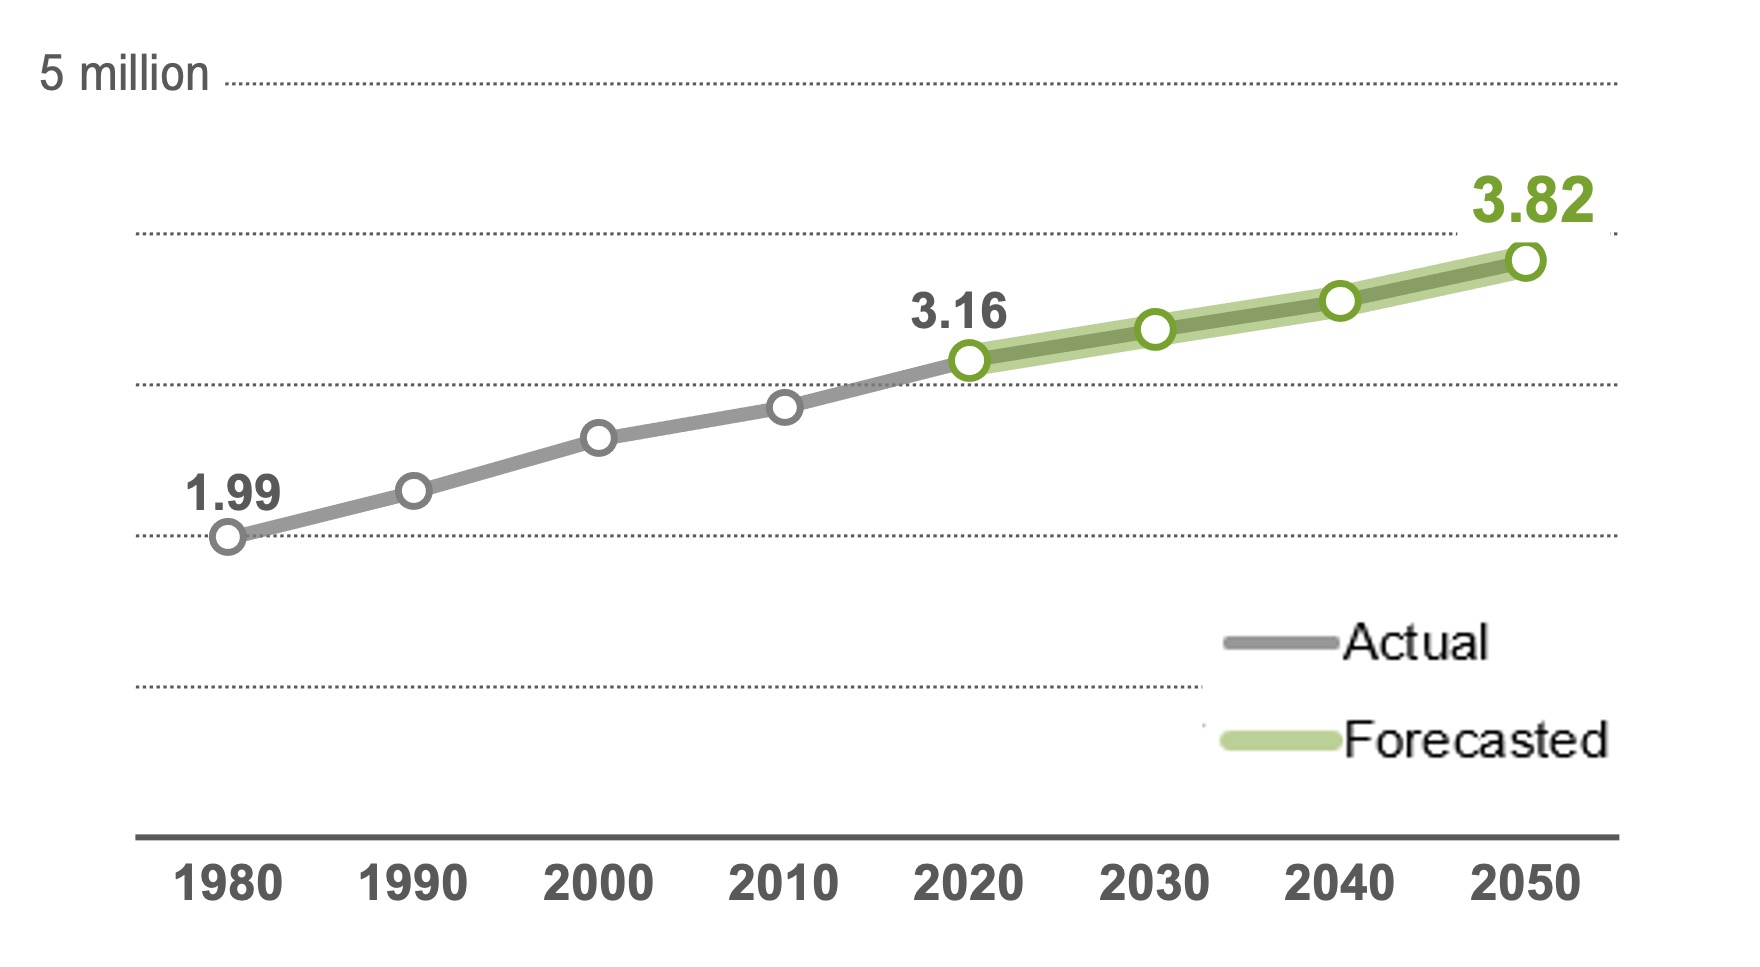
Source: Metropolitan Council regional forecast (April 2023).
Future population growth will take place across the region. Met Council uses a real estate market and travel-demand model to forecast where this growth occurs at the local level.71 Mainly, forecasts consider location characteristics and amenities, economic growth, travel patterns, and access to destinations. Local forecasts were prepared in 2024 and reviewed by local governments; final local forecasts are adopted with Imagine 2050.
Growth will occur in all areas of the region (Figure 5). The region’s Suburban Edge communities will add the largest numbers of residents between 2020 and 2050 (273,000) and will experience the fastest rate of growth (35%). Suburban designated communities will add 138,000 residents (16% growth). Urban communities will grow mainly through redevelopment and infill and will add 139,000 residents (15% growth). Urban Edge communities will add 58,000 residents (13% growth). Rural communities (which includes Rural Centers) will add 42,000 residents (25% growth).
We can also think about the additional 657,000 residents the region will gain between 2020 and 2050 and how they will be distributed across the region. Suburban Edge and Suburban communities will account for most of the region's population growth: 42% and 21%, respectively. Urban and Urban Edge communities will account for 21% and 9% of population growth. The remainder of the region's growth, over 6%, will be in Rural communities.
The local forecasts show Minneapolis, Saint Paul, Eden Prairie, Lakeville, Blaine, and Maple Grove as the six cities gaining at least 20,000 residents between 2020 and 2050.72 For the most part, the region’s top 10 largest cities in 2020 remain so in 2050, with minor shuffling.
Figure 1.5: Forecasted population growth by Imagine 2050 Community Designations
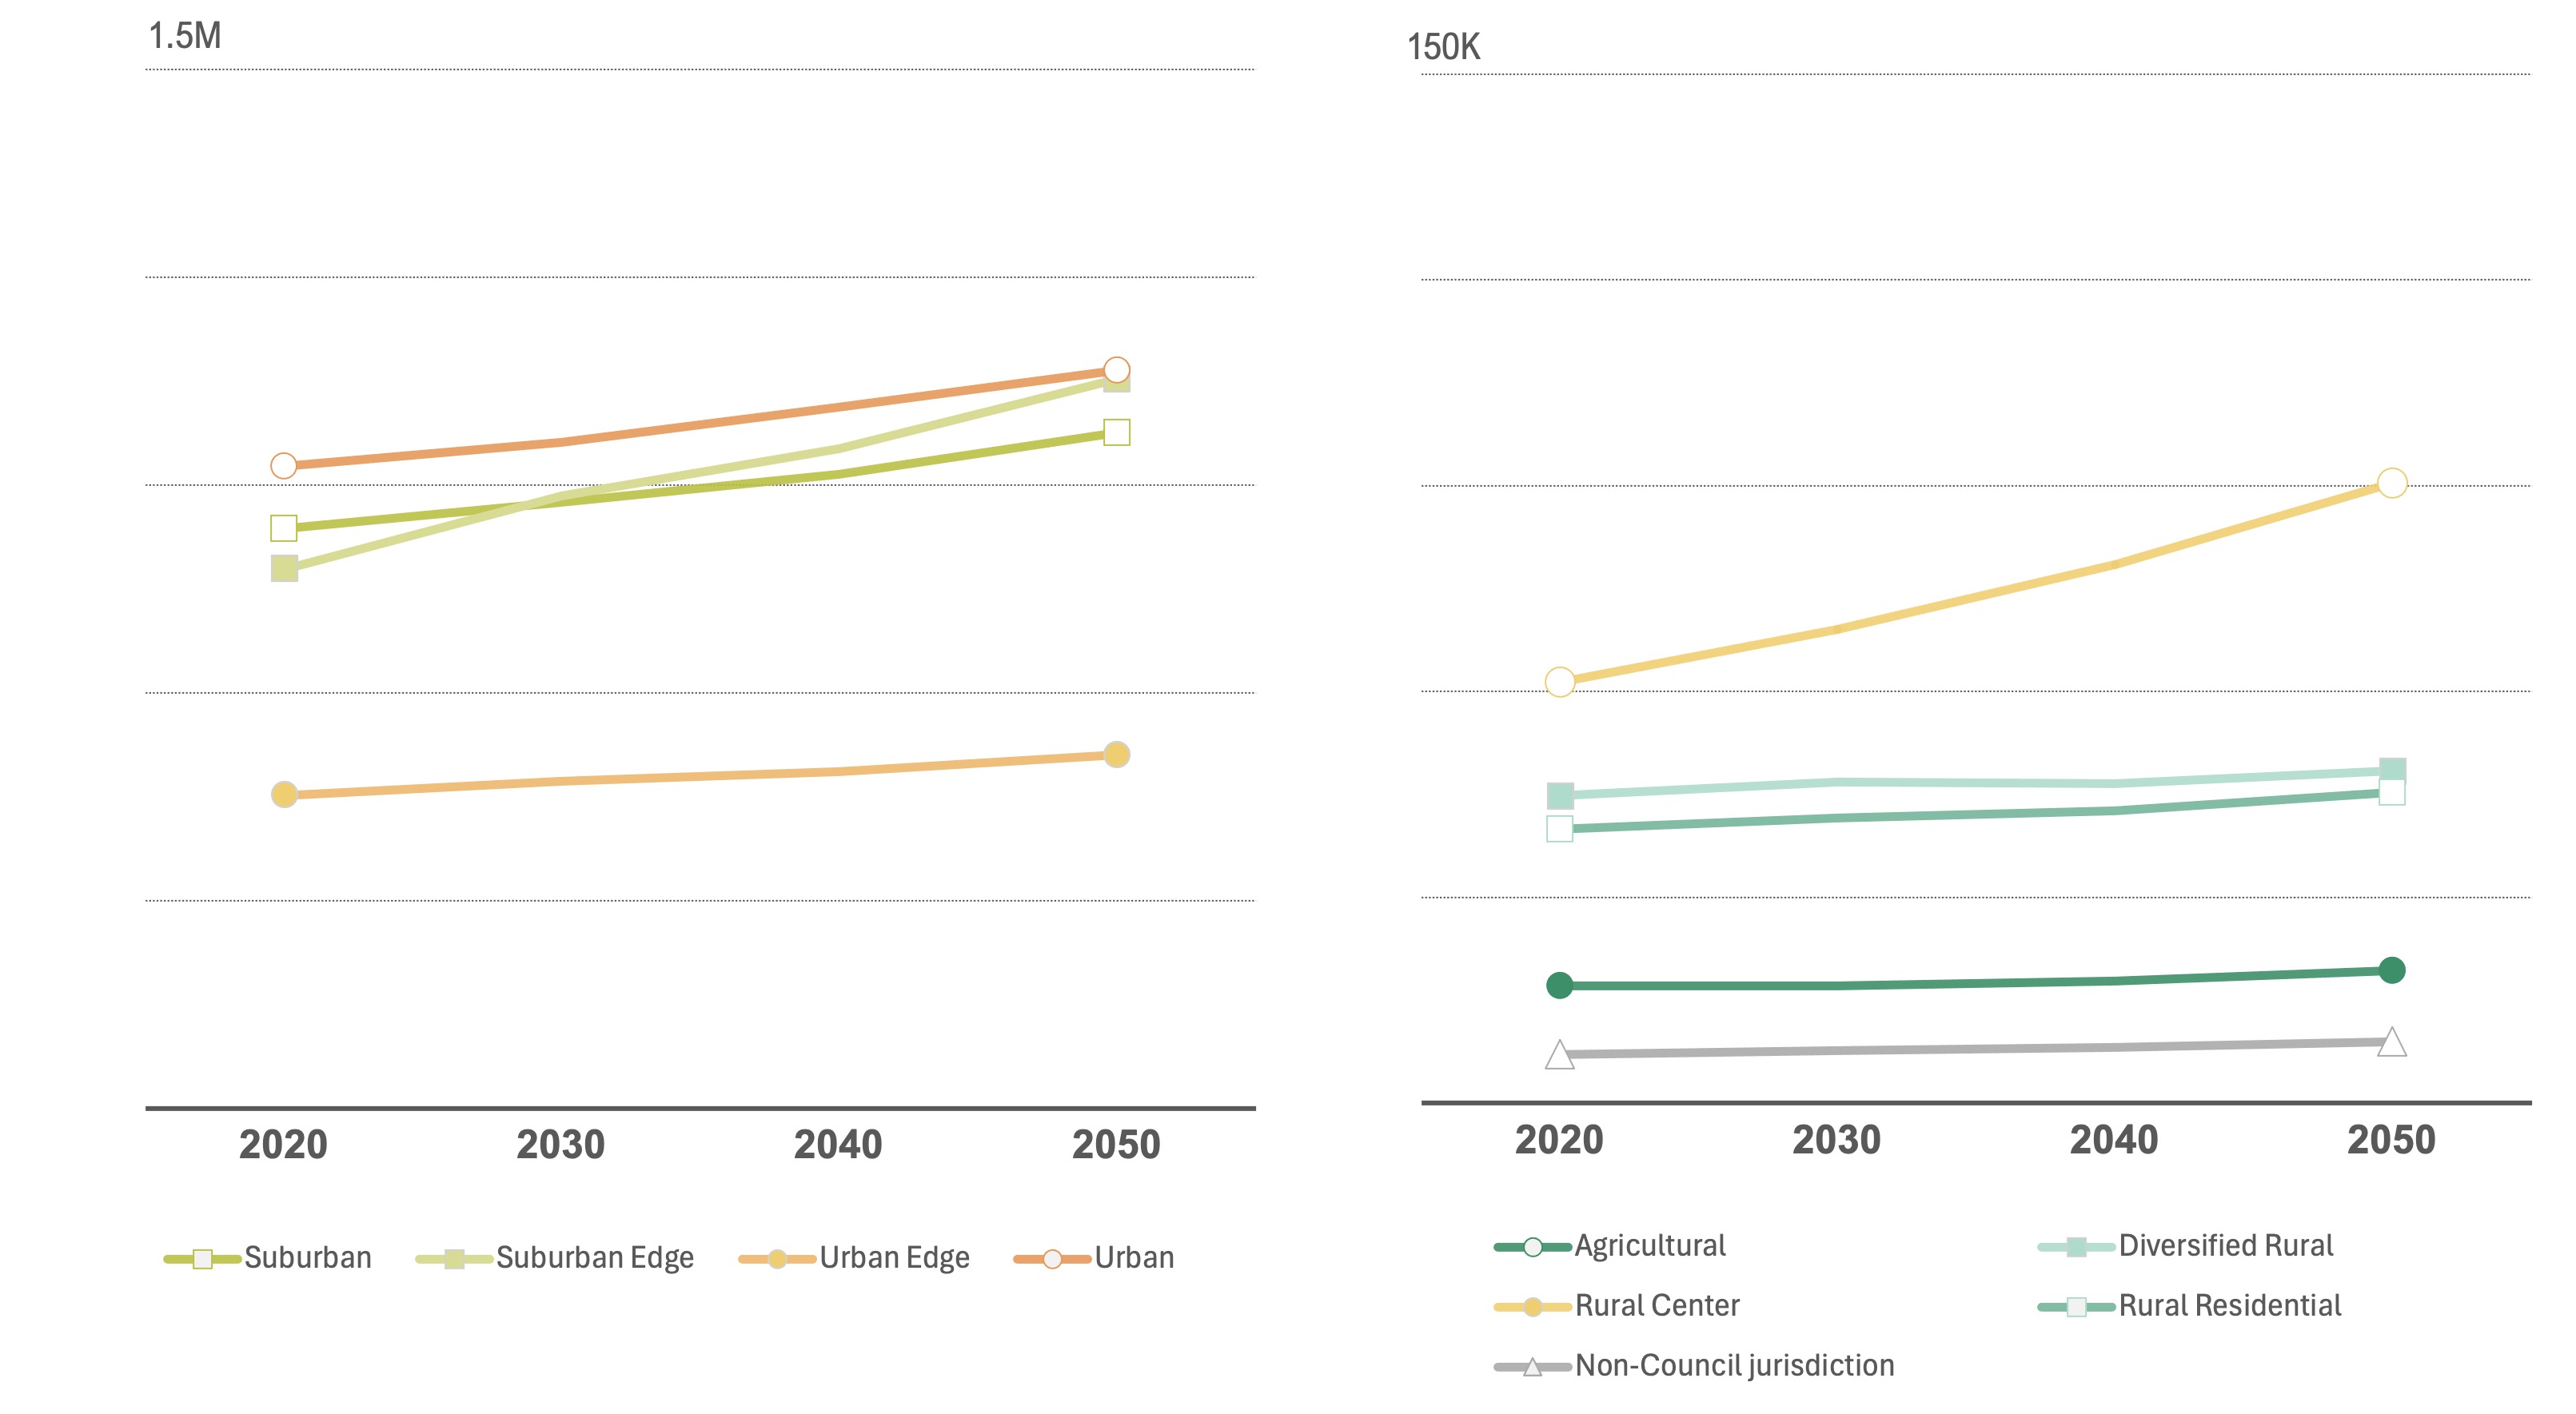
Source: Metropolitan Council local forecasts (January 2025). See Community Designations in Land Use Policy chapter for more description on what those designations are and the places they describe.
Our region is the most racially diverse we’ve ever been, and the trend will continue
As of 2020, 31% of the region’s population is Black, American Indian, and people of color – up nearly four times their share in 1990 (8.4%).73 People who identify as multiracial had the highest relative growth between 1990 and 2020, followed by Latine people (+517%), Asian people (+304%) and Black people (+268%).74 The region’s white population increased 3.8% over this period, trailing American Indians at 5.3%. White residents remained the largest overall share of the population at 68.8% in 2020. Worth noting is that increasing racial diversity is happening everywhere in our region.
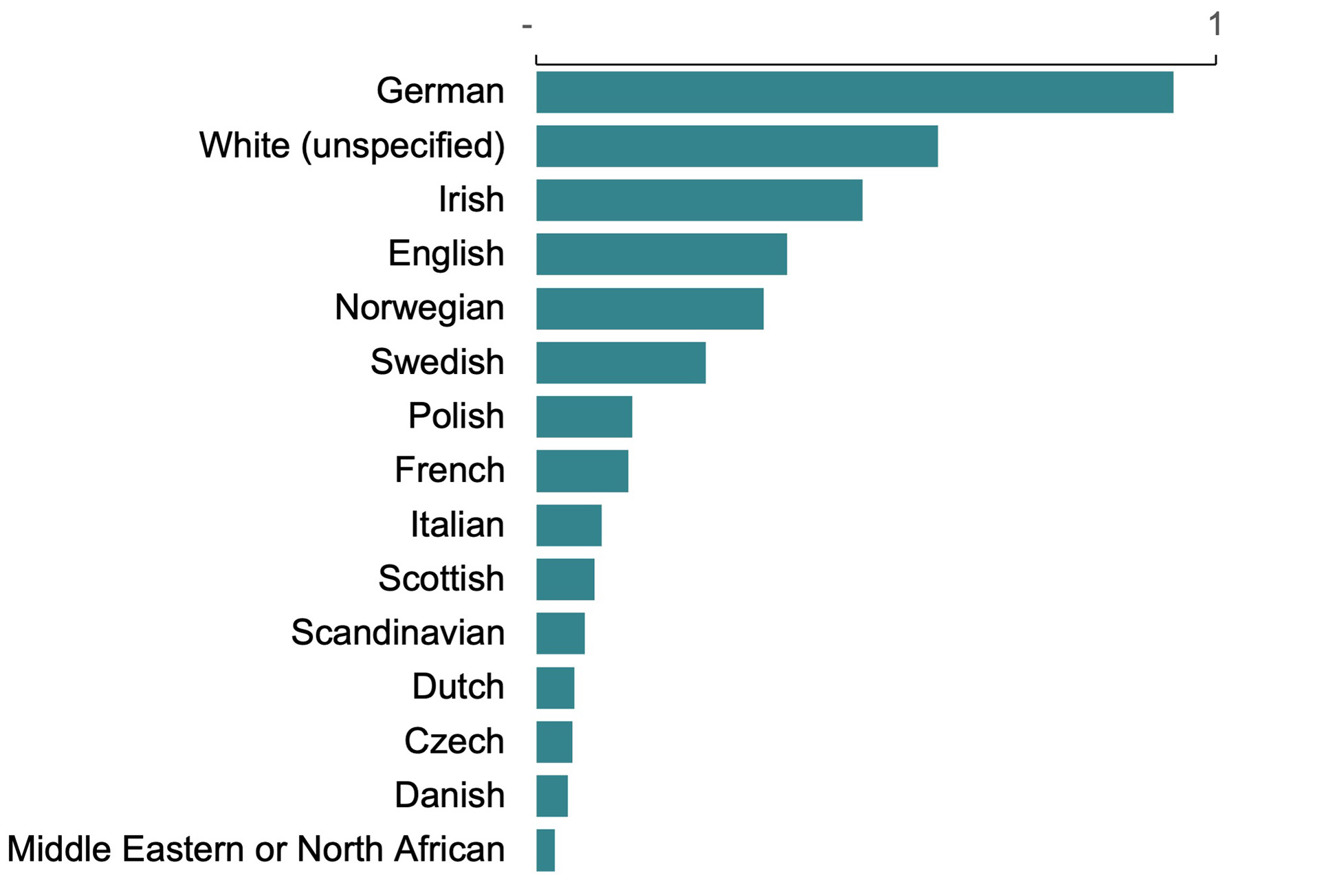
Though federally defined race and ethnic groups can be useful for tracking trends, they neither reflect the full diversity, lived experiences, or preferred identification of the people they are meant to describe. More detailed data released with the 2020 decennial census provides a more complete picture of cultural groups in the region. As Figure 6 shows, many of the immigrant groups described earlier remain well-represented in today’s population.
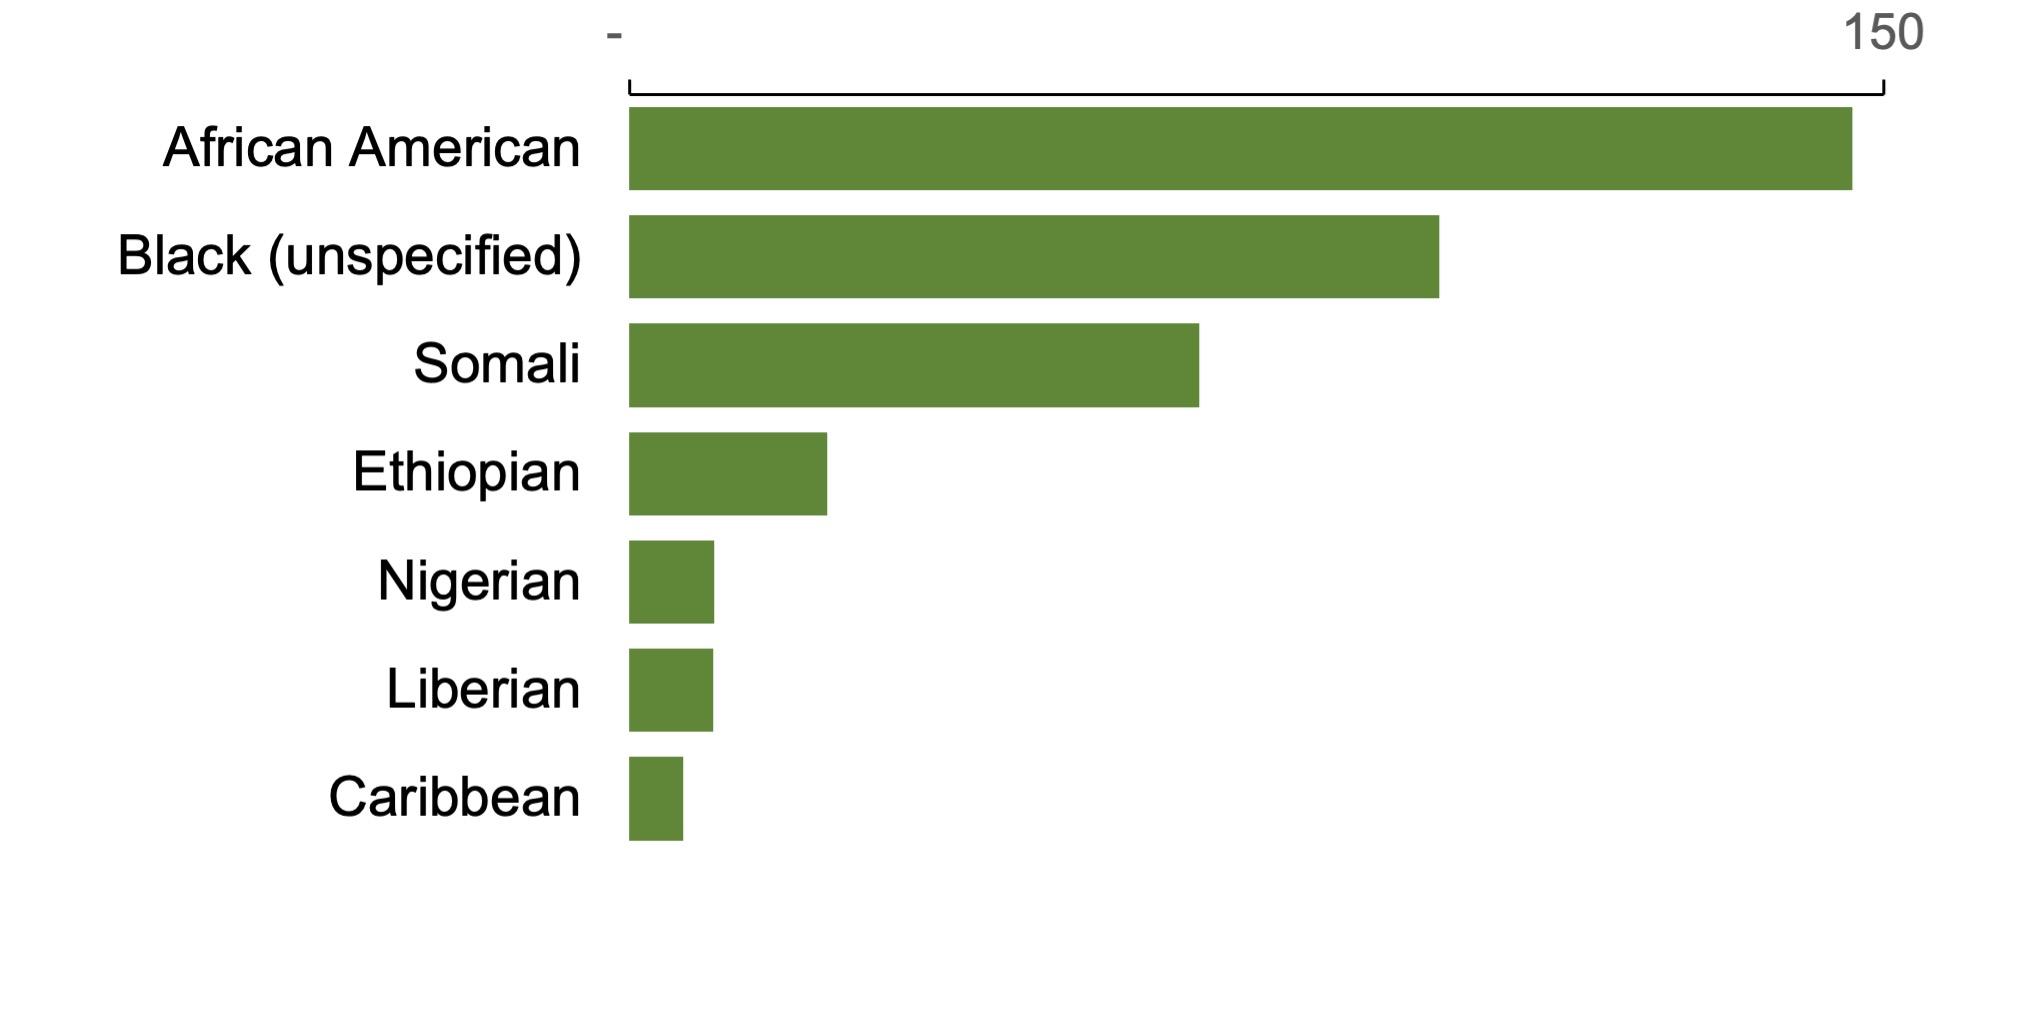
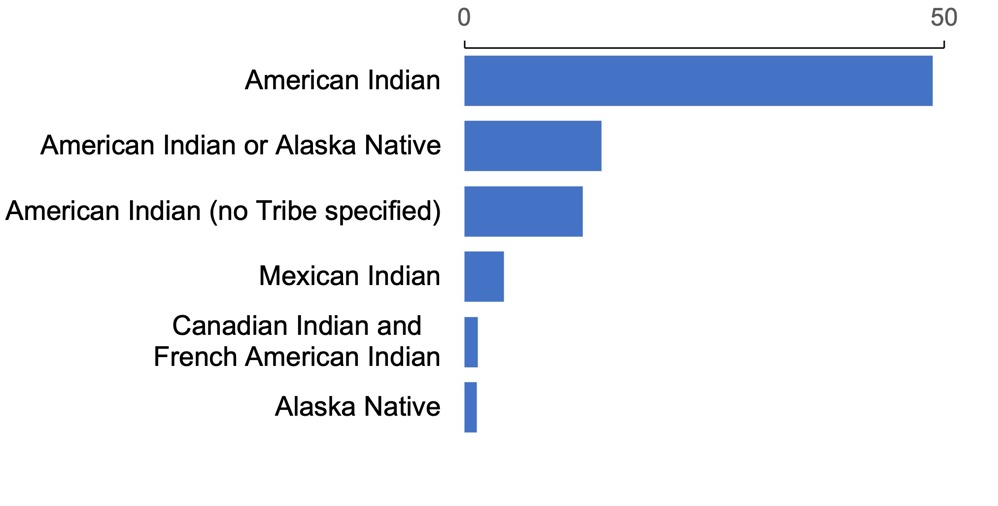
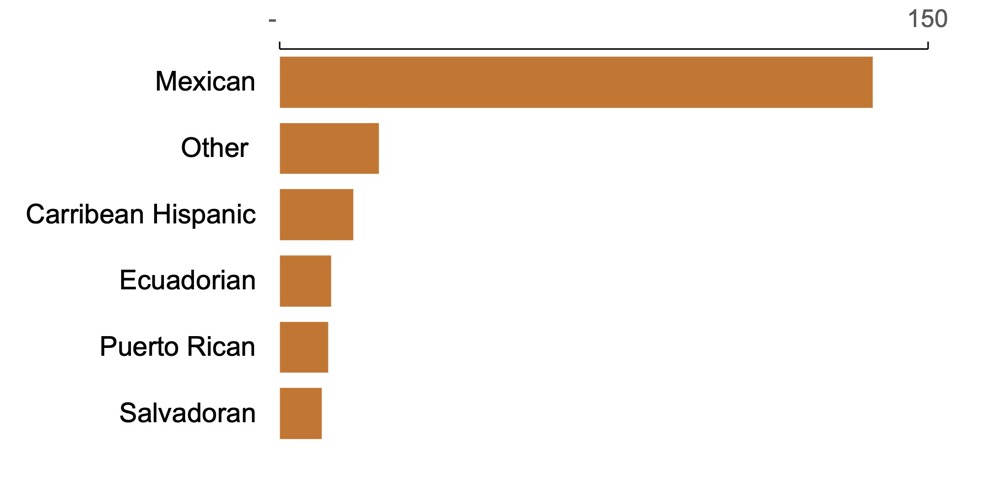
Figure 1.6: Snapshot of the region’s population in 2020 by detailed race and ethnicity groups
White groups
Black groups
American Indian groups
Hispanic/Latine groups
Asian groups
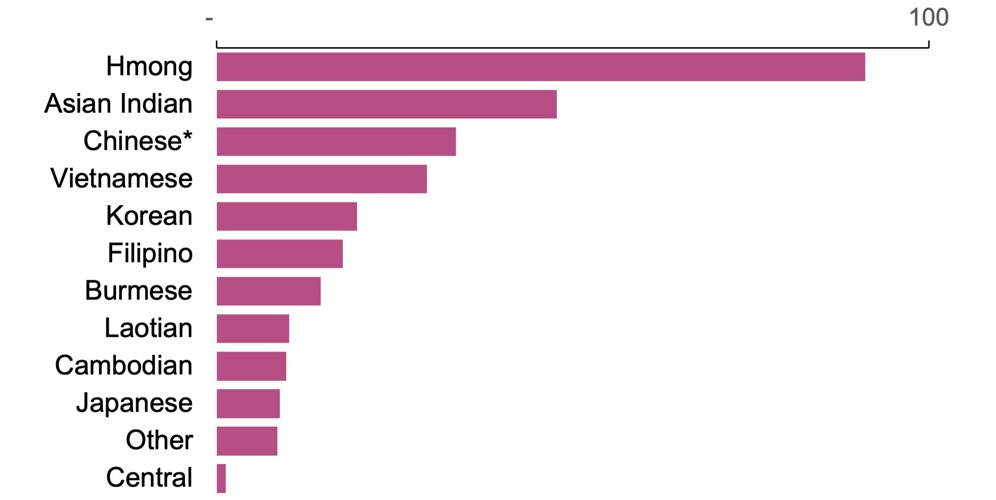
Source: U.S. Census Bureau, 2020 Census (Detailed Demographic & Housing Characteristics File A). Note: Numbers reflect all people who identified with this group, regardless of whether they also identified with other groups. Only groups with 1,000 or more people are included.
By 2050, nearly half (45%) of our region’s population will be Black, American Indian, and people of color, up from 29% in 2020 (Figure 7). Black and Asian communities will gain the most residents by 2050, followed by Latine and multiracial communities. The American Indian community is forecasted as stable to 2050, without growth, and the white population will level off and decline.
Figure 1.7: Forecasted population growth by race and ethnicity
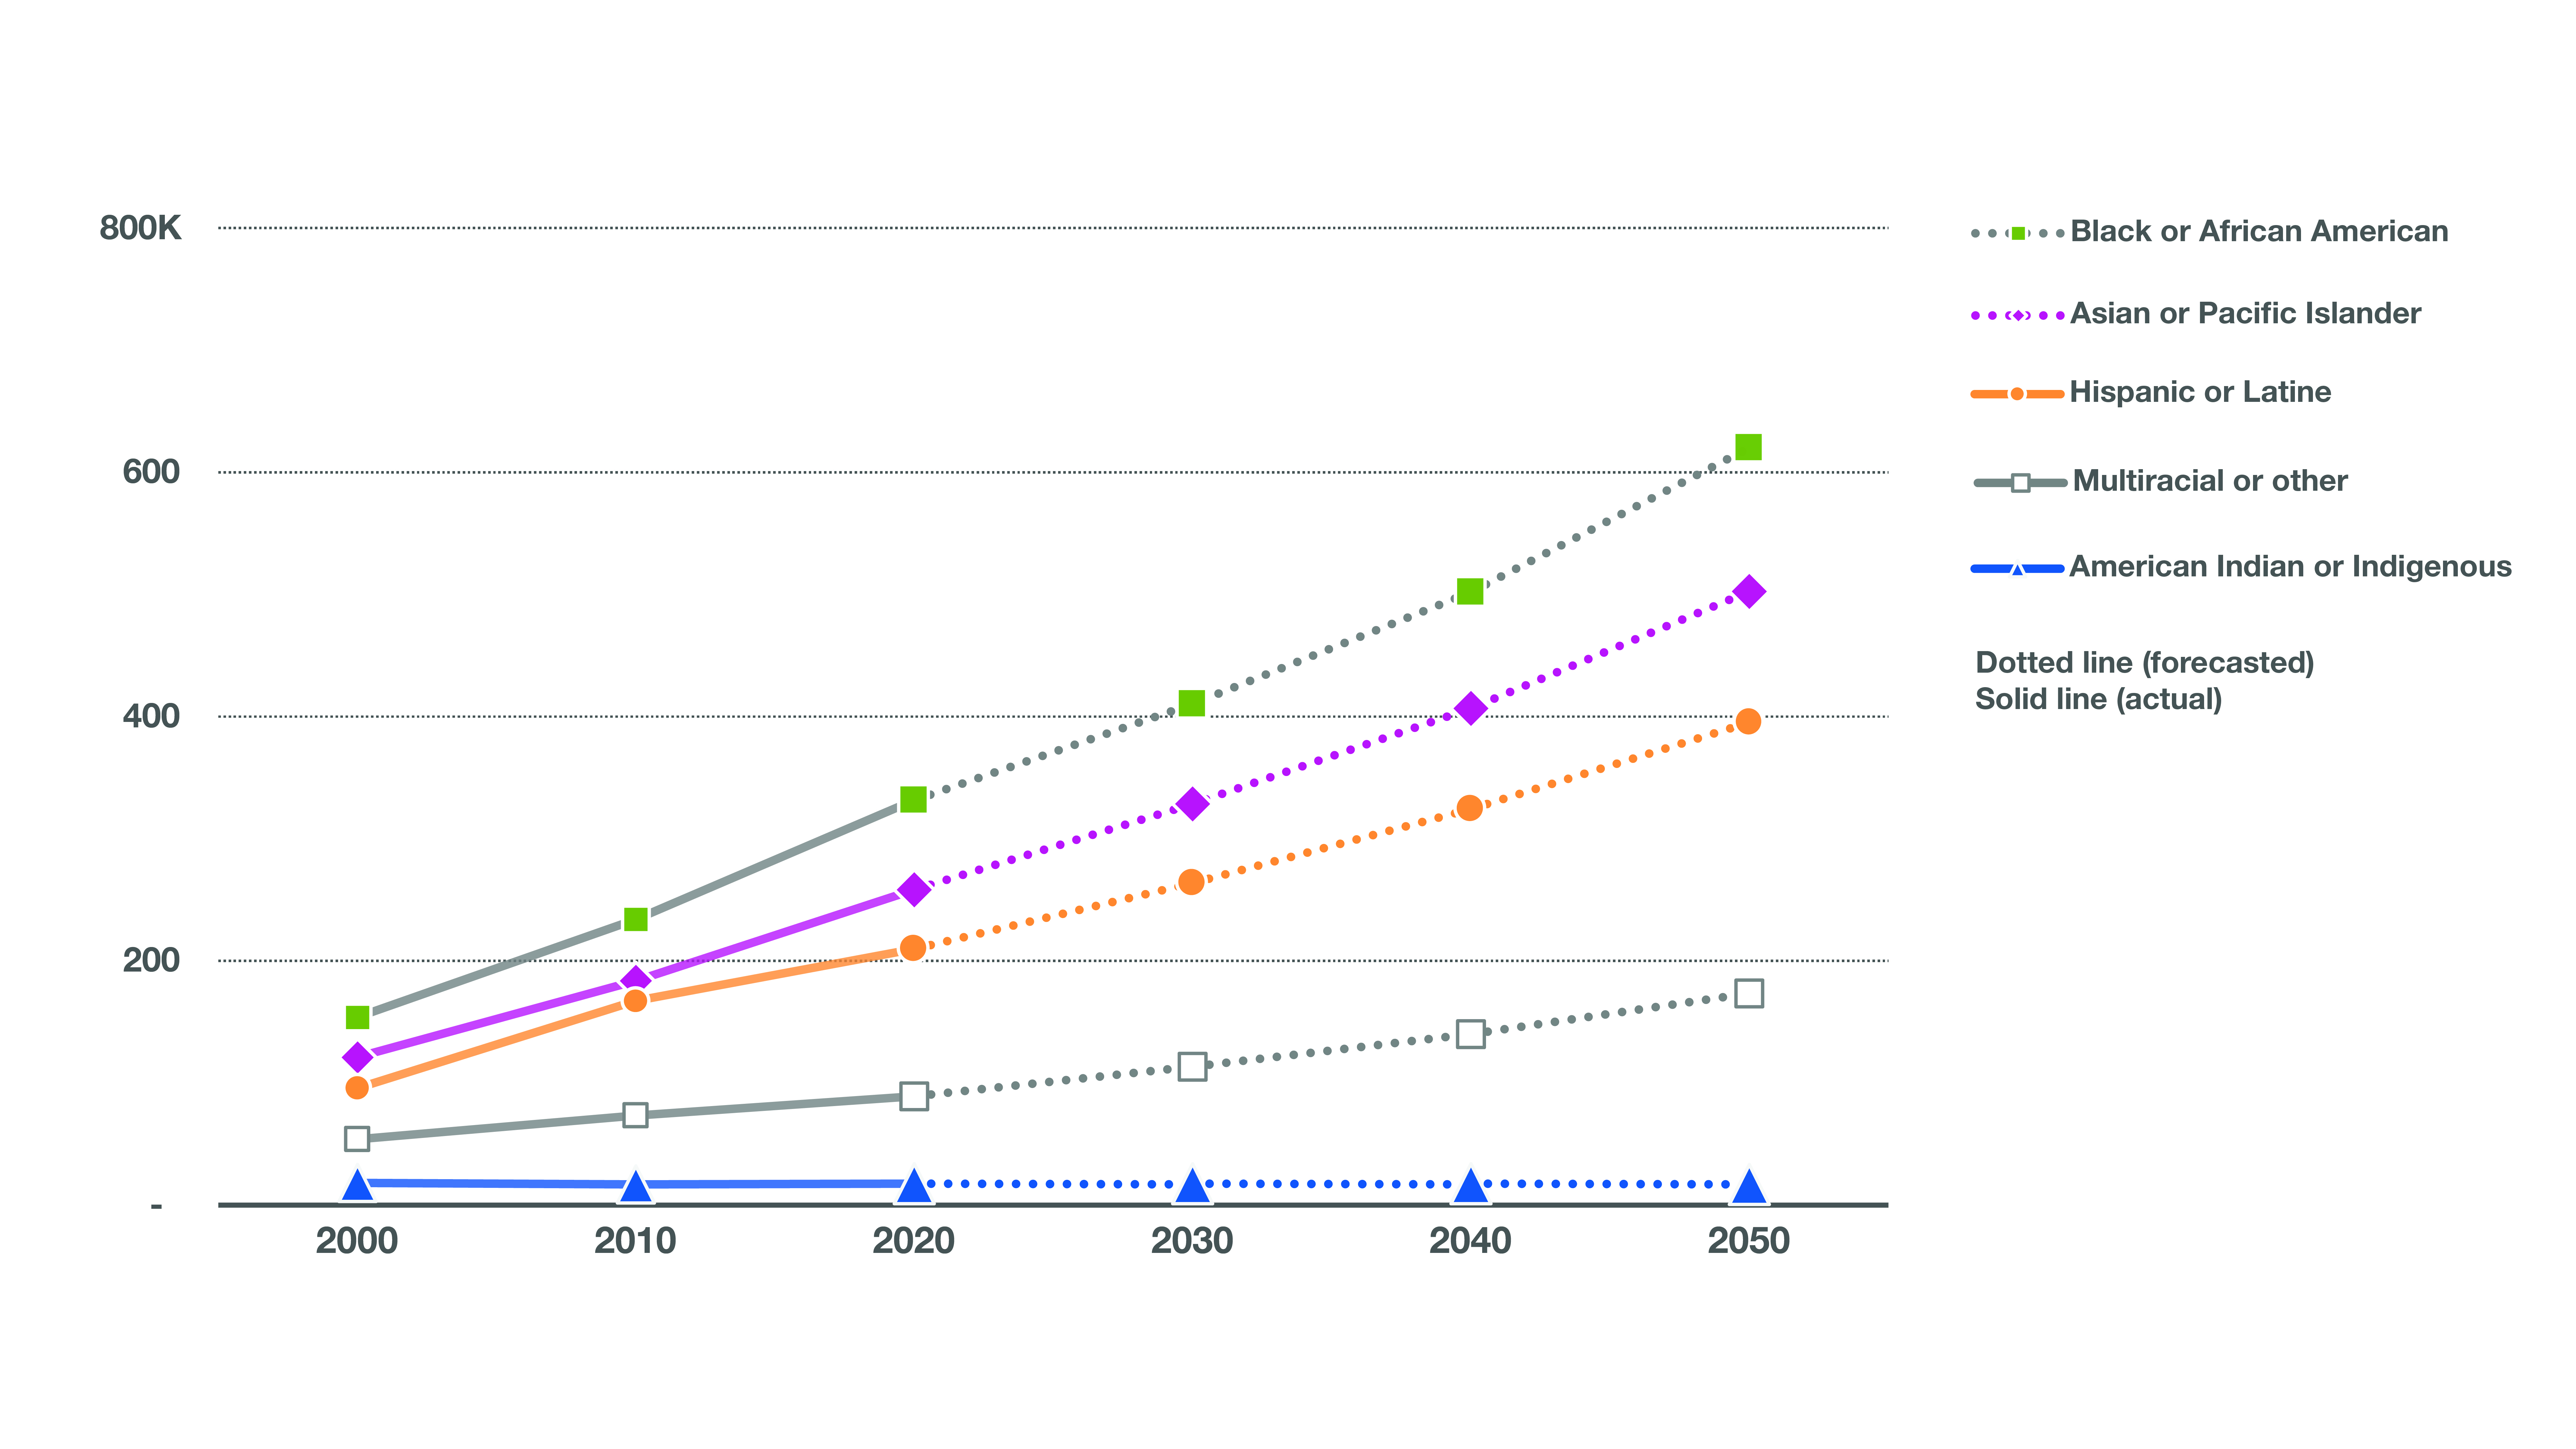
Source: Metropolitan Council regional forecast (April 2023).
Simultaneously, our region – like the U.S. overall – is aging. The median age across the region’s population in 1990 was 31.7 years old; by 2020 it was 37.3. By 2050, the share of the region’s population over age 65 will nearly double, going from 14% in 2020 to 22% by 2050.75
More specifically, the white population composition is aging faster than other racial and ethnic groups (Figure 8). The share of youth and young adults that are Black, American Indian, and people of color will exceed the proportion of white youth and young adults by 2040. The prime workforce ages of 25 to 64 will be an almost equal share, while older adults are, and will continue to be, predominantly white.
Figure 1.8: Forecasted population growth by race, ethnicity, and age group
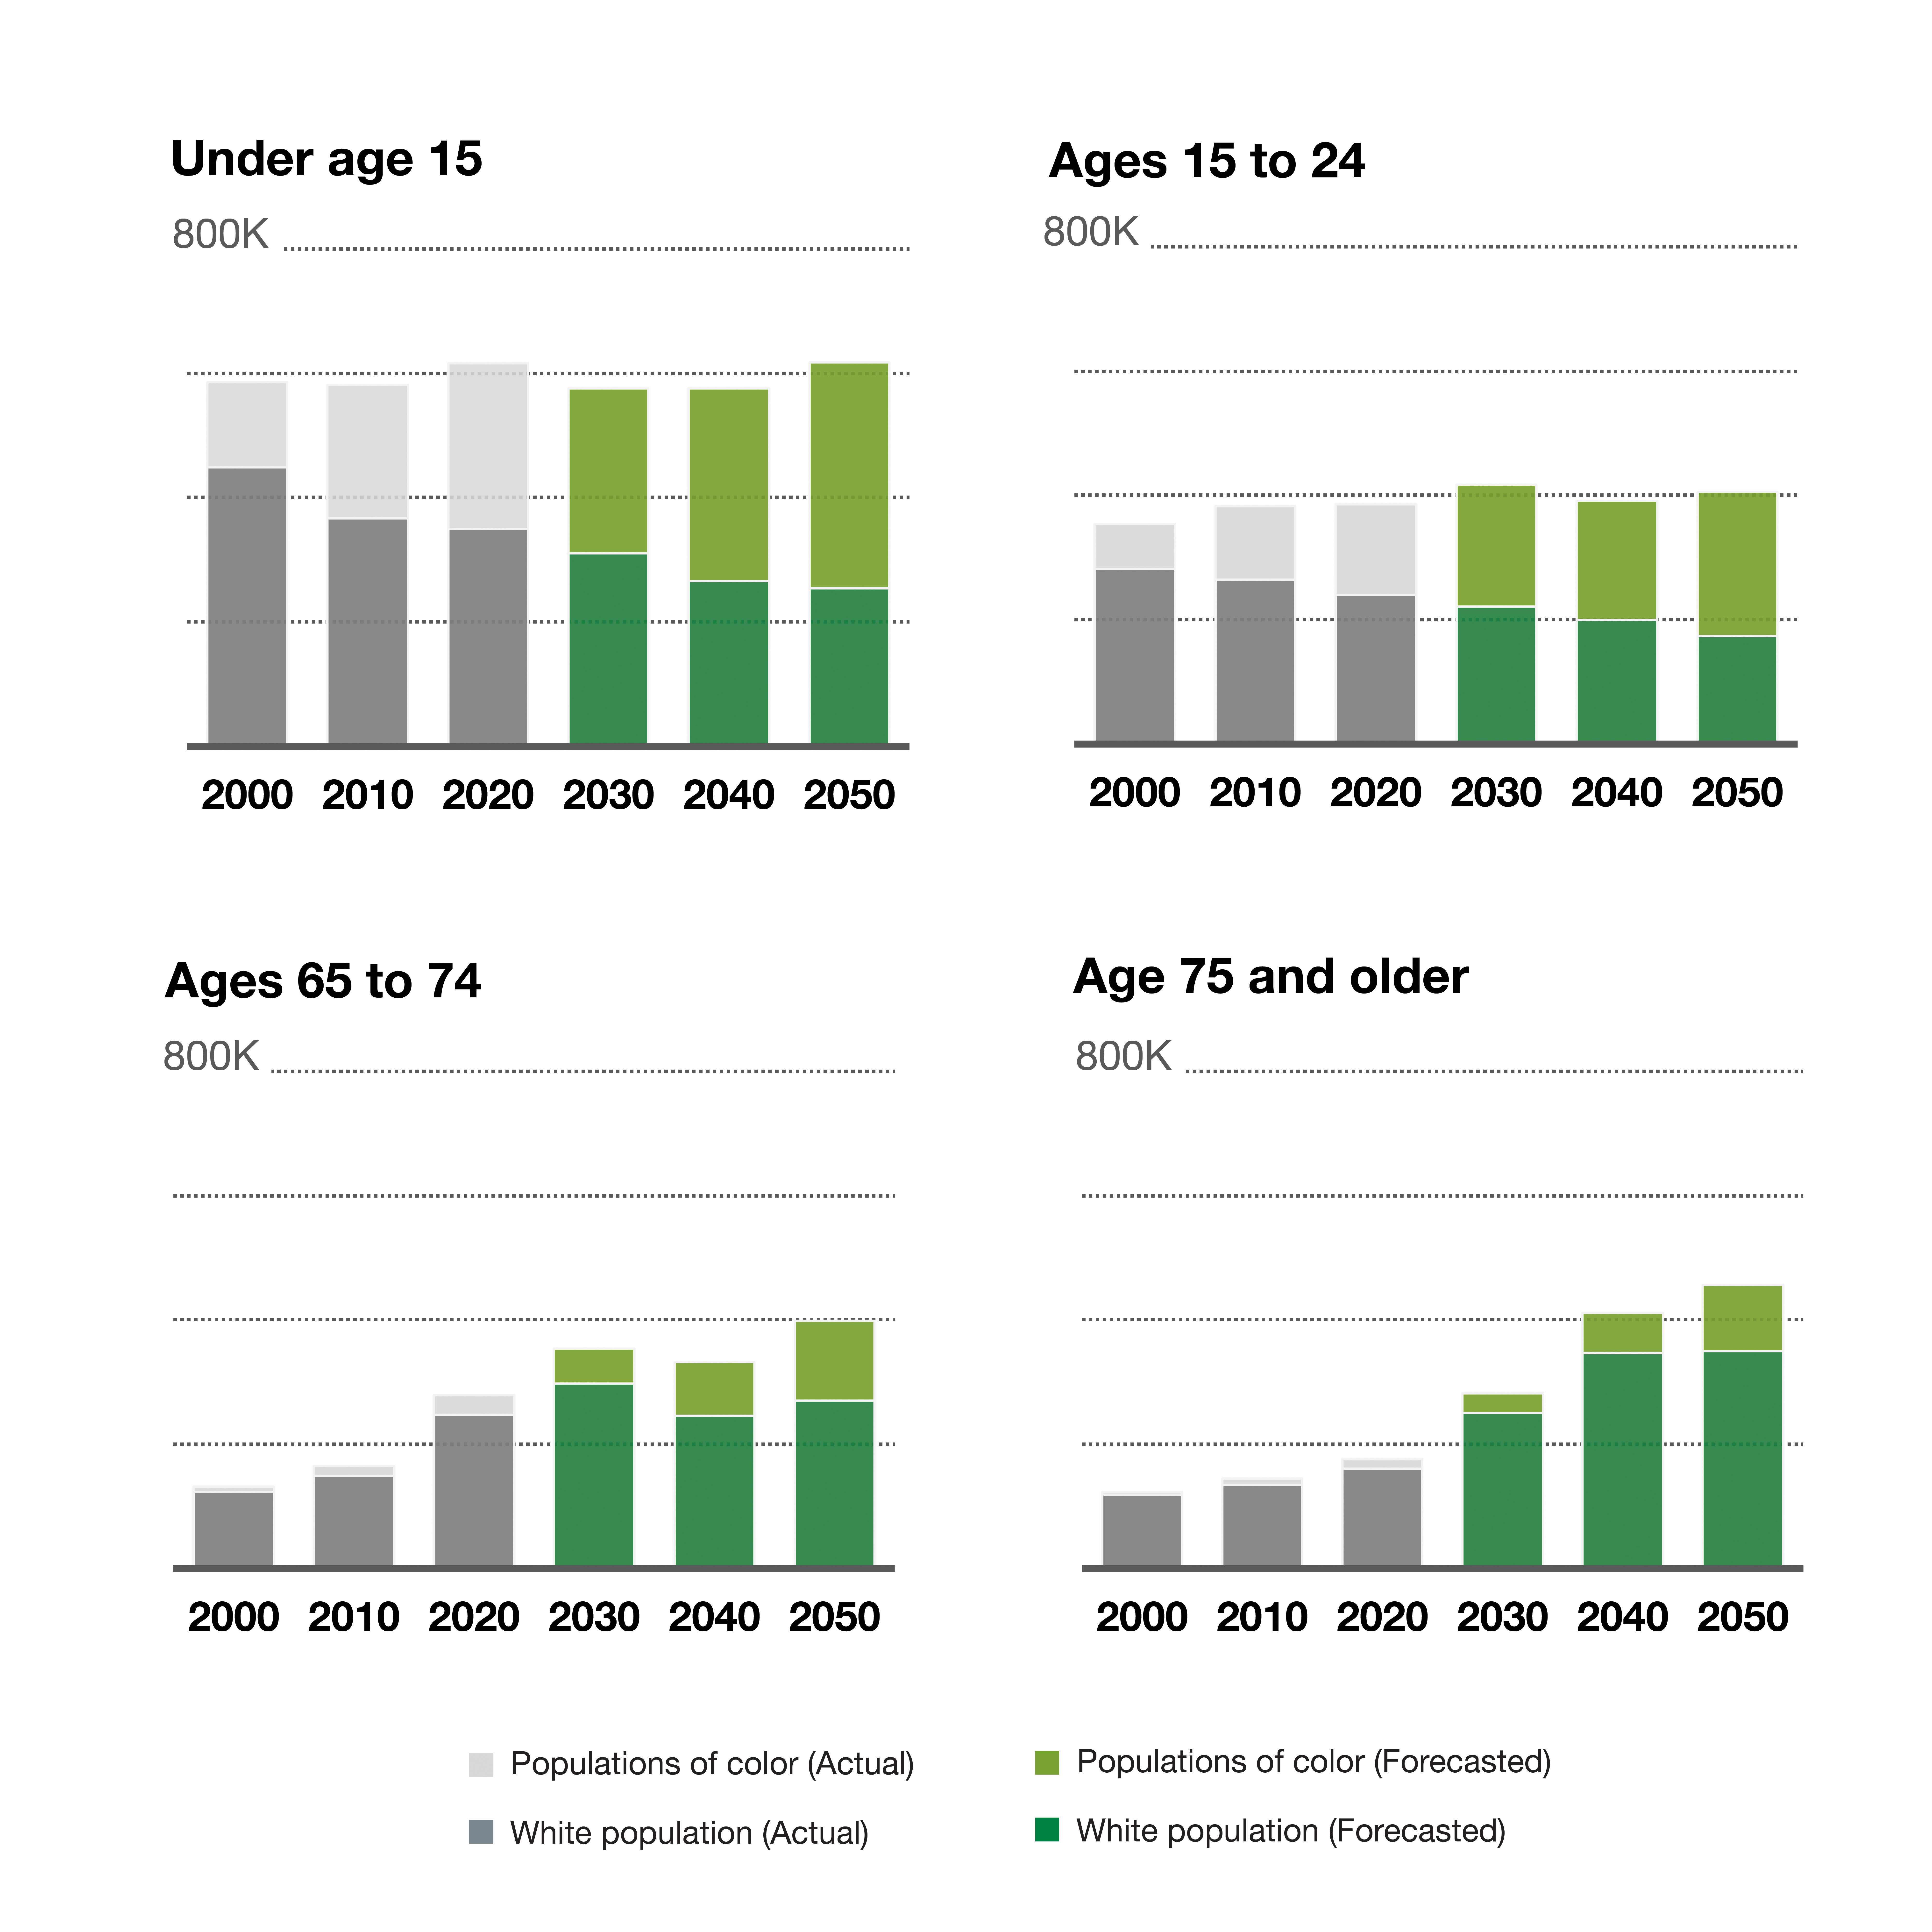
Source: Metropolitan Council regional forecast (April 2023).
These demographic changes also affect household formation and the number of people living in each household. The region is forecasted to add an additional 324,000 households by 2050, an increase of 26% from 2020. As shown in Figure 9, the number of households categorized as “living alone” will grow significantly over the next 30 years and is almost half (48%) of all new households over the forecast period. Larger household sizes (of four persons or more) will remain a consistent share of the region’s households at about 21%. These changes in household size require us to consider the variety of housing choices the region plans for (See the Housing Policy Plan chapter for further details on planning for housing needs).
Figure 1.9: Forecasted household growth to 2050 by size
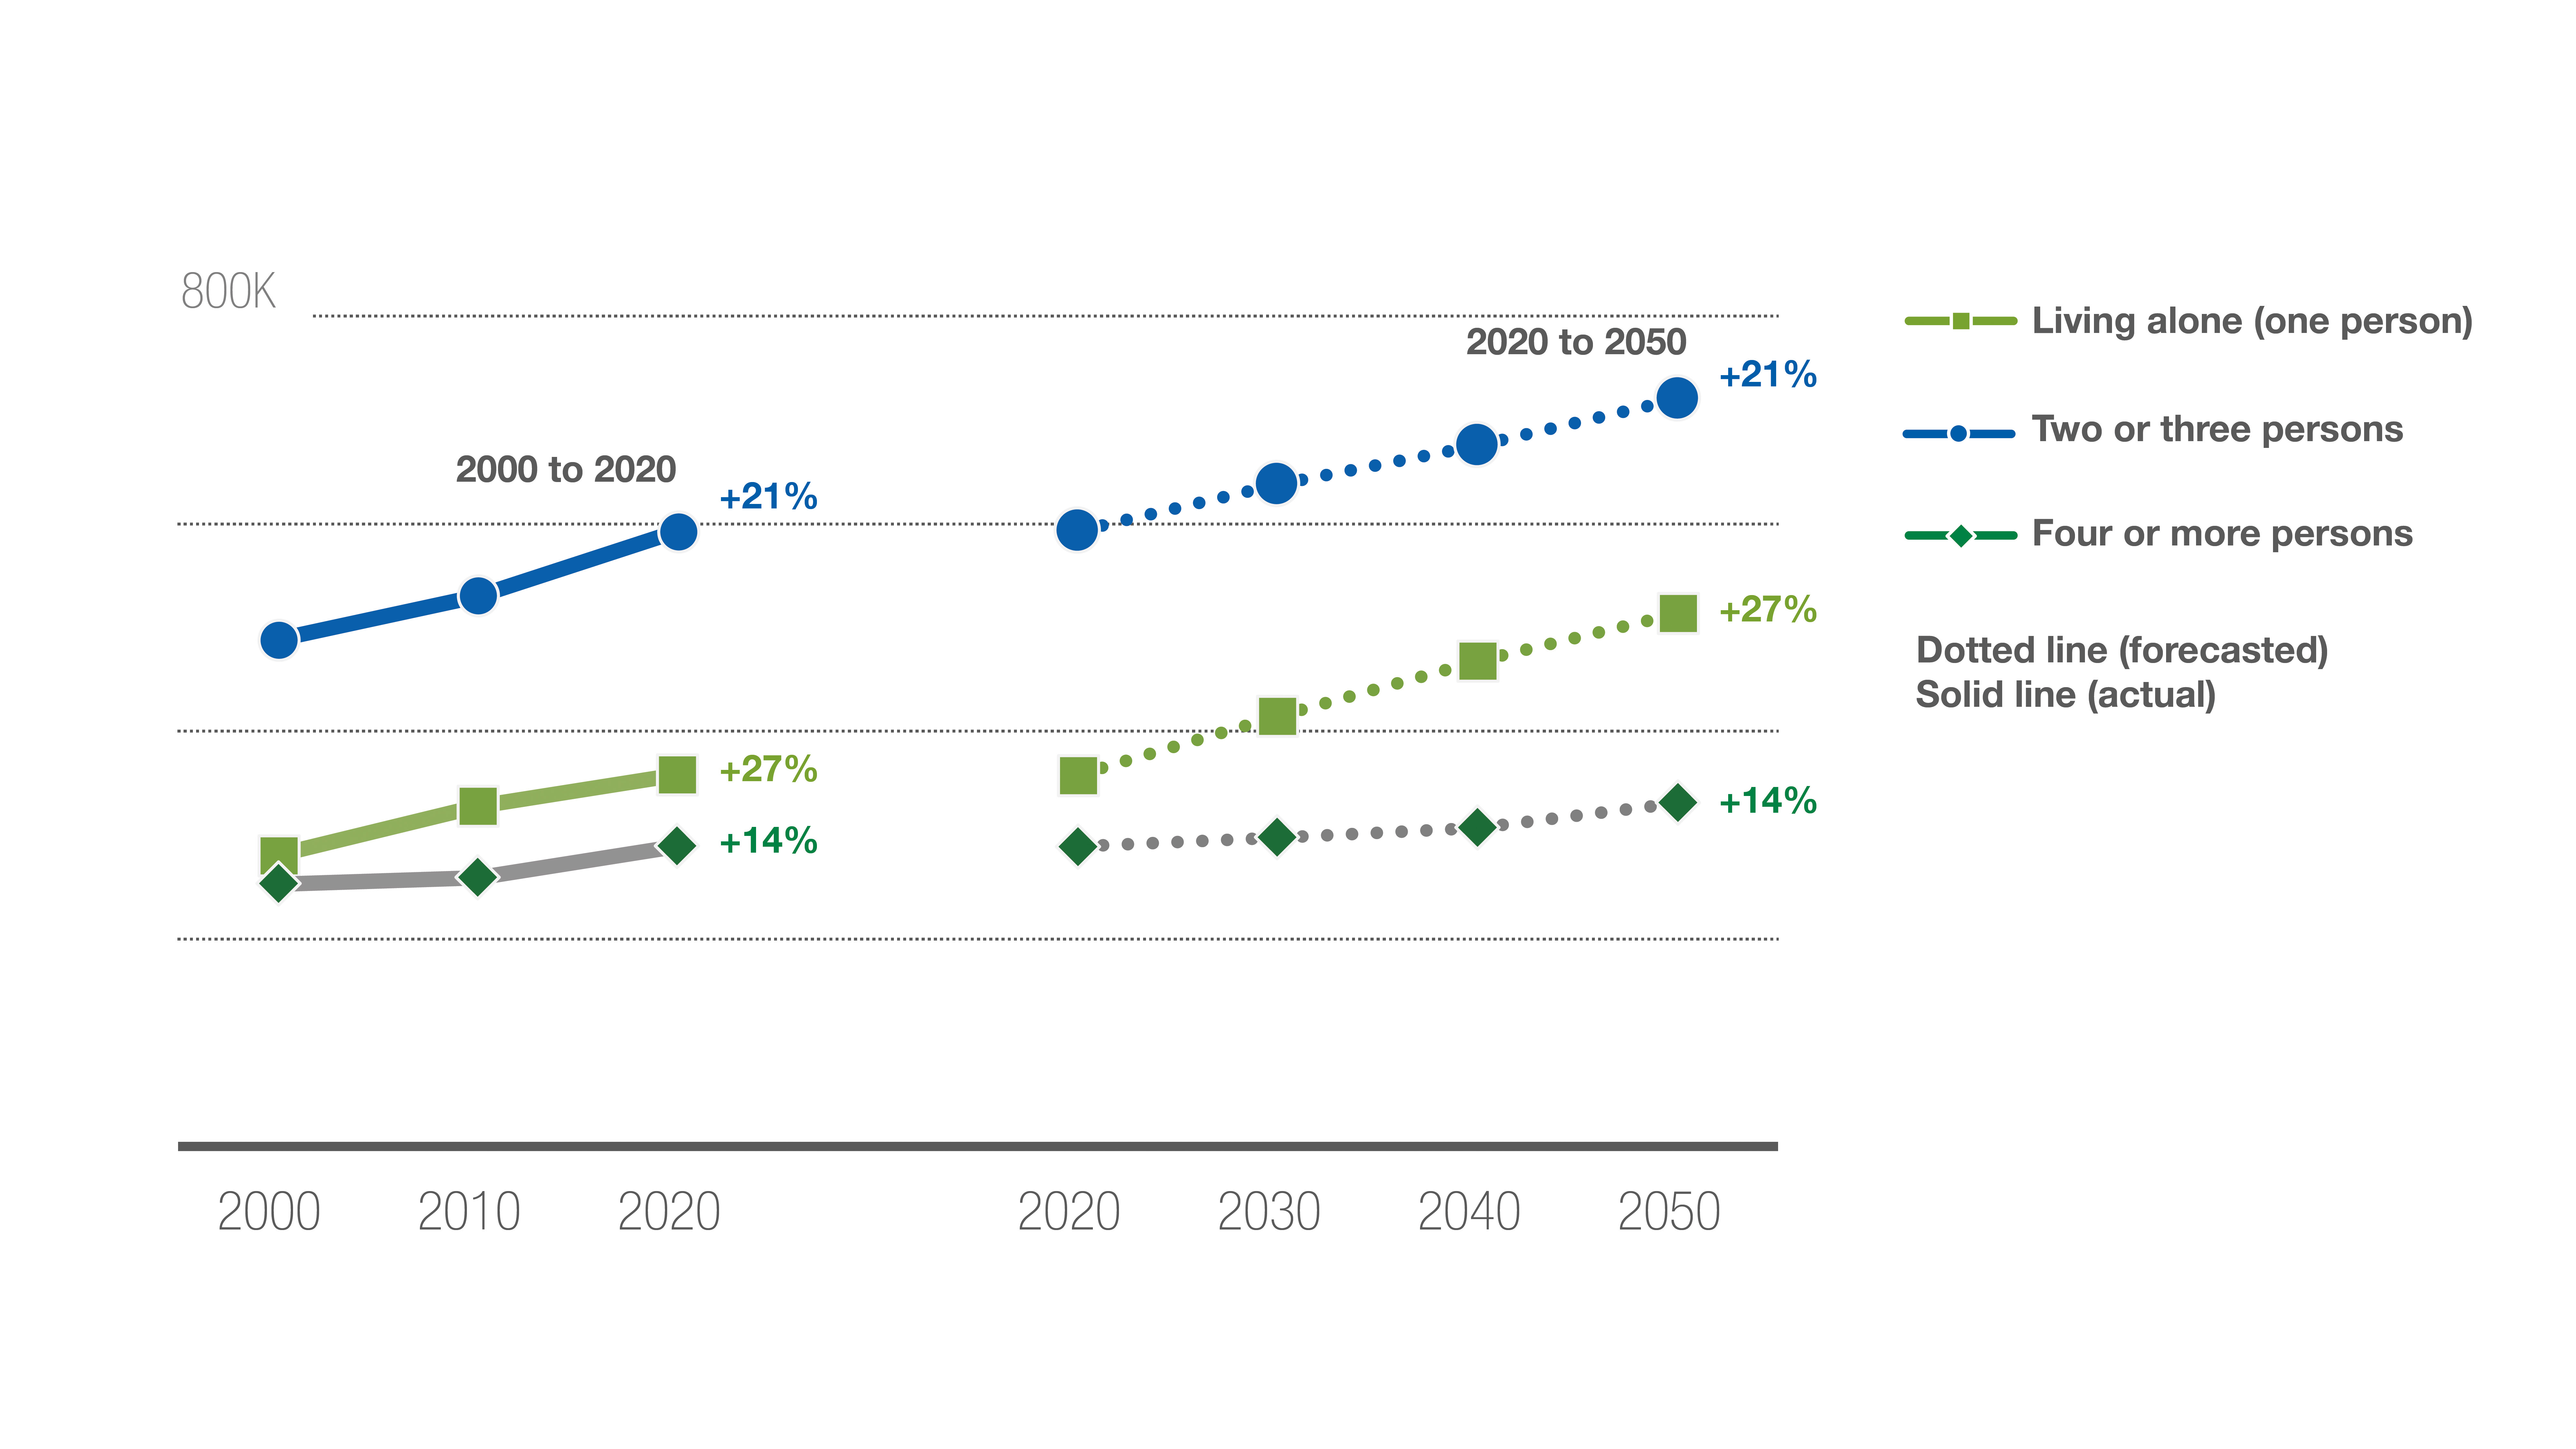
Source: Metropolitan Council regional forecast (April 2023).
These two transformational changes – 1) rapid growth of the region’s populations of color and 2) rapid aging of the region’s white population – have significant implications for our future workforce and housing markets.
Our region’s economy
With nearly 92,000 businesses providing over 1.7 million jobs, the Twin Cities metro is the economic hub for the state, western Wisconsin, the Dakotas, and Montana.76 Our region has a strong economic foundation due in part to a mix of nation-leading sectors like healthcare, finance, technology, manufacturing, and education, including several Fortune 500 companies. (See ‘Our region is dynamic and resilient’ for a full description of economic strengths.) Our region’s comparative affordability to other major metros, paired with gainful employment, has meant households could achieve stability if not real economic progress. However, as described earlier, broader economic conditions and trends in job and housing markets may be eroding those pathways, here as elsewhere.
Pandemic disruptions highlight persistent challenges
The region’s economy was experiencing robust economic expansion between 2010 and 2020 until the COVID-19 pandemic disrupted this momentum. As described earlier, the COVID-19 pandemic was an unprecedented shock to the region’s economy. Recovery in the region has been slow compared to the nation and peer regions, with employment returning to our two-million-job peak from 2020 only at the start of 2024. Recovery was uneven across sectors, as some industries took an upward trajectory while others lost ground. Employment and production expanded beyond pre-2020 levels in construction, manufacturing, wholesale trade, and most of the transportation sector. In contrast, service sectors such as retail, entertainment, and food services, that struggle with lost customer connections, reduced activity, and unused capacity have not yet regained their past employment levels.
Workers of color and immigrant workers were more likely be employed in customer-facing jobs in the service, retail, entertainment, and healthcare sectors when COVID-19 hit, and those sectors shed the highest numbers of jobs during the shutdowns, resulting in higher unemployment rates among those workers.77 But some portion of those jobs (and others in trade and manufacturing, for example) were deemed “essential” and workers of color and immigrant workers stayed employed, typically for low wages, few benefits, and in settings that heightened exposure to COVID-19.78 Serious or prolonged illness could prove to be as financially devastating to economically vulnerable households as job loss outright.79 Though federal relief packages and expanded unemployment insurance benefits helped to offset some of the initial economic shock waves – temporarily reducing disparities in lost income by race and ethnicity – immigrant and refugee workers, especially the undocumented, were not eligible.80,81
The pandemic’s economic impact on people with disabilities was – and is likely to remain – complex.
Labor force participation for people with disabilities in our state and region is already much lower compared to people without disabilities, regardless of race and ethnicity.82,83 Some of this disparity results from disabilities preventing people from working altogether. However, many people with disabilities seek employment but experience barriers like hiring bias among employers, unmet accommodations, and limited transportation options.84 Further, people with disabilities were advised by the public health community to limit their exposure to COVID-19 as much as possible, as some underlying health conditions could lead to more severe cases or other health complications.85
Given that baseline, even fewer people with disabilities in the labor force might have been expected. Instead, recent data show an increase of about 45,000 people with disabilities in Minnesota and an increase of persons with disabilities in the labor force of roughly 30,000 between 2019 and 2021; the overall labor force participation rate is up.86 Much of this increase is attributed to employers’ rapid widespread adoption of remote work, an accommodation disability advocates have championed for many years.87 Not all of it is, however.
This trend is also due in part to the legacy of COVID-19 itself; this virus caused illness and death – and for an estimated 7-10% of adults who contracted it – disability in the form of Long COVID.88 Long COVID includes a variety of physical and cognitive symptoms following a COVID infection that last for at least four weeks; if symptoms limit at least on major daily activity, it is covered under the Americans with Disabilities Act (ADA).89 University of Minnesota researchers modeled long COVID symptoms as they related to data about disabilities in the U.S. Census’s American Community Survey data and estimated a 16% increase in cognitive disabilities between 2020 and 2021.90 What this means for the region’s labor force longer-term remains to be seen.
During the height of the pandemic (2020-2021), the region’s labor force participation rates fell – like they did nationally – for several reasons, such as accommodating at-home schooling, childcare and other caregiving responsibilities, health concerns about COVID-19, and reduced hours. As jobs returned, workers didn’t, at least not at the pace needed to fill job vacancies, despite considerable (but uneven) wage growth across sectors.91 Low levels of immigration and an acceleration in retirements also played a role in tightening the labor market.92 In 2023, the region had 50,000 fewer workers in the workforce than would have been expected with normal demographic growth. As a result, we continue to have one of the highest rates of job vacancies in the nation, alongside exceptionally low unemployment rates. Misalignment between jobs and workers matters to the region’s economic growth in the short- and long-term.
Future employment growth depends on inclusion
The Twin Cities region is undergoing transformative demographic shifts as described above – an increase in racial diversity and an aging population – that will impact its economic landscape, particularly as it alters the composition of the region’s workforce.
The Baby Boom Generation (born between 1946 and 1965) is now retiring from the workforce. Millennials (born between 1981 and 1996) and the older members of Gen Z generation (born in the late 1990s) are as numerous as baby boomers but will not achieve a 1:1 replacement in the workforce. If the region’s labor force is to grow, it must come from inclusive strategies; the region’s population growth alone will not suffice. Integrating communities currently marginalized from the region’s economy, including immigrants and refugees, people with disabilities, Black people, American Indian people, people of color, and people over age 65 will play a key role. Continuing flexible work arrangements and remote work and expanding the potential pool of regional workers geographically can also contribute.
The regional forecast for employment to 2050 reflects these realities. A modest economic expansion is expected over the next 30 years, going from 1.58 million jobs in 2020 to 2.07 million jobs in 2050 (Figure 10). A considerable number of forecasted jobs have already been recovered between 2020 and 2022, so the forecasted growth from 2022 to 2050 is +342,000 jobs.
Figure 1.10: Employment in the Twin Cities region forecasted to 2050
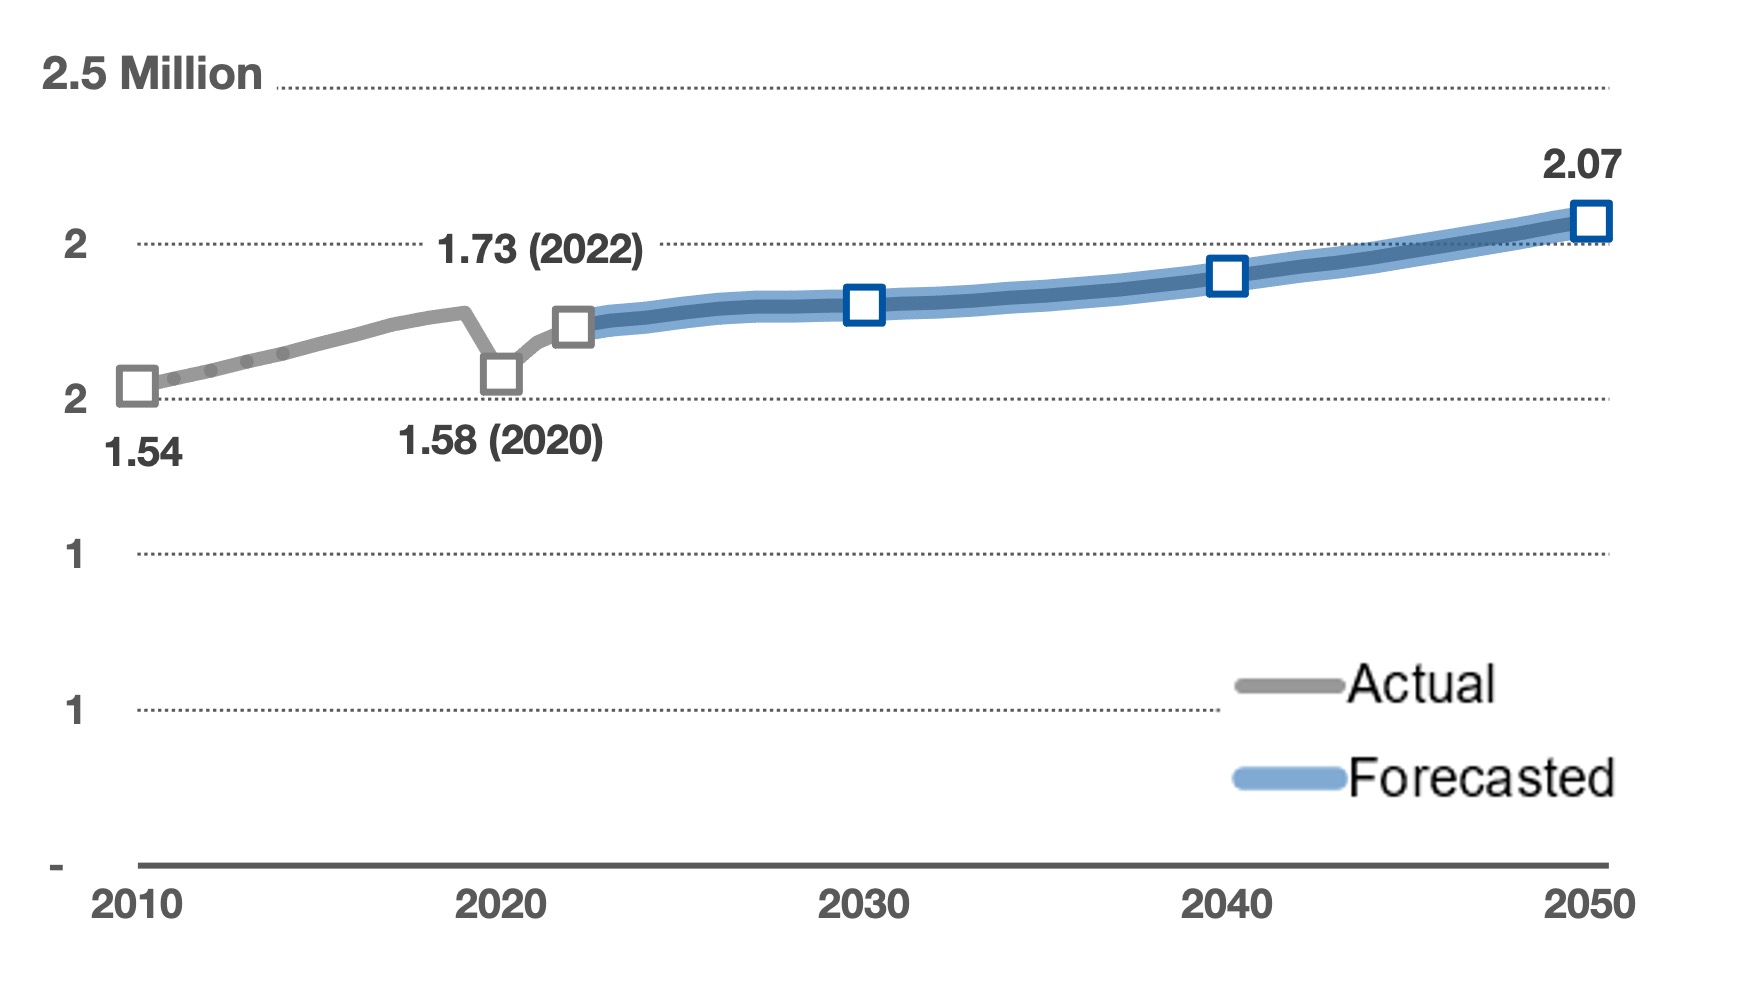
Source: Metropolitan Council regional forecast (April 2023).
The region’s Suburban Edge communities will gain the most jobs between 2020 and 2050 (154,000), followed by Urban (123,000) areas. The Suburban (144,000) and Urban Edge (79,000) communities are not far behind (Figure 11). The distribution of forecasted job growth between 2020 and 2050 overall reflects the region’s employment centers, located in the downtowns of Minneapolis and Saint Paul and in suburban areas. Even in an age of remote work and hybrid work, jobs will continue to cluster geographically and in alignment with regional infrastructure like highways and transit hubs.
Figure 1.11: Forecasted employment growth by Imagine 2050 Community Designations
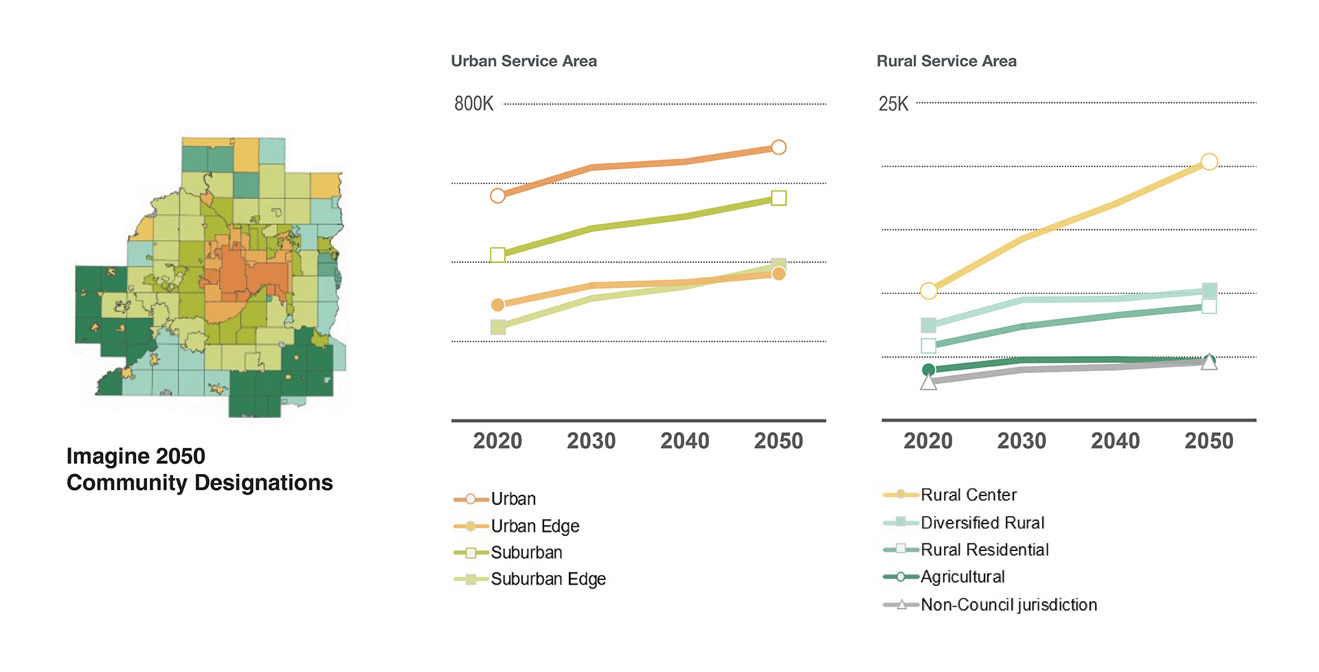
Source: Metropolitan Council local forecasts (January 2025). See Community Designations in Land Use Policy chapter for more description on what those designations are and the places they describe.
Cities in the region with the highest number of jobs in 2020, like Minneapolis, Saint Paul, Bloomington, Eden Prairie, Plymouth, and Minnetonka, show job growth rates between +19% and +38% during the forecast period. Eagan shows the highest rate of +40.6%. Considerable job gains are also noted in Shakopee, Brooklyn Park, and Burnsville over the next 30 years.
Regional Vision, Values, and Goals
To continue to build on the strengths of our region, and in light of the opportunities and challenges that lay before us, Imagine 2050 defines a vision for the growth and development of the Twin Cities region through 2050. The vision, values, and regional goals were developed and informed by several considerations. These include the vision and plans expressed by communities throughout the region in their most recent comprehensive plans; research on important issues for the region including those related to racial disparities, economic strengths and weaknesses, and climate issues; learnings and findings from engagement that the Met Council has conducted since adoption of Thrive MSP 2040, including themes that have emerged from conversations, research, and engagement in other planning efforts.
Vision for Imagine 2050
A prosperous, equitable, and resilient region with abundant opportunities for all to live, work, play, and thrive.
Shared regional values
The shared regional values are shared core beliefs or principles that guide the work of developing and implementing Imagine 2050. The values build on those identified in Thrive MSP 2040 and incorporate learnings through implementation over the last 10 years as well as the common values expressed by local governments and partners across the region in their plans and programs. Further, these values guide the Met Council’s own approaches to and expectations of partnerships and policy and program development to support full implementation of Imagine 2050.

Equity
We value the people and communities of our region. Our region is economically and culturally vibrant. We also recognize, however, the harm and disparities that injustices, including racism, have created.
We are dedicated to creating systems, policies, and programs that repair and heal past harm, foster an equitable future, and eliminate disparities. Communities that have been marginalized in the past will be at the center of this work in leadership roles.

Leadership
We value those in our region who inspire and motivate others for positive change. Our region is known for its civic engagement. We need broad and inclusive leadership to help confront the significant challenges we face around equity, climate change, safety, and other pressing issues.
To maximize the potential of our region and its communities, we turn to leadership that is diverse, collaborative, culturally competent, and innovative. We encourage this kind of leadership across all sectors including business, government, nonprofit, and education.

Accountability
We value being effective in our work and achieving measurable outcomes. Our region is known for its research, initiatives, and collaborations. We must be open to criticism and clearly understand when we are not achieving results or have harmed communities.
We recognize that we can maximize our effectiveness by being in partnership with others. We will also be transparent and flexible so that we can change course when needed.

Stewardship
We value our region’s resources. Our resources include our natural, economic, and financial resources as well as our infrastructure. We recognize that these resources may be vulnerable over time to changing conditions, including from climate change.
We must design our systems and allocate our resources in ways that can be sustained over time and support the needs of future generations.
Regional goals
Imagine 2050 is organized around five shared regional goals. The regional goals identify the desired end states for the major cross-cutting issues facing our region. It will take actions from all levels of government, partnerships with nonprofit organizations, education institutions, and other leaders, and actions across the full spectrum of policy areas to effectively achieve these goals. No one partner nor one program will achieve any of the regional goals on its own.
The five regional goals will be achieved through our policies and actions that inform practices, programs, and partnerships.
- Our region is equitable and inclusive.
- Our communities are healthy and safe.
- Our region is dynamic and resilient.
- We lead on addressing climate change.
- We protect and restore natural systems.
No one goal can be successfully implemented in isolation. Rather, Imagine 2050 recognizes the interconnectedness of the goals and the importance of integrated approaches to realize the intended outcomes. For example, we can only lead on addressing climate change if we are also protecting and restoring natural systems and doing so in an equitable and inclusive manner. It is in the intersection of the regional goals where there is the potential to have the greatest impact on the region. Successfully advancing the regional goals requires attention to each of the goals in all our actions, policies, and programs. Integrated approaches and strong partnerships are key to achieving the regional goals and vision.
More specifics regarding each of these regional goals are detailed in the sections of this plan below. Each of the chapters of Imagine 2050 (housing, land use, transportation, parks, and water) details objectives, policies, and actions that together advance the shared regional goals and the regional vision. Objectives articulate the achievable results that advance each regional goal and are accompanied by policies and actions that can be implemented through specific actions by the Met Council and our partners. While this plan sets a foundation for local comprehensive planning, it also is a statement of the Met Council’s commitments to advance regional goals and provides directional guidance and identifies priorities for our own programs, investments, and activities.

To achieve the regional goal of an equitable and inclusive region, the Met Council has developed a series of frameworks to guide the regional and local planning processes, the work of the Met Council, decision-making across the region, and implementation of priorities established in Imagine 2050. Each framework addresses a key issue which in itself can affect change, and taken together can significantly alter the lives of the most vulnerable populations in this region.
The Met Council will use these frameworks in projects, policy, processes, and procedures to convey a singular message to Met Council partners in how this organization leads and conducts our business. We will share incentives, tools, technical assistance, resources, and lessons learned with partners and local governments to influence and support change at the local level. We will also regularly evaluate and report on the implementation of the equity frameworks and the related commitments, objectives, and actions in Imagine 2050.
Our transition to a framework model to advance regional equity builds on insights gained after Met Council named equity as a regional outcome in the previous regional development guide. Though Thrive MSP 2040 established the Met Council’s commitment to advancing equity, it structured the discussion around containing an expansion of concentrated poverty in the region. This proved to be a limited and limiting approach that further harmed marginalized neighborhoods.93 As such, the Met Council has continued to work with partners in the region to evolve both our approaches to advancing equity across the region as well as to how we structure our analyses and evaluations. The frameworks in Imagine 2050 reflect these changes.
Patterns of historical injustices
As history and continual engagement and community collaboration insights have demonstrated, it is imperative that the Met Council works toward creating an equitable region. The lasting impacts of historical injustices, systemic racism, and discrimination continue to reverberate within our region, disproportionately impacting Black people, American Indians, and people of color. Discriminatory and racist policies were thoroughly planned to benefit white Americans, perpetuating a cycle of exclusion for Black people, American Indians, and people of color. And seemingly race-neutral policies continue today, with inequitable impacts and outcomes persisting in the region and across a variety of outcomes. It is important to recognize these historical impacts and to understand the context that led to our present-day disparities in order to be successful in eliminating the disparities.
The United States itself is built upon legacies of land theft, colonization, and slavery. The original stewards and kin of the land are the Indigenous peoples of Turtle Island. The seven-county region exists on the homeland of the Dakota peoples and near treaty lands of the Ojibwe and Ho-chunk peoples. Dakota, Ojibwe, and Ho-chunk peoples have survived centuries of genocidal policies, broken treaties, and discrimination in this region. Currently, American Indian peoples from hundreds of tribes have relocated to the Twin Cities, and 42% of American Indians in Minnesota live in the metro area.94
Slavery and its legacy
Slavery, defined as a person who is treated as the property of another person, was practiced in the United States until the passing of the 13th amendment to the U.S. Constitution in 1865.95 While slavery was not legal in Minnesota, enslaved people were forcibly brought to Minnesota in the 1800s with many living at or passing through Fort Snelling. Southern slaveowners were also frequent tourists to the region during the mid-1800s and invested in business and institutions, influencing the early economy in the state.96
The lasting effects of slavery are foundational to systemic racism97 and anti-Blackness.98 Historical slavery practices have continued in the inequities found in modern-day policing99 and have persisted in modern incarceration rates and criminalization of the Black population.100 In 2019, the incarceration rate for Black people in the Twin Cities was 11 times the rate for white people.101 When interacting with police between 2016 and 2021, Black people made up 27% of policing deaths by use of force in the region despite making up 7% of the population at the time, and American Indian people made up 6% deaths despite making up 1% of the population at the time.102
The legacy of slavery has also fueled discriminatory policies103 and continues to affect the health and the economic, social, and cultural well-being of Black communities and people of color today. For example, as we work to create public spaces for community connection, access to those spaces can be limited by the interpretation and enforcement of loitering and lurking laws. A Black person is 27 times more likely to be arrested for loitering in the region.104 Other policies such as some “crime-free” housing ordinances, claiming to reduce illegal activity, have been found to violate the Fair Housing Act because they led to Black and Latine renters getting evicted at higher rates than white renters105,106 and to discriminate against those with disabilities.107 Discriminatory practices and policies that result in incarceration and eviction create additional barriers to accessing rental housing and employment because of one’s record of involvement with the criminal justice system. As the region plans for a more just future, we must be mindful of how systemic issues permeate into seemingly race-neutral programs and policies. As a region, we all have a responsibility to remove barriers to equitable outcomes so people can have healthy social connections, and safe and dignified communities in which to live.
Racial covenants and redlining
Starting in the early 20th century, the Great Migration brought an influx of Black residents to cities in the Northern, Midwestern, and Western United States who sought to escape discrimination and racial violence in the South.108 White residents across predominantly white cities used racial intimidation, violence, and legal action against their Black and people of color neighbors. In response to these demographic changes, the real estate industry and city planners in many parts of the U.S. responded by including exclusionary and racist “racial covenants” in the deeds of homes, furthering segregation efforts. These racial covenants explicitly prohibited many racial groups – particularly Black residents - ethnicities, and nationalities from being able to choose where they wanted to live. By midcentury, over 25,000 properties in Hennepin and Ramsey counties included racial covenants,109 effectively segregating neighborhoods.
Racial covenants influenced the subsequent practice of redlining. Redlining refers to a neighborhood classification scheme developed by the Home Owners’ Loan Corporation (HOLC). HOLC categorized neighborhoods based on perceived financial risk and consistently classified neighborhoods that were predominantly communities of color as ‘hazardous’ for loan guarantees. Redlining occurred regardless of how affluent a community was – even wealthier neighborhoods were redlined if they were predominantly communities of color, and particularly if they were Black communities. Redlining depressed property values, and this now-cheaper land was desirable for industries. Some redlined areas had previously existed near heavily polluting land uses, but with the advent of these distinct low-land-value areas, more industrial land uses moved in.110
Although the use of racial covenants on houses was made illegal in Minnesota in 1953 and the Fair Housing Act banned discrimination in housing in 1968, the legacies of these policies are apparent in many disparities that still exist in the region. Redlining has made it difficult for Black, American Indian, and households of color, especially Black households, to build generational wealth.111 Formerly redlined areas exhibit more disparities in education and residents often have less access to green space, environmental amenities, and nutritious, affordable food.
Removal of homes due to highway expansion
The systemic exclusion of Black and households of color from wealth-building opportunities and the violent removal of their communities continued with the 1956 Interstate and Defense Highways Act, which funded highway construction across the country, displacing many residents and destroying neighborhoods. In the Twin Cities, Interstates 94 and 35W were constructed. Rondo, a vibrant Black working class Saint Paul neighborhood, was split in half despite their efforts to protest and lobby against the I-94 highway development.112 The planning and construction of 35W forced out a thriving South Minneapolis Black community113 including homes, prominent businesses, and cultural organizations. Many residents were unaware of the highway development until bulldozers arrived, and compensation for displaced homeowners was inadequate. Renters and businesses, particularly Black renters affected by redlining and racial covenants, received no financial support and were prevented from moving to surrounding neighborhoods, exacerbating their displacement and hindering community connections.
Civil Rights movement
In the 1950s, the Civil Rights Movement (1954-1968) began as a social movement effort to defeat legalized racial discrimination, segregation, and disenfranchisement of Black Americans and move towards racial justice. The Civil Rights Movement was shaped by activism, marches, protests, boycotts, freedom rides, and lobbying for legislative action. In the Twin Cities, key civil rights leaders included Frederick L. McGhee, Reverend Denzil A. Carty, Nelle Stone Johnson, and Harry Davis.114 Despite court challenges, police brutality, and racial violence, the Civil Rights Movement prevailed and led to landmark cases such as Brown v. Board of Education to desegregate schools, Voting Rights Act of 1965, and the Civil Rights Act of 1964, which outlawed all discrimination based on race, color, religion, sex, and national origin. As a follow-up to the Civil Rights Act, Congress passed the Fair Housing Act of 1968 to address racial discrimination in housing following the assassination of Civil Rights leader, Rev. Dr. Martin Luther King, Jr.115
Latine people and communities in the region
In the early 1900s, over 7,000 Mexican laborers moved to Minnesota employed by beet farmers, sugar companies, meat-packing plants, and railroad lines. They faced exploitation in the forms of low wages, inadequate housing, unsteady employment, and racism. The Anáhuac Society was formed in 1922 as a community hub to provide local services such as neighborhood guidance, employment opportunities, cultural enrichment, and in some cases, sickness and funeral benefits.116
In the 1960s and 1970s, a growing Chicano Movement occurred as Mexican and Mexican American laborers moved to Saint Paul’s West Side. Chicano activists in rural Minnesota also faced discrimination and barriers as farm workers. They organized Centro Campesino in Southeast Minnesota by 1997. Despite systemic barriers to opportunities such as housing and living wage jobs, the Chicano Movement set a foundation for empowerment for Latine communities in the seven-county region today.117 As Latine people migrated to the region, they began forming community organizations such as Communidades Latinas Unidas En Servicio (CLUES) in 1981, which is now the largest Latino-led nonprofit in the state.
Due to increasingly growing population of Latin American immigrants, more Latin-American-owned businesses were established in Minneapolis in the 1990s. As businesses began to expand and communities blossomed, community leaders wanted to build economic power and self-sufficiency. In 1992 community organizers from Sagrado Corazon church created the Joint Committee on Immigration and the Economic Development Committee to “focus building economic power and promote economic opportunities” in flourishing Minnesotan Latine communities. These eventually became what is officially known as the Latino Economic Development Center (LEDC). The Latine communities in the region are a testament to community power and solidarity.
Asian and Asian American people and communities in the region
The region is home to many diverse Asian and Asian American communities. Asian people comprise 7.8% of the region’s population.118 Asian and Asian American communities in Minnesota encompass people from a diversity of cultures. The region’s largest Asian cultural communities include Asian Indian, Burmese/Myanma, Cambodian, Chinese, Filipino, Hmong, Japanese, Korean, Lao (non-Hmong), Thai, and Vietnamese communities.119
The Twin Cities region has the largest urban Hmong population in the country. Hmong people are the largest Asian group in Minnesota, and Hmong is one of the most spoken non-English languages in Minnesota.120 Hmong people are prominent leaders in the region. After a surge of anti-Asian harassment and violence in the region,121 Hmong Minnesotan leaders led the update of an anti-hate crime bill to include more accessible and culturally responsive reporting measures.122 Hmong businesses and community centers, including the Hmong Cultural Center and Museum,123 are a vibrant and integral part of the region’s cultural landscape.
Anti-immigration and xenophobia
While the United States is comprised of diverse peoples and cultures, we have a longstanding history of anti-immigration policies and xenophobic sentiment. The first explicitly anti-immigration policy was the Chinese Exclusion Act of 1882, setting precedent for additional exclusionary practices discriminating against people of color immigrating to the United States.124 Immigrants had little to no choice of where they could live, resulting in exploitation in housing, labor, environmental hazard exposure, and access to amenities and care. This legacy in discrimination has cultivated xenophobic sentiment in United States culture, including in the seven-county region.125
At times in United States history, government agencies decided to expand policies supporting immigrants. These include the 1965 Immigration and Nationality Act, the Immigration Reform and Control Act (IRCA) of 1986, Temporary Protected Status (TPS) in 1990, and Deferred Action for Childhood Arrivals (DACA) in 2012. Such policies provide opportunities for expanded immigration or extension of authorized status for those already in the United States.
Undocumented immigrants are heavily targeted by not only xenophobic and racist policies, but cultural sentiments and political campaigns as well.126 Undocumented immigrants and refugees continue to be placed in poor quality housing and unsafe labor conditions and have limited access to living-wage jobs.127
The largest immigrant populations in the state are from Mexico, Somalia, India, Laos, and Vietnam.128 Minnesota is home to the largest population of Somali immigrants in the country.129 Somali communities and businesses are a prominent part of the region’s development and community building..130 Many immigrant populations and others also face religious-based discrimination, stereotypes, and threats of violence in our region adding to the xenophobic sentiments these communities face.
The region is also a new-found home for refugees, including Somali, Myanma/Burmese, Laotian and Hmong, Ethiopian, Liberian, Afghan, Bhutanese, Iraqi, and Ukrainian refugees.131 The region contains sanctuary cities, including Minneapolis and Saint Paul.132 A sanctuary city is “a municipality that has adopted a policy of protecting undocumented immigrants by not prosecuting them solely for violating federal immigration laws.”
Community engagement recommendations from immigrant communities included expanded use of Individual Taxpayer Identification Number (ITIN) for obtaining loans and renting homes. Immigrants, including undocumented immigrants and refugees, are an important part of the economy, communities, and cultural landscape that make up our region, and must be respected as such in our region’s policies, practices, and processes.133
Racial intimidation and other discriminatory practices
Despite the legal end of racial discrimination and segregation, racial intimidation and violence against Black, American Indian, and people of color still exists in U.S. culture, including the seven-county region. In addition to anti-immigration and xenophobic sentiments, racial intimidation affects Black communities, American Indians, and people of color through cultural sentiments as well as formal and informal policies and practices.
In relation to racial disparities in homeownership, evidence shows that discriminatory practices including real estate agents steering Black people and other racial minorities to or from certain neighborhoods still exists. After reporting in national newspapers around apparent discrimination in home appraisals, Freddie Mac followed up with a comprehensive study of evaluation of home appraisal gaps between Black and Latino tracts and white tracts and found that homes in Black and Latino census tracts were more likely to be appraised at lower values than comparable homes in white census tracts.134 These systemic practices continue to depress the ability for Black and Latino homeowners to build wealth through homeownership.
Erasure of history in data/narratives
The data and tools we develop must remain people-centered, driven by concerns articulated by overburdened communities, and be deeply interwoven with Met Council processes for budgeting, policy development/prioritization, and program implementation. Too often, purely quantitative approaches to policy inherit biases from the data itself – that is, the research priorities of institutions shape how data is collected and distributed, which inevitably influences the downstream analyses that arise from these datasets.135 This can lead to disconnects in what residents and communities are experiencing and what government entities such as the Met Council acknowledge or commit to address. To combat this bias, we can employ a mixed methods approach that synergizes quantitative analyses with qualitative datasets such as social knowledge and lived experience.
Equity framework
A person-centered approach must guide the region’s efforts in creating an equitable region and closing racial disparities. A shared understanding of equity is essential in working toward a more equitable region.
To ensure shared understanding around what equity within Imagine 2050 means, to ensure consistency across all policy chapters, and to embed equity within the planning, processes, decisions, and policies of this plan and others, Imagine 2050 defines an equity statement and an equity framework. Equity is both a practice and a process, so conditions of success are included to ensure that effective operationalization is possible at all levels of implementation.
Equity statement
The equity statement was developed as a guiding definition to ensure a shared understanding and application across Imagine 2050 and for the region. The equity statement encompasses the primary emphasis and outcomes desired for regional equity. Other marginalized – factors, such as abilities and income, still matter and are critical aspects in an intersectional perspective on impact and outcome.
Equity means that historically excluded communities – especially Black communities, American Indian communities, and communities of color – have measurably improved outcomes through an intentional and consistent practice of adapting policies, systems, services, and spending so that they contribute to the repair of both historic and ongoing injustice.
Imagine 2050 centers race in its focus on equity because of the strong connections of systemic racism and racial inequities with other inequities. The Government Alliance on Race and Equity (GARE) writes, “Racial inequities continue to be deep, pervasive, and persistent across all indicators for success, regardless of region. Deeply racialized systems are costly and depress life outcomes for all groups. Systems that fail communities of color first and hardest, fail all of us.”136 If one desires to uncover inequities, one might begin with race first, and inequities in other demographics will be discovered. Thus, all groups experiencing inequities (such as those with different abilities or low-income households) benefit when we lead with race in our equity efforts. GARE makes a call to action for local governments, stating: “As local and regional government deepens its ability to eliminate racial inequity, it will be better equipped to transform systems and institutions impacting other marginalized groups.”
In partnership with the Center for Urban and Regional Affairs, the Met Council developed a regional equity framework. The equity framework guided the development of Imagine 2050 and will continue to guide the Met Council’s work and the implementation of Imagine 2050. The grounding concepts of the equity framework include contextualized, community-centered, and reparative (see Figure 1) to provide a lens through which planning, processes, decision-making, and policies can be evaluated.
Figure 3.1: Equity framework grounding concepts
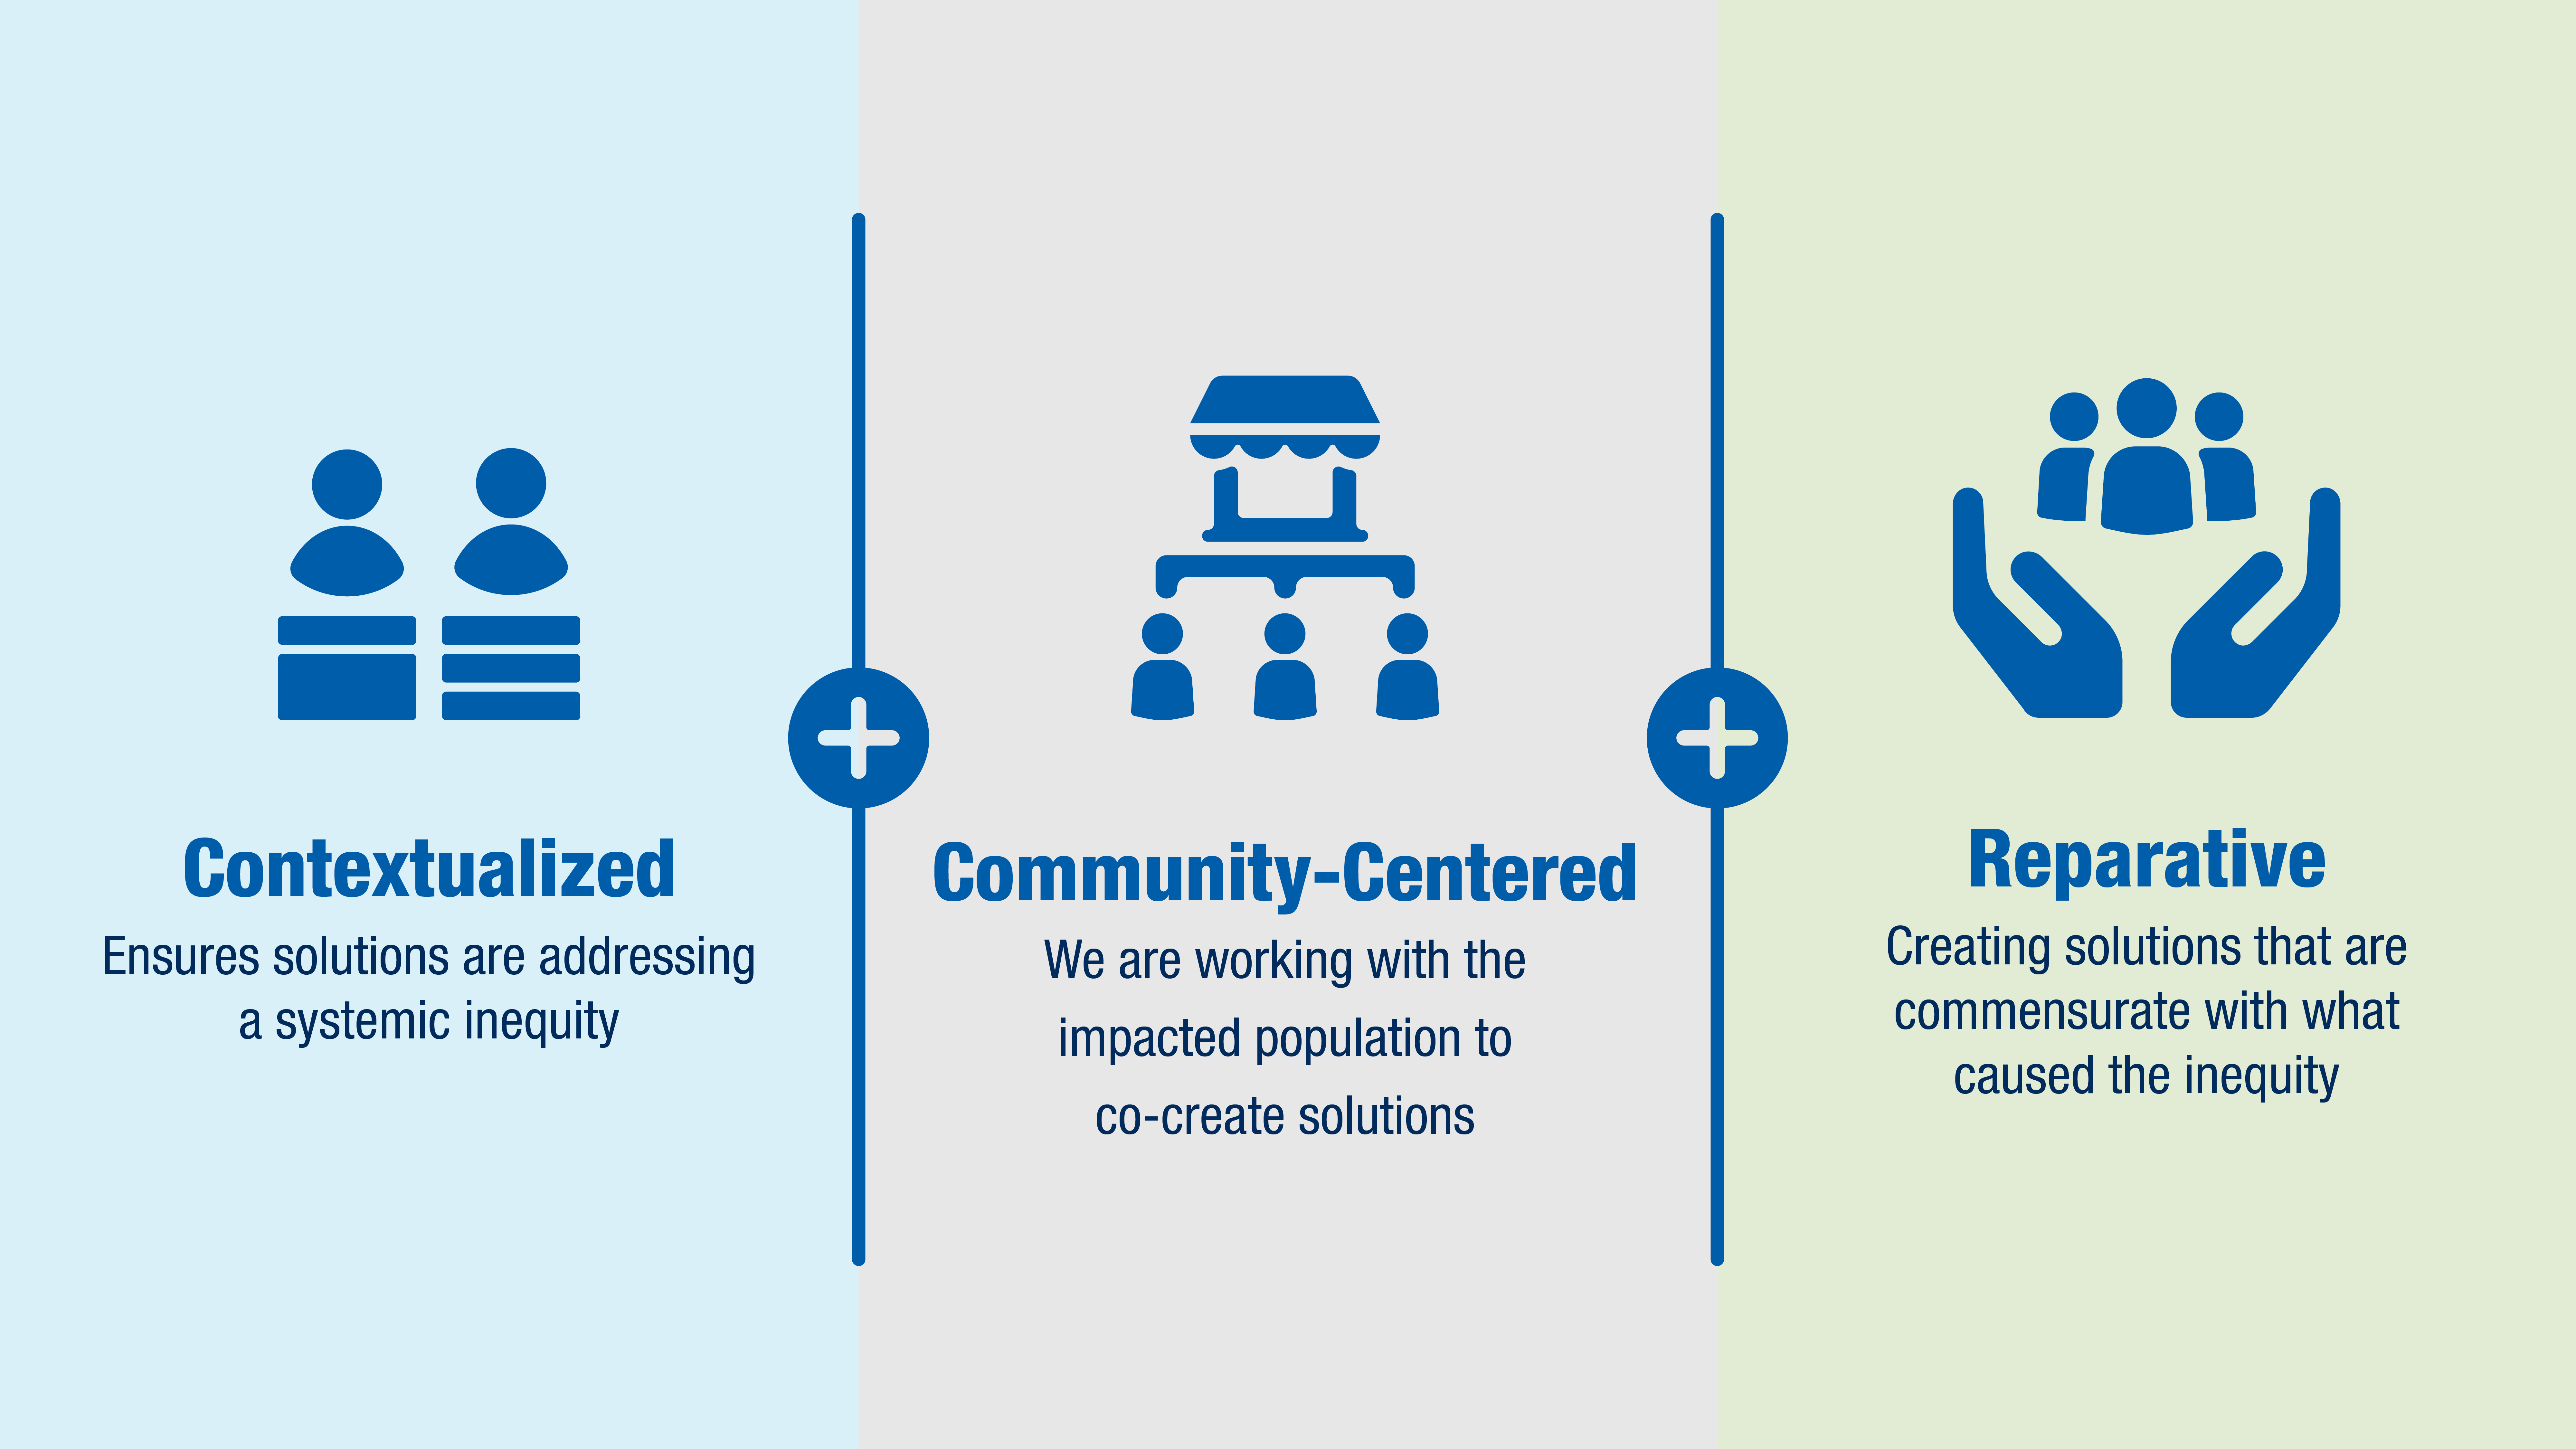
The purpose of the equity framework is to provide an intentional approach to taking steps to remediate the prolonged impacts of historical and inequitable practices in the region. The grounding concepts of the equity framework are foundational across the four accompanying frameworks and bodies of work that target more specific equity issues. They are:
- Environmental justice framework
- Anti-displacement framework
- Community-centered engagement
- Land, water, and people commitments
The following section offers an in-depth approach to implementation of the equity framework and conditions for success that are included to ensure that well-established principles of equity work are adopted.
Structure of the equity framework
The equity framework is intended to be used to assess whether stated intentions of policies, planning, and processes align with the three grounding concepts: contextualized, community-centered, and reparative. The grounding concepts enable a better understanding of the power of positional roles and reflect on challenging preconceptions, good or bad, regarding the system or policy area regarding equity and inequity.
- Contextualized: Ensure solutions address systemic inequities.
-
- Specifically name institutionalized inequities impacting residents of the region.
- Center the communities’ account of the history and/or relationship to the issue and inequities.
- Gain a better understanding of the way historical injustice (exclusion, undercapitalization, etc.). compound to become present and future injustices, disparities, and barriers.
-
- Community-centered: Work with impacted people and populations to co-create solutions.
-
- Guide approaches by expertise from communities and residents experiencing the greatest impact.
- Maximize existing decision-making processes to the benefit of communities and residents who are experiencing the greatest inequities.
- Ensure transparency and proactively share information with the communities and residents who are experiencing the greatest inequities.
-
- Reparative: Seek restorative remedies commensurate with the level of negative impact.
-
- Identify current mechanisms in place to ensure that policies are routinely assessed, improved, and adjusted.
- Translate equity policy priorities into the implementation of programs and procedures and projects.
- Current practices seek to repair past inequities in a manner that is commensurate with the negative impacts of past injustices.
- Measurable impact of equity-oriented actions and efforts are able to be observed, felt and evaluated.
-
The equity statement and five conditions for success provide concrete areas, or facets of existing conditions to review the systems and policy areas for improvement.
Conditions for success
Leads with race: Improve outcomes toward eliminating racial disparities. Focusing on racial equity provides the opportunity to introduce a framework, tools, and resources that can also be applied to other areas of marginalization. In project, program, or policy development, leading with race means:
-
-
- Reflecting the experiences of Black communities, American Indians, and people of color, and that those experiences are reflected in the supporting data and analysis and additionally, that the data and analysis are disaggregated and granular (to extent possible) to determine whether there are differences in outcomes among different populations.
- Specifically supporting Black people, American Indians, and people of color, and analyzing whether everyone is served equally or equitably.
- Identifying and considering inequities between racial groups.
-
Action-oriented: Intentional, ongoing, and consistent practice of adapting policies, systems, and structures. In project, program, or policy development, action-oriented means:
-
-
- Considering all tools and authorities that can be leveraged including funding, as well as identifying strategies available and the conditions under which they would be used.
- Evaluating the potential to increase/decrease disparities in the region; acknowledging when disparities remain constant for each potential action.
- Tracking and quantifying progress towards equity outcomes.
- Ensuring that equity-oriented work is sustained and refreshed over time.
-
Historic context: Repair both historic and ongoing injustice. In project, program, or policy development, this means:
-
-
- Assessing past actions or investments and taking responsibility for resulting harm or inequities.
- Evaluating current conditions and context for whether they are reflective of reparative outcomes.
-
Power-sharing: Historically excluded communities share power in all levels of decision-making. In project, program, or policy development, this means:
-
-
- Engaging the groups most impacted as a starting point and, where needed, building capacity within communities to effect change in governmental decision-making.
- Engaging the groups that traditionally have not had power in government to provide feedback at every stage of the work.
- Reflecting the priorities of impacted groups in the work.
-
Accountability: Measurable improved outcomes as defined by those most affected by them through engagement. In project, program, or policy development, this means:
-
-
- Identifying measures to track progress towards meeting the identified outcomes.
- Reporting on progress towards those outcomes or goals even if they have not been reached or have had negative outcomes.
-
Figure 3.2: Equity framework conditions for success
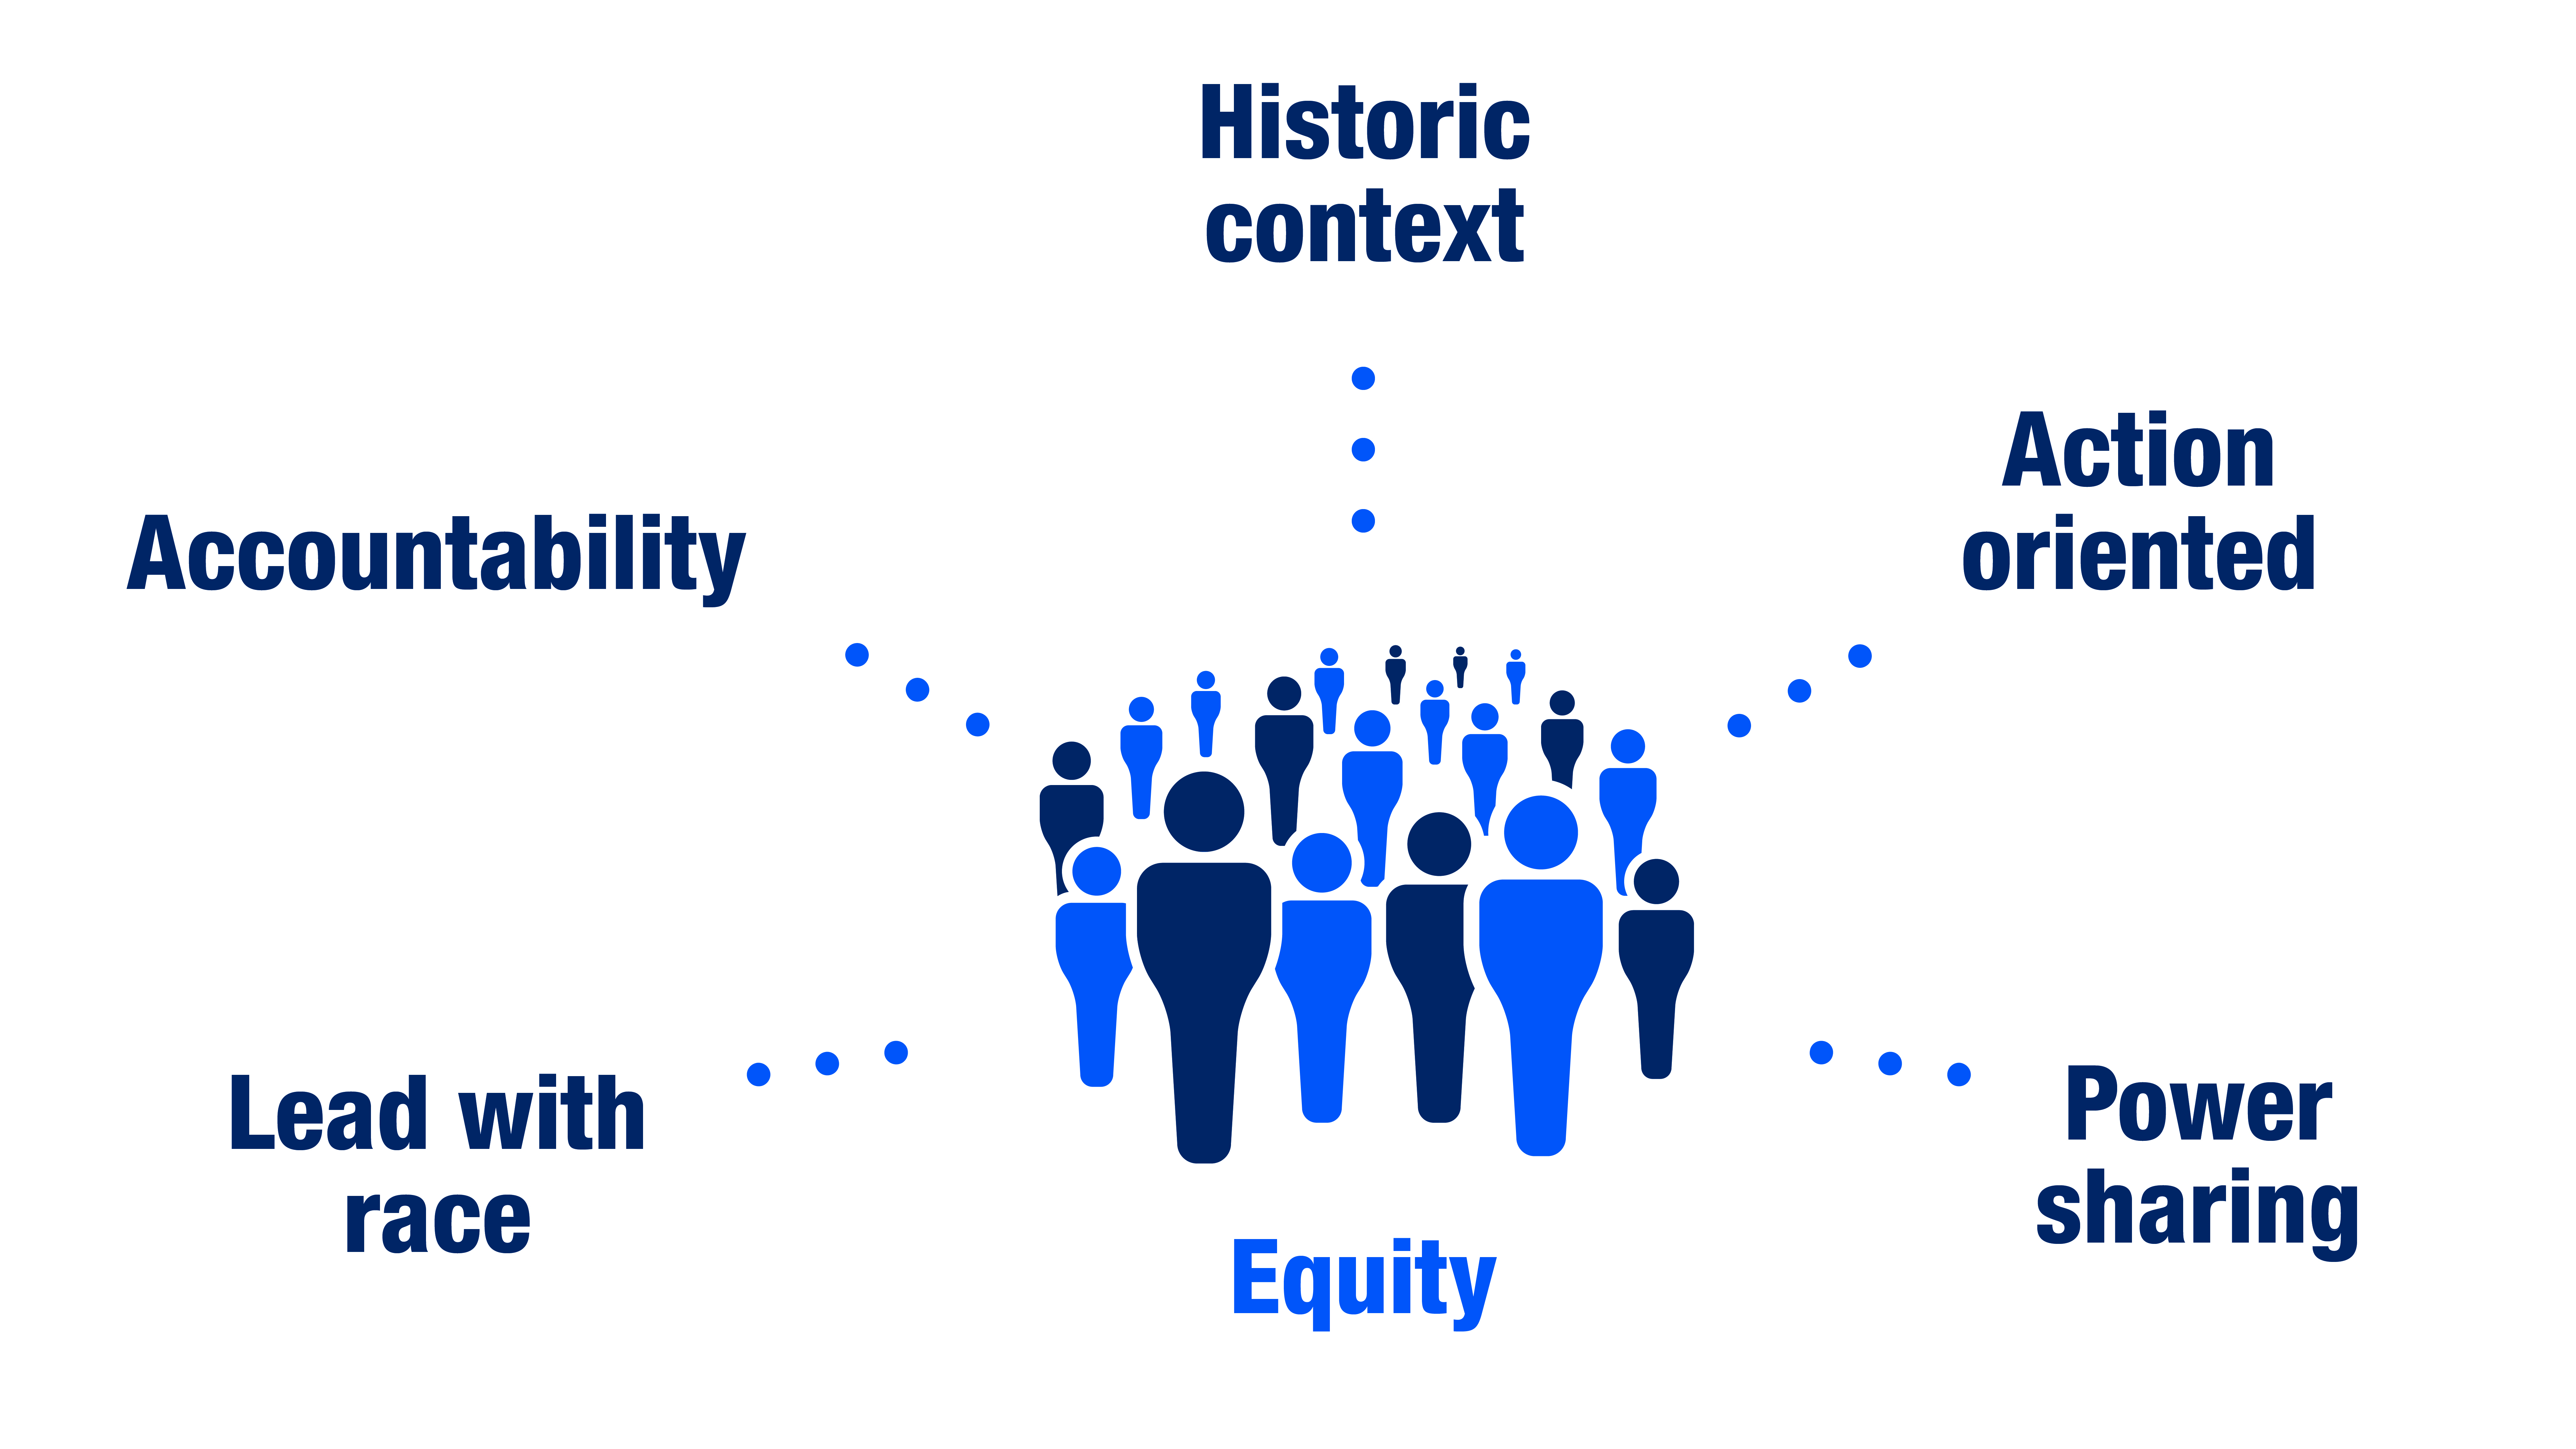
Environmental justice framework and definition
An environmental justice framework includes assessment tools and approaches to mitigate unjust and inequitable decisions and conditions, and to maximize environmental benefits for all communities – especially overburdened communities. A framework assesses and reviews processes in public policy planning, including engagement, but may also be used during or after project or policy implementation, such as evaluation. A framework also uncovers underlying actions that contribute to and produce disparate exposure and unequal protection from environmental hazards.
This section defines environmental justice and related terms, describes framework components, details environmental disparities data and related tools, and presents environmental justice assessments and measures.
The environmental justice framework provides guidance on how to integrate environmental justice principles into the practices and policies set by Imagine 2050.
The Met Council’s commitment to environmental justice starts with a renewed pledge to build relationships with communities overburdened by ambient health risks to understand their experiences with practices that have perpetuated environmental injustices. Together - identifying regional policies and investments that will improve our shared stewardship of the region’s land, water, and air - we can repair past harms and improve community health and safety.
Defining environmental justice and overburdened communities
Environmental justice is the right for all residents to live in a clean, safe environment that contributes to a healthy quality of life.
"Environmental justice means diverse ways of understanding human and non-human relationality and changing culture."
-Urban Roots youth member
The Met Council recognizes that environmental justice centers, but is not limited to, Black communities, American Indians, people of color, disabled communities, immigrants and refugees, and low-income communities who have and continue to experience a legacy of racism or other structural or systemic barriers that have resulted in environmental injustices, harms, and risks.
Environmental justice requires necessary adaptations to regional services, requirements, policies, practices, processes, and decisions, starting with Imagine 2050, to support a healthy and safe region.
Overburdened communities137 are those who bear less responsibility for climate change yet are disproportionately affected by the cumulative impacts of climate change and environmental hazards. The impacts of climate change affect everyone, but due to systemic factors and no fault of their own, some communities are disproportionately burdened by the effects of climate change and environmental risks.138
Environmental justice is not limited to human communities. Natural communities (water, land, air, animals, plants, fungi) are just as vital in environmental justice processes and policies. Natural communities are living beings that also unjustly bear the burdens of climate change. Respecting the holistic health of the environment includes understanding the intrinsic relationship between human and natural communities. When applying the environmental justice framework, we must ensure that natural communities are included in decision making and actions.
Despite these systemic challenges and threats, overburdened communities continue to empower themselves and thrive. Many overburdened communities have produced community-specific solutions related to environmental injustices. Prioritizing overburdened communities in engagement and co-creating contextualized solutions in partnership mitigates harmful outcomes and instead creates pathways for reparative solutions that benefit everyone.
Historic patterns in discriminatory land use practices elicit environmental injustice
American Indian displacement and genocide
American Indian people have historically been and currently are strong leaders in the environmental justice movement, with land, water, and air protectors at the forefront of many contemporary environmental justice movements and actions. Many American Indian values and traditional ecological knowledge serve as the basis of environmental justice values and principles.
American Indian communities have and continue to face environmental injustices. American Indian communities and Tribal lands have been burdened by industrial developments such as nuclear energy and waste facilities and destruction of native ecosystems. Anti-American Indian sentiment compounded with lack of transparency and meaningful engagement has resulted in the desecration of American Indian and Dakota sacred sites in the region.
American Indian Tribes, communities, and people continue to lead environmental justice movements in response to ongoing harm and grounded in longstanding kinship with the land. Their land stewardship practices and relationship with land are important to honor, but not co-opt, in environmental justice practices.
Environmental racism from racial covenants, redlining, and zoning
Black, American Indian, and people of color communities are historically disinvested and have less access to green spaces, parks, and other environmental amenities. Today, historically white and affluent areas still have more access to green spaces and are likely less impacted by urban heat island effects.
Redlining depressed property values, and this now-cheaper land was desirable for industries. Some redlined areas had previously existed near heavily polluting land uses, but with the advent of these distinct low-land-value areas, more industrial land uses moved in.139 Redlining also influenced zoning laws. Racist zoning laws disproportionately targeted Black neighborhoods and placed hazardous waste facilities near predominantly Black communities and neighborhoods in the Twin Cities.140
Environmental racism141 takes the form of the cumulative and lasting impacts of redlining, racial covenants, and zoning. Redlining has made it difficult for Black, American Indian, and people of color households, especially Black households, to build generational wealth.142 Formerly redlined areas exhibit inequities in education, and residents often have less access to nutritious, affordable food because of food deserts. Redlining impacted access to green space and cool places based on race and income. This lack of green space exacerbates the impact of the urban heat island. The systemic barring of access compounded with lower quality social determinants of health creates environmental injustices.
Environmental injustices today: health, green space, and homes
All residents in our region will be affected by climate change, but we are not all affected in the same way. Those who are particularly vulnerable due to a range of historical, social, environmental, and economic factors have less ability to be resilient to climate change impacts.143 The effects of environmental racism, compounded with climate change and pollutants, affect access to affordable, dignified housing. Proximity to pollution creates a negative feedback loop in the housing market. These ongoing issues related to land and air quality create a complex interplay in which areas with high levels of pollution and lack of green space also have lower land value. These areas are more affordable for both industrial users and residential communities, creating a feedback loop in which people seeking affordable places to live are continuously exposed to land uses that bear significant health burdens.
The United States has a history of ongoing environmental racism, with our seven-county region being no exception. The Minnesota Department of Health cites “institutional systems including city planning, infrastructure, and policies that have led to disparities in local source pollution” as systemic inequities.144 To measure the disparities, the health department identifies five community characteristics that correspond with these social determinants of health: health care access and quality, neighborhood and built environment, social and community context, economic stability, and education access and quality.145
Areas with lower access to health care, higher pollution, and higher percentages of the identified social determinants of health “have a substantially higher rate of negative health impacts, approximately three to four times greater for all outcomes.”146 In addition to health issues related to air quality, low-income communities and communities of color in the Twin Cities are also more likely to be exposed to traffic noise levels. The health department states that in the Twin Cities, “zip codes with the largest percentage of [residents of color] had more than five times the rate of asthma emergency room visits related to air pollution compared to areas with more white residents.”147
Inequitable access to green space
Green spaces provide benefits for people that improve mental well-being and physical health and foster a community.148 Valuable environmental services such as flood management and air pollution control are also provided depending on the type of green spaces that are present. These benefits and services improve the lives of people that live nearby and manage the physical environment. Ingrained and persisting environmental injustices have led to unequal access to green spaces for everyone. This has resulted in low-income and communities of color having a lack of green space access.
Wealth is directly correlated with green space access and people who have low incomes are located farther away from parks than those with more income.149 Another study revealed that even when physical green space access is present, communities of color tend to have smaller green spaces compared to white neighborhoods.150 These disparities have led to inequitable access to benefits of green spaces. Negative health implications and risks are worsened because of historic disinvestment of green spaces in these overburdened communities.
Green spaces that provide ecosystem services often yield higher quality positive outcomes for residents.151 For example, a regional park with diverse wildlife can improve mental health better than a field of turfgrass. Green space access should not be just limited to quantity but also quality. Increasing physical access to a green space is important, but so is the quality of the green space so that people can enjoy it to their utmost and preference. By centering the benefits of these green spaces and park projects on overburdened communities, the Met Council can work to rectify past policies and practices to improve the well-being and health of all residents, and especially the most overburdened ones.
Homes that are less resilient to climate change
As Minnesota experiences a warmer and wetter climate,152 disinvested and aging homes face challenges in mitigating climate hazards and enabling resilient neighborhood recoveries. Homes within historically redlined neighborhoods are already more likely to be close to polluters153 and within urban heat islands.154 With increased heat and precipitation, energy inefficient homes or homes that are in areas of older stormwater systems155 face greater risks from unhealthy temperatures and inland flood damage. Low-income households are more likely to live in older homes with lead, making children in poverty more likely to be exposed to lead.156 Appropriate building modifications to ensure safe and efficient homes may pose upfront economic burdens for low-income households and homeowners.
Social cohesion and social networks are important to neighborhood resiliency after extreme weather events. Weak and fractured social connections within unsafe, unwalkable, unconnected, and underinvested neighborhood spaces make it difficult to form systems of community support and aid. Historical and ongoing housing disinvestment threatens the connections and relationships vital to neighborhood resiliency.
Environmental justice terms in other planning and community contexts
Black and American Indian communities organized the environmental justice movement to address environmental racism from both government action and neglect starting in the 1960s. The 17 principles of environmental justice157 adopted at the 1991 People of Color Environmental Leadership Summit in Washington, D.C., guide the holistic environmental justice movement, including the movement’s leaders, languages, philosophies, actions, and solutions. The environmental justice framework is rooted in the guiding values of this grassroots movement.
There are many terms for communities centered in environmental justice, ranging from “environmental justice communities” used in grassroots spaces, “environmental justice areas.”158 used by the Minnesota Pollution Control Agency (MPCA), to “Low-Income Disadvantaged Communities” (LIDAC),159 used by the Environmental Protection Agency’s (EPA’s) Climate Pollution Reduction Grants Program. State legislation currently defines “environmental justice areas” as areas with the following census tract conditions:
- At least 40% people of color
- At least 35% households with income at or below 200% of the federal poverty level
- At least 40% population with limited English proficiency
- Located in federally recognized reservations and other Indigenous lands.
Imagine 2050 uses “overburdened communities” to center people along with a geographical component of environmental justice. Implementation of various environmental justice-related grants, policies, and actions requires incorporating other agencies’ people- and place-based considerations. Definitions are subject to being refined and adapted.
Structure of the environmental justice framework
The Met Council’s environmental justice framework is rooted in its equity framework. The components of the equity framework are overarching principles of environmental justice. Environmental justice frames these principles in the context of people and their relationship to their environment, including land, air, soil, water, plants, and animals. Components of the framework may overlap and occur concurrently.
Figure 3.3. Grounding concepts of the environmental justice framework
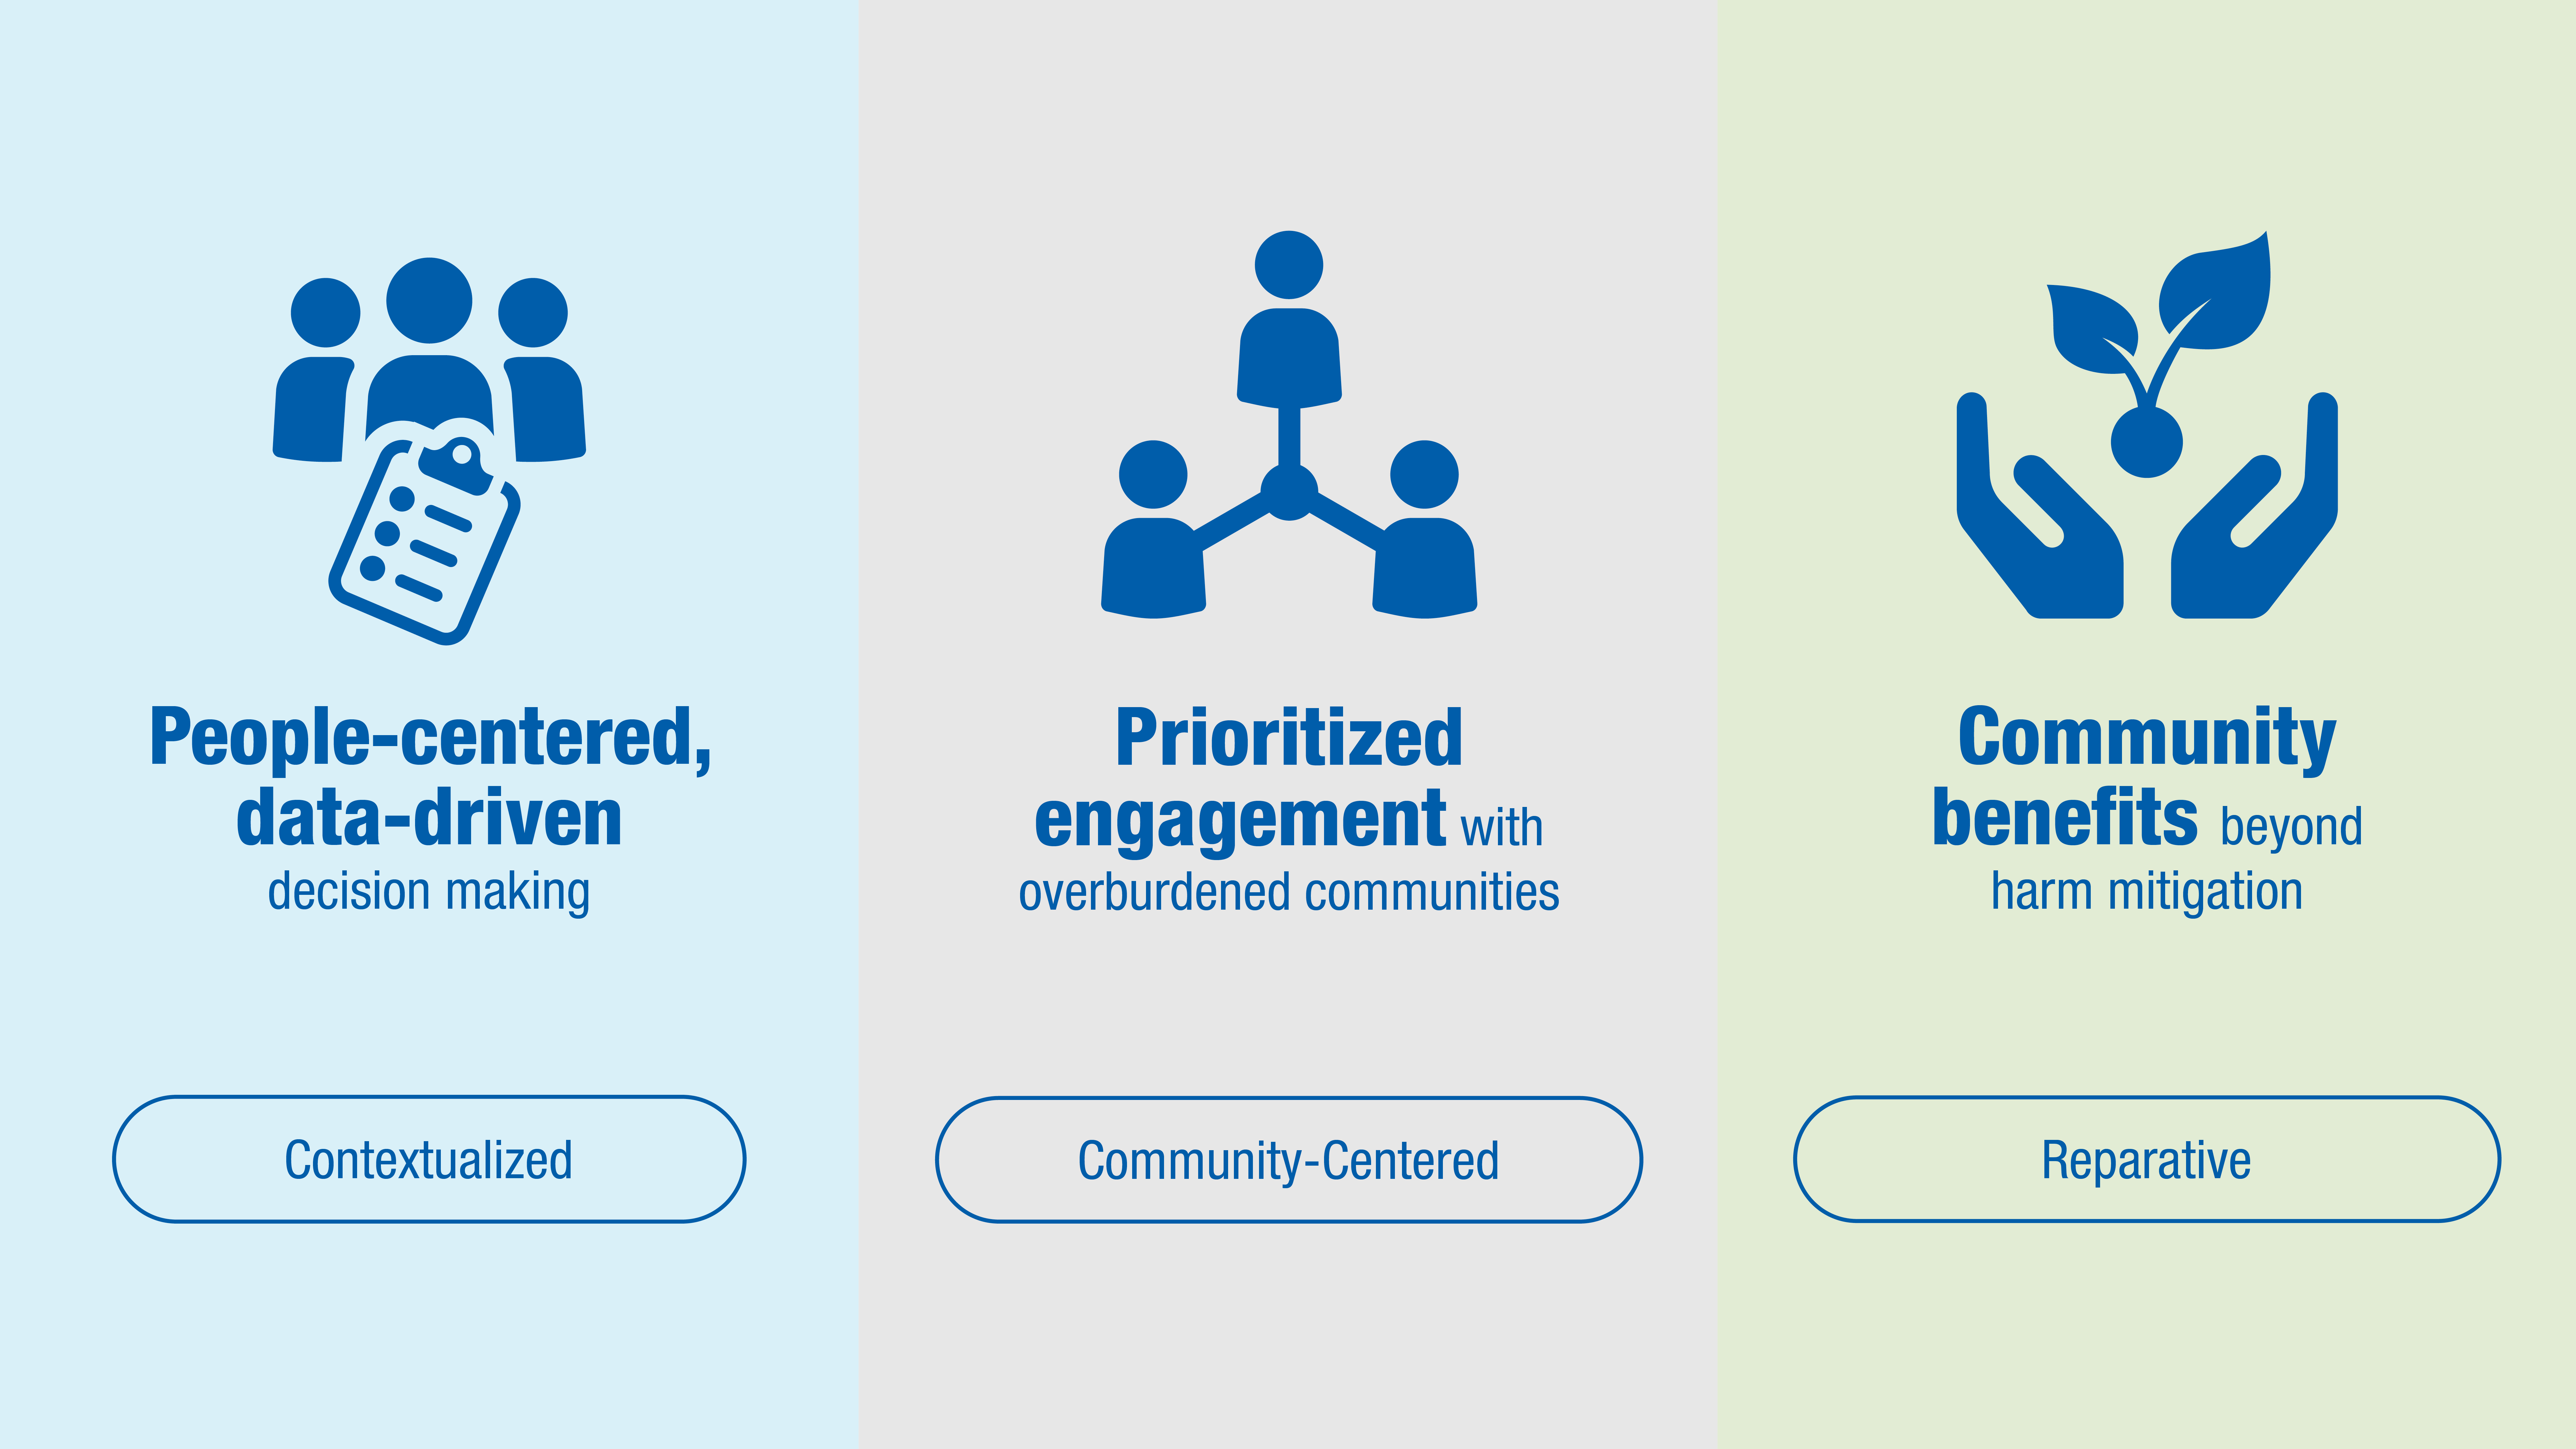
Contextualized data: people-centered, data-driven decision making
The first component is using data to inform decision-making. Quantitative and qualitative data provide important geographical and community-based context. Just and fair decision-making processes include understanding the environmental history and present experiences relevant to overburdened communities and integrating such history with data. Quantitative data such as pollution exposure, respiratory disease rates, and cumulative impacts must be monitored and reported. Qualitative data should be shared broadly across and within the region to lessen the impact of repeated requests for engagement with overburdened communities.
Community-centered relationships: prioritized engagement with overburdened communities
This component means transforming community engagement processes towards reparative, respectful relationships with communities. A shift to co-creating solutions – particularly with the most overburdened and vulnerable communities – requires identifying and addressing the internal barriers that prevent government agencies from systemic change. This involves fostering relationships that support and build community capacity and autonomy as an empowered partner with government agencies. Engagement must begin early in project processes, be iterative, and allow time for communities to give informed input. This relationship-building also requires sustained staff capacity. Furthermore, engagement processes must continue after projects, with respect to community capacity and their preferences as to how to remain engaged. Overburdened community members must be respected and valued as subject matter experts on their experiences and compensated for their time and effort as they deem appropriate.
The Met Council must also continue to collaborate with other government partner agencies. This means using Met Council influence to ensure partner agencies are working together to demonstrate environmental justice values, explicitly looking for environmental justice connections in partner agencies’ work and convening partner agencies to develop a shared understanding of environmental justice and related work throughout the region.
Reparative outcomes: community benefits beyond harm mitigation
Current environmental regulations focus solely on harm mitigation; this framework component involves prioritizing and maximizing environmental benefits to the most overburdened communities, especially where legal requirements insufficiently address regional and community concerns. Maximizing benefits and addressing community concerns are a form of reparative justice. It involves establishing practices that maximize environmental benefits by involving communities in the selection and/or prioritization of benefits rather than solely mitigating harms. Benefits and investments from the Met Council work, and regional policies and actions resulting from Imagine 2050, must meet a community’s self-identified needs, appropriately address community concerns, and provide community benefits in co-creation alongside community.
Conditions for success
Environmental justice is as much a process as an outcome. To better understand the impact of environmental justice implementation, there are three conditions for success the region and its policies must fulfill to successfully apply the environmental justice framework. The conditions for success are:
- Expand the scope of measuring the efficacy of projects in region through a broad environmental justice lens.
- Build upon current structures and processes to define environmental justice as a necessary and explicit component of the region’s work.
- Add overburdened community values to reconcile regional government systems and plans with environmental justice outcomes.
Environmental justice at the Met Council
The Met Council follows federal requirements that integrate environmental justice principles, such as Title VI requirements,160 Justice40 initiatives161 and EPA requirements. Two executive orders that support environmental justice: Executive Order 12898, Federal Actions to Address Environmental Justice in Minority and Low-Income Populations, and Executive Order 14096, Revitalizing Our Nation’s Commitment to Environmental Justice for All. The Met Council largely conducts place-based work, and Title VI and environmental justice requirements set a baseline for defining geographies of communities most overburdened by climate change and EJ issues. The Met Council will use a people-based approach to our place-based work by recognizing affected populations and geographies.
The Met Council’s environmental justice framework is built upon existing work. The Met Council’s Climate Action Work Plan sets a direction for environmental justice in our operations and planning. We received a federal Climate Pollution Reduction Grant in 2023. Staff have compiled and analyzed regional data for the grant‘s required Preliminary and Comprehensive Climate Action Plans with climate disparities data.
Assessment and commitments
Environmental justice-related benchmarks and metrics must be established, documented, and publicly reported. Commitments identified in the Climate Action Work Plan helped set a foundation for actualizing environmental justice work in Imagine 2050. The climate work plan makes regional commitments to improving health, supporting community values, organizational accountability, implementing strategies for climate adaptation, land stewardship and improving access to resources for overburdened communities.
These commitments will serve as assessment criteria for evaluating plans, policies, and procedures with an environmental justice lens. To realize environmental justice goals at the implementation level, Met Council evaluation processes will identify local concerns (contextualized), build on local priorities (community-centered), and add benefits beyond harms (reparative) in a project cost-benefit process.
Commitments
- The Met Council commits to improving mental and physical health outcomes through our planning and project work for historically and presently overburdened communities, which include low-income communities, Black, American Indian, and communities of color, disabled, aging, and immigrant and refugee communities.
- We will uphold and advance the fundamental human and nonhuman right to clean, healthy and adequate air, water, land, transportation, and housing.
- We will advance economic justice so that overburdened communities are prioritized in the benefits of our plans and projects and are protected from any potential negative consequences.
- We commit to elevating the voices of overburdened communities by strengthening resources and respecting the abilities that overburdened communities have to survive, adapt, and thrive.
- We will deliberately and respectfully honor cultural relevance and history to maintain cultural heritage from the past and present for the benefit of all generations, paying particular attention to self-told narratives from Black, American Indian, and communities of color.
- We commit to being accountable for our actions and to listen and learn from overburdened communities and support their capacity to partner with government agencies.
- We commit to promoting climate strategies that enhance the ability of overburdened communities to adapt to the impacts of climate change.
- We will evaluate and integrate cumulative impacts on communities that are affected by multiple ongoing climate and health-related issues into decision making.
- We commit to advancing strategies that ensure holistic land stewardship, and to respect the inherent value of the natural world as well as the land’s role in nourishing the human community.
- We commit to supporting access to jobs, housing, transportation, funding, education, healthy foods, and a clean environment for overburdened communities.
- We commit to removing barriers that prevent overburdened communities from accessing services and meaningful involvement through infrastructure, policy, and investments.
"You tore up my neighborhood where I grew up in, and I don't recognize it anymore."
-Metropolitan Center for Independent Living Participant
Anti-displacement framework
This anti-displacement framework includes a definition and strategies to mitigate the inequitable consequences of public investment on neighborhoods. The framework assesses and reviews processes in public policy planning, including engagement, but may also be used during or after project or policy implementation, such as in evaluation. The anti-displacement framework provides guidance on how to integrate anti-displacement strategies into the practices and policies set by Imagine 2050.
As the region works to become more equitable, implementing an anti-displacement framework is necessary. This framework lays the groundwork for understanding who benefits and who is harmed by development, policies, and investments in the region. It can also shed light on the Met Council’s impact on the region. Though displacement is, ultimately, defined by residents, it can mean a physical and involuntary, often violent, loss of one’s home, community, or access to resources. It can be an economic, social, or cultural change, removal, or the loss of sense of belonging in one’s community. Displacement can happen before or after development or other community changes occur and can impact an individual’s physical and perceived safety in their community. The Met Council and its partner agencies have a responsibility to prevent, mitigate, and respond to displacement of communities of color and low-wealth communities most impacted.
The Met Council’s equity framework is the foundation for all anti-displacement efforts. Anti-displacement policies build on the equity framework of being community centered, contextualized, and reparative. The anti-displacement strategies center overburdened communities that include Black communities, American Indians, people of color, and low-income populations or communities that may experience disproportionate environmental harms and risks. This acknowledges that these communities have historically been exposed to an accumulation of negative – and lack of positive – environmental, health, economic, or social conditions within their populations or communities.
Regional history of displacement and segregation
Historically, our region has experienced displacement in many forms. The first peoples living on this land, the Dakota People, faced violent removal and genocide at the hands of early European settlers. This initial displacement of American Indian Tribes across the state continues to be erased from history while impacting communities to this day. Today, displacement risks and inequities reflect the long history of atrocities including discriminatory federal and local policies, intimidation, and violence that has led to the displacement and ongoing erasure of American Indian Tribes, Black communities, people of color, and immigrant communities and cultural sites. These harmful outcomes were and continue to be impacted by past regional and national policies and practices.
Throughout the 1900s, practices leading to displacement and segregation included the use of racial or ethnic restrictions on housing deeds, redlining, discriminatory lending practices, the destruction of communities from the development and construction of highways, and other urban planning decisions. Many formal policies and informal practices expanded opportunities for white residents and built deep racial and socioeconomic inequities for Black, American Indian, and people of color communities and low-wealth communities. Intensifying the effects of formal policies has been the behaviors of white residents. These include local racial intimidation and violence against Black, American Indian, and people of color residents in majority-white cities in the region (“sundown towns”) and the migration of white residents out of neighborhoods as more diverse communities moved into neighborhoods that they had previously been excluded from (“white flight”).
Met Council investments and displacement
In recent decades, Met Council-led transportation developments, housing investments, projects resulting from grant awards, wastewater treatment plant construction, and green gentrification around parks have caused the displacement of communities, cultural sites, and thriving cultural networks. Historically, investment decisions have failed to incorporate anti-displacement strategies and mitigation tools in collaboration with communities most affected. The Met Council has also played a direct role in the disinvestment of vital infrastructure as a decision-making body, determining which communities have equitable access to funding, amenities, homes, opportunities, and stable communities. This led to disparate outcomes across the region.
The Met Council acknowledges its role in the region’s history of displacement, systemic racism, and inequities caused by the agency’s decisions, investments, policies, and racial prejudice. These actions unjustly harmed the Dakota and American Indian people, Black communities, people of color, low-income, and immigrant communities. There have been some efforts to prevent displacement on specific regional projects. However, there is a need for a more coordinated and centralized approach to ensure transparency and accountability for all regional investments and actions.
Conditions for success
Anti-displacement efforts are an active process of centering and empowering communities to protect their homes, access to resources, and sense of belonging from loss due to an investment or policy. To prioritize those most impacted by displacement and reduce harm, key components of anti-displacement for regional policies, processes, and systems should include the following conditions for success:
- Preservation and strengthening of existing cultural connection
- Creation and strengthening of community inclusiveness
- Justice-centered; repairing historical injustices and empowering overburdened communities to co-create best practices and actions to remedy historic and ongoing harm
- Prioritizing the well-being of overburdened communities that are most impacted by displacement
Structure of the anti-displacement framework
The objective of the anti-displacement framework is to enhance residents’ ability to keep their housing, amenities, health, and sense of belonging in a neighborhood. To achieve this objective, the Met Council has identified three strategies to implement this framework:
Figure 3.4. Anti-displacement framework strategies
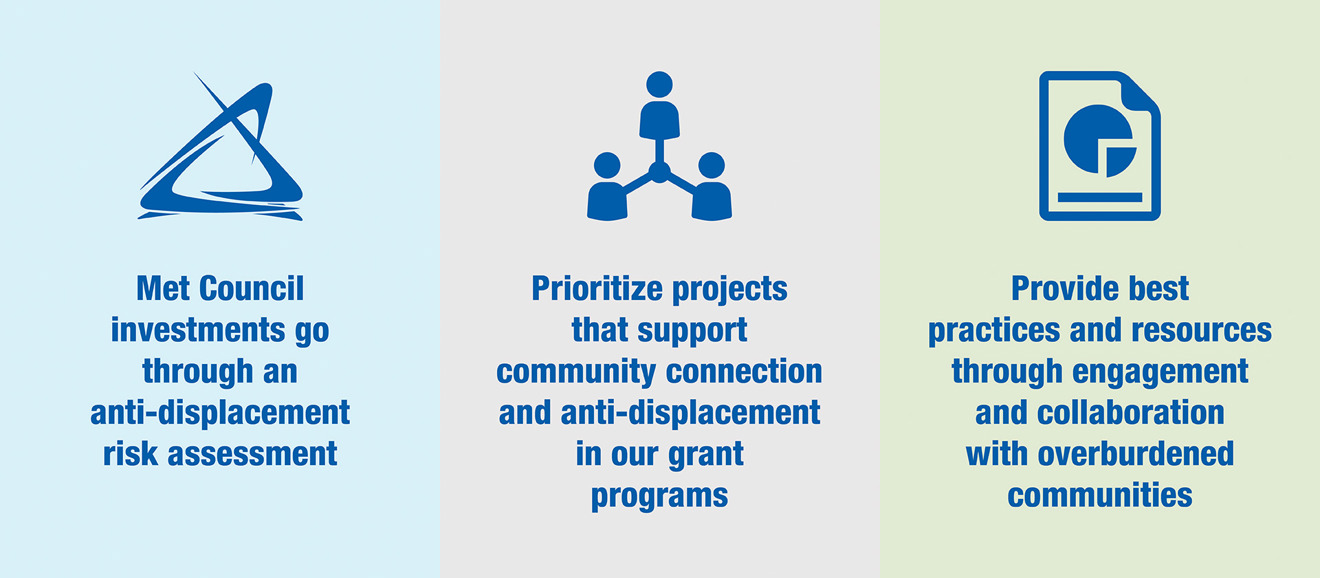
- Met Council investments go through an anti-displacement risk assessment.
-
- Identify and be transparent about potential impacts of our investments.
- Use qualitative and quantitative data to provide context and center resident experiences in the area.
- Address community concerns not currently accounted for in Met Council processes.
-
- Prioritize projects that support community connection and anti-displacement in our grant systems.
-
-
- When possible, include prioritization in investments for projects that increase community connection, minimize displacement, are justice-centered, or focus on place-based investments.
- Work with each division to integrate this framework into grant programs.
- Continue to prioritize the development and preservation of deeply affordable housing across the region to allow residents to remain in their homes.
-
-
- Provide best practices and resources through engagement and collaboration with overburdened communities.
-
-
-
- Continue to work with community partners to co-create best practices for mitigating displacement.
- Build reparative and respectful relationships with community partners.
- Share qualitative and quantitative data as well as technical assistance among local governments.
- Collaborate and align best practices with partners around the region.
-
-
Community-centered engagement
Community-centered engagement intentionally puts people first and centers community perspectives in the process of Met Council decision-making. It supports the equity framework by addressing the conditions of success in the following ways:
- Leading with race: Community-centered engagement intentionally prioritizes engagement with overburdened communities.
- Action-oriented: Community-centered engagement includes intentional actions to highlight and amplify best practices, to address systemic inequities, and to identify policy changes that either limit or inhibit community voices.
- Address the historical context: Community-centered engagement provides space to identify and address historic and ongoing injustice. It also partners effectively with community in structuring engagement that builds capacity and meaningfully involves community in ways that repair historical harms and combat extractive practices.
- Share power: Community-centered engagement prioritizes co-creation with community and intentionally integrates co-created solutions sustainably into decision-making and implementation processes.
Community voices shaped the Met Council’s Public Engagement Plan, created in response to the equity commitments in Thrive MSP 2040. Since that time, community voices and the experience of our public processes have identified ways to more intentionally imbed principles of equity and inclusion into engagement and decision-making processes – namely recognizing historical patterns of injustice and exclusion, and the impact of unilateral decision-making. Imagine 2050 advances previous engagement policy in several specific ways:
- Centering community voices in regional processes
- Partnering with community as co-creators
- Committing to shared agenda-setting
- Investing in community capacity-building
- Focusing on assets in community and the value community voices bring to regional processes
- Prioritizing overburdened communities in engagement
Imagine 2050 principles of public engagement
Principles of the Imagine 2050 public engagement plan include:
- Equity: Residents and communities are partners in decision-making.
- Respect: Residents and communities should feel heard and their interests included in decisions.
- Transparency: Residents and communities should be engaged in planning and decisions should be open and widely communicated.
- Relevance: Engagement occurs early and often throughout a process to assure the work is relevant to residents and communities.
- Accountability: Residents and communities can see how their participation affects the outcome; specific outcomes are measured and communicated.
- Collaboration: Engagement involves developing relationships and understanding the value residents and communities bring to the process. Decisions should be made with people, not for people.
- Inclusion: Engagement should remove barriers to participation that have historically disengaged residents and communities.
- Cultural competence: Engagement should reflect and respond effectively to racial, ethnic, cultural and linguistic experiences of residents and communities.
Updated practices more reflective of a community-centered approach to engagement will be included and expanded upon in implementation of Imagine 2050. For example, the Met Council has established Tribal relations policies – including formal government-to-government consultation, staff involvement, and community engagement expertise. The Met Council will update and continue to evolve its practices, policies, and procedures with the American Indian communities, including education of any changes to ensure implementation, as part of Imagine 2050 commitments. The Met Council also updated our interpretation of the public purpose doctrine to include incentives and compensation for engagement and community expertise. These examples highlight the impact established systems, policies, and procedures have on relationships with communities and people throughout the region.
Community-centered engagement takes intentional actions to honor community expertise, addresses inequity by integrating and compensating the value of community expertise, and prioritizes processes that invite community participation and partnership. It recognizes a full spectrum of connection with community voices, from informing to co-creation. It ensures all people are represented in decision-making and that the weight of feedback from community is proportional to the impact a decision has on communities. Community-centered engagement represents a fundamental commitment to addressing equity in community engagement.
Commitments
The following are the commitments to implementing a Community Centered Engagement approach in the projects, processes, and planning of the Met Council:
- Work to intentionally build trust with communities through Community-Centered Engagement.
- Build and sustain relationships, even outside of discrete projects.
- Co-create solutions and define clear roles for partnership and implementation.
- Act with transparency in practice and implementation.
- Dedicate financial resources, such as individual projects and division budgets, that support centering engagement across all our work.
- Measure effectiveness, coordinated with other regional indicators and based on standards defined by communities experiencing inequities.
- Recruit for advisory committees (and other appointments) in a way that results in participants and members who are representative of the region’s diverse population.
- Continue to evolve, prioritize, and fund activities that aim to increase meaningful participation among people who do not participate in conventional engagement activities like public meetings, public hearings, and formal public comment processes.
To implement Met Council commitments to the people of this region, the following community-centered engagement policies and actions are intended to implement the goals of Imagine 2050.
Policy
- The Met Council will compensate community members for offering their lived experiences and perspectives to inform Met Council decision-making.
- Engagement efforts with communities affected by a decision will be intentionally planned with those communities. Engagement activities will meet communities where it is most convenient and effective for them to participate. Engagement activities will occur prior to a decision, to ensure communities have a tangible impact on decisions.
- We will intentionally partner with communities to plan and execute engagement efforts. We will prioritize activities with and resources for overburdened communities. Partnership involves shared agenda-setting, shared expectations, shared outcomes, and compensation.
- Engagement activities will reflect the eight principles: equity, respect, transparency, relevance, accountability, collaboration, inclusion, and cultural competence.
Actions
- Continue to advance legislative initiatives to remove the prohibition of compensation for participation in Met Council advisory committees.
- Highlight and implement best practices in government and nonprofit engagement. Create case studies and convene conversations to lift up community examples and shift understandings of community expertise and power. Clarify relationships with and across levels of government to enhance coordination and reduce duplication and fatiguing community.
- Establish specific expectations related to project and program budgeting, to explicitly call out funds and resources for community engagement.
- Identify expectations for co-creation activities and create, in coordination with community experts, a framework for partnership and co-creation.
- Create a tool, in partnership with community experts, to assess and measure effectiveness of community-centered engagement in including voices and addressing equity.
- Invest in and support training and skill-building activities to build capacity for engaging community among Met Council and local government staff.
- Engage community voices in validating engagement principles, defining what it means to center voices in processes, and clarifying what transparency and accountability mean in community.
- Support, through technical assistance, local governments to create more community-centered engagement processes. Identify incentives for innovation in community-centered engagement practices.
The illustration below (Table 3.1) highlights an engagement spectrum that pairs elements of the spectrum championed by the International Association for Public Participation (IAP2) with ways the community-centered engagement framework proposes to apply that spectrum. The spectrum identifies activities and roles with less impact to community members on the left and more impact to community members on the right.
| Inform | Consult | Involve | Collaborate | Co-create / Co-lead | |
| Impact | One-way communication | Provide access | Provide access, respond | Partner, address inequity, build capacity | Share power, share agenda, change systems |
| Participation Goal | Inform, educate about problem and potential solutions | Gather feedback and reflect concerns and interests | Work directly with people throughout the process and include concerns, ideas | Partner with constituencies in defining problems, developing alternatives, choosing solutions | Community, constituents have final decision-making power |
| Promise to Community | “We will keep you informed.” | “We will keep you informed, listen to concerns and feedback, demonstrate how feedback influenced decision.” | “We will work with you to ensure concerns and desires are reflected in the alternatives developed and demonstrate how feedback influenced the decision.” | “We will seek your advice and innovation, and include your advice and recommendations in decisions to the greatest extent possible.” | “We will set the agenda together and decide together. We will implement those shared decisions.” |
| Sample Activities | Fact sheets Web sites Email newsletters Open houses |
Public comment Surveys Public meetings |
Workshops Working/ advisory groups Deliberative polling |
Shape strategies Influence agenda setting |
Direct agenda- setting Direct decision-making Establish expectations |
Community-centered engagement case study
During the development of Imagine 2050, the Met Council convened an American Indian Advisory Council. The effort represents one form of community-centered engagement in the Imagine 2050 process. The Advisory Council, described in more detail later in this section, met 13 times in 2024 to engage deeply with Met Council staff and develop recommendations for regional policy. Advisory Council members were compensated for their participation.
From the first meeting, Advisory Council members were collaborators in the agenda and process. Using a meeting structure of an inside-outside circle, meetings started with Advisory Council members sharing thoughts and reflections. During the first meeting, Advisory Council members advocated that the Met Council should make commitments to action before developing an acknowledgement statement. This recommendation guided the Advisory Council’s process.
Staff from each policy area of Imagine 2050 attended Advisory Council meetings. Discussions focused on areas where recommendations from the Advisory Council could impact Met Council policy and action. Throughout the process, transparency, relevance, and accountability were emphasized. Both the Advisory Council and staff understood that the Advisory Council’s recommendations needed to reflect community interests and be achievable within Met Council authority and influence.
Honest collaboration over many months helped build respect between Met Council staff and Advisory Council members. The Met Council understands that further developing trust relies on following through on the recommendations of the Advisory Council. The Advisory Council will continue to meet to support implementation of Imagine 2050 and maintain a relationship of collaboration and accountability.
Land, water, and people acknowledgment and Met Council commitments to act
Indigenous people are the first people of this country. The land we all occupy in the seven-county Twin Cities region is historic and contemporary Dakota land taken from an innocent population by force through intentional genocide and broken treaties. As of the 2020 Census, the Twin Cities region has approximately 72,000 American Indian residents.162 American Indians consistently have the worst disparities in income,163 health,164 and education165 and higher rates of homelessness166 than any other vulnerable population or racial group in the region. The effects of systematic genocide persist in the perceived invisibility of the modern American Indian population despite the robust, connected, and vibrant community that lives within the seven-county region.
American Indians have inherent sovereignty and are a political group, not a racial group. Sovereignty necessitates a government-to-government relationship and as a government agency, requires the Met Council not only to take responsibility but to take action to repair harm. Sovereignty requires a different type of commitment, respect, and response. The Met Council is compelled to action to address not only historic harm, but harm the Met Council itself has perpetuated through ongoing investment, occupation and control of sacred sites, discriminatory policies, and long-standing systems that support historic bad actions.
Methodology
To acknowledge the historic harm that American Indian people in this region have survived, the Met Council established an American Indian Advisory Council to co-create a land, water, and people acknowledgment along with recommendations for Met Council commitments to action. The Advisory Council included highly respected members of the American Indian community in this region. Members represented Dakota, Ojibwe, Ho-Chunk, and Lakota communities and ranged from youth advocates to community elders.
The Advisory Council met 13 times starting in March 2024. The structure of each meeting employed an Inside-Outside Circle format in which the Advisory Council members spoke first and led conversations while Met Council staff listened, took notes, and shared meeting summaries. Early in the process, the Advisory Council recommended that Met Council commitments to action would be more valuable and impactful than a land acknowledgement. The Advisory Council then met with Met Council staff from each regional policy area to understand Met Council roles and responsibilities and develop effective recommendations for commitments.
Commitments
The Advisory Council presented recommended commitments to the Met Council in September. Recommended commitments covered a wide range of Met Council work and highlighted the opportunities for organizational, operational, and policy change. Recommended commitments were developed for the Met Council overall as well as for each policy area.
- An overarching recommended commitment stated that the Met Council should lead in publicly recognizing the genocide and displacement that American Indian communities survived and continue to endure. One aspect of meeting this commitment is the inclusion of the Land, Water, and People Acknowledgement Statement at the beginning of Imagine 2050. The Acknowledgement Statement was written by the Advisory Council and presented to the Met Council with recommendations for use. The Met Council will determine the final uses of the statement including when it will read a statement at official Met Council meetings and where the full statement will be used such as at facilities, in its plans and resources, and on the Met Council website.
- From their first meeting, the Advisory Council clearly affirmed that an acknowledgement statement alone is not enough. The Advisory Council put together recommendations for the Met Council’s organization and culture. These commitments include updating the Met Council’s Tribal Consultation Policy, increasing American Indian staff representation, and developing training materials for internal staff and regional partners. Actions to address these recommendations are led by the Regional Administration leadership. Additionally, the Met Council commits to reporting annually to the American Indian Advisory Council on its progress towards meeting its commitments.
The Advisory Council also created recommended commitments for each policy area and many of those commitments are included in each policy plan. A summary of the commitments is included below, with more detail found in each of the policy chapters.
In the Regional Parks and Trails Policy Plan, a new subclassification for Cultural Landscapes will allow regional parks agencies to recognize and protect land of significant cultural value to American Indian Tribes. Lands in this subclassification are not required to be open for recreation, and the designation will help visitors understand the significance of the landscape. The Met Council will work with partners including American Indian organizations to further refine the new classification. Additionally, the policy work plan includes an action to partner with American Indian organizations and parks agencies to create an inventory and guidelines for harvesting edible plants and develop a cultural inventory requirement for long-range planning.
In the Transportation Policy Plan, one policy focuses on engaging with underrepresented communities in policy, planning, and project development for transportation infrastructure. One action within this policy directly addresses the Advisory Council’s recommendations. It specifies providing guidance around the best practices for Tribal engagement in transportation projects and identifying opportunities to document the full, equal, and effective participation from Tribal Nations.
The Land Use Policy includes actions to formalize an American Indian Advisory Council to address implementation of Imagine 2050, work with Tribal nations and American Indian partners to develop regional tools that benefit local planning practices and explore the establishment of a reparative actions fund to finance mitigation efforts for past harms including to American Indian communities. These actions all reflect recommendations from the Advisory Council.
In the Water Policy Plan, the Met Council holds that water is a human right and commits to building trust with Tribal Nations and Tribal communities by amplifying and honoring Indigenous values, perspectives, and experiences to collaborate on solutions that ensure sustainable and equitable water for the region. The orientation and direction of the Water Policy Plan will help address the Advisory Council’s recommendation that the Met Council advocate for a new political imagination for water policy and standard that integrates a framework of water as a relative.
The Housing Policy Plan includes actions to address the Advisory Council’s recommended commitments focused on increasing housing access and reducing homelessness in the American Indian communities. The plan commits the Met Council to prioritize American Indian-led organizations when funding projects to address housing issues in American Indian communities and reach out to these organizations when funding through related partnerships becomes available. The plan also includes an action to partner with American Indian communities in targeted outreach about new housing voucher programs. Additionally, the plan addresses issues related to American Indian homeownership through actions to engage American Indian housing voucher holders in wealth building and homeownership programs and work with American Indian organizations to develop and distribute resources about existing American Indian homeownership programs. Finally, the plan states that the Met Council will explore including fair housing guidance specific to Tribal citizens as part of housing resources provided to local government seeking Livable Communities Act grants.
Recommended commitments from the American Indian Advisory Council emphasize key themes for changes to Met Council work. The Met Council has a role in setting the tone for the region when it comes to Tribal and American Indian relations. Showing leadership in recognizing harms and consistently implementing a Tribal consultation and American Indian community engagement policy will help build trust between the Met Council and Tribes and American Indian communities. Changes to organizational culture and operations need to be formalized so they do not depend on the support of individual staff or individual Met Council members. Making commitments and transparently reporting on progress will ensure the Met Council remains accountable as it builds and deepens relationships with Tribes and American Indian communities.
Ultimately, the Met Council’s actions reflect its understanding, promoted by the Advisory Council, that partnering with American Indian communities and Tribes brings value to all aspects of Met Council work as it works towards a region with abundant opportunities for all.

Safe and healthy communities for all residents are the bedrock of a flourishing region. This means residents enjoy not only accessible medical care, but also continued and expanded availability of nutritious and culturally desirable food, safe water, dignified and affordable housing, stabilized neighborhoods, opportunities for meaningful contribution, high-quality education and health care, time outdoors, clean air and water, accessible transportation, and digital connectedness.
"Don't forget to dream big and push for healthy living. Clean water and access to healthy food matters. We need to make these things accessible."
- Community Engagement specialist and disability advocate, St. Paul
This goal acknowledges the importance of social conditions, including welcoming, inclusive neighborhoods and freedom from violence and harassment. Positive emotions like happiness and a sense of dignity additionally support individuals’ health.167
Land use, water, parks, transportation, and housing policies can support diverse community types to create a region where residents live healthy and rewarding lives. Walking and biking infrastructure and access to green spaces have positive effects on physical and mental health. Pedestrians and cyclists can be protected as they travel around the region through transportation infrastructure decisions. Community design – including public buildings, commercial areas, transportation facilities, or recreation spaces - can be accessible and welcoming to people with disabilities and diverse cultural backgrounds, increasing a sense of dignity. Housing investments focused on creating stability, safety and decency can support rewarding lives and well-being, particularly when prioritizing residents with disabilities or facing housing instability and homelessness. Economic development focused on increasing wages and dignity offers improvements in health and well-being.168
Policies strive to address structural racism as the barrier to equitable health and safety. This includes the harms caused by unequal, segregated spatial distribution of resources, broken federal immigration policy, and intergenerational effects of trauma and economic exclusion.169 As government entities nationwide declared racism a public health emergency in the early 2020s, the American Public Health Association developed a framework to promote policies and practices to promote racial healing and address social inequities.170
The region is home to diverse community types. However, urban, suburban, and rural communities face shared land use-related health and safety challenges such as designs discouraging physical activity, pedestrian and bicyclist safety, and traffic injuries and fatalities.171 All communities have inadequate access to grocery stores and healthy food.172 Other barriers to community health and safety are more often found in specific communities. Rural areas and suburban communities experience more social isolation, loss of farmland, and contaminated water sources.173 Met Council partnerships with local public health and community organizations are essential to address context-specific land use-related health and safety challenges.
The Met Council elaborated this goal through reviewing how these issues were discussed in comprehensive plans, resident engagement, Met Council Member meetings, and Met Council advisory groups, as well as by drawing from national and international expertise. The goal of healthy and safe communities interacts with all other regional goals. Safety, physical and mental health, community connection and respect are needed to create an inclusive, equitable region. Residents need the health benefits of access to the outdoors and a clean environment. The region’s residents will be healthy and safe when underinvested communities have equitable access to resources to protect them from climate impacts. A dynamic and resilient region contributes to safety and a sense of dignity through providing choice, access, and affordability to all residents. The Met Council commits to continuously listening to stakeholders to understand how communities define these issues. Policies will be implemented using community definitions in meeting these goals.
Health and safety begin in communities
The health of the region’s residents depends on built and natural environments that support well-being as people live, learn, work, and play.174 Premature mortality, excess medical care costs, and lost labor market productivity due to racial and ethnic health inequities cost residents of color or residents without a college degree a staggering amount, estimated at over $4 billion (Figure 15).175 Policy initiatives focusing on closing health inequities create social and economic benefits to the region and its residents. People of color or without a four-year college degree are more likely to live in places with health risks due to the built environment.176 Health inequities based on race, ethnicity and educational attainment come from differential exposure to environmental risks, access to health care, and availability of socioeconomic opportunities.
Figure 4.1. Estimated economic burdens to the region's residents due to health inequities177
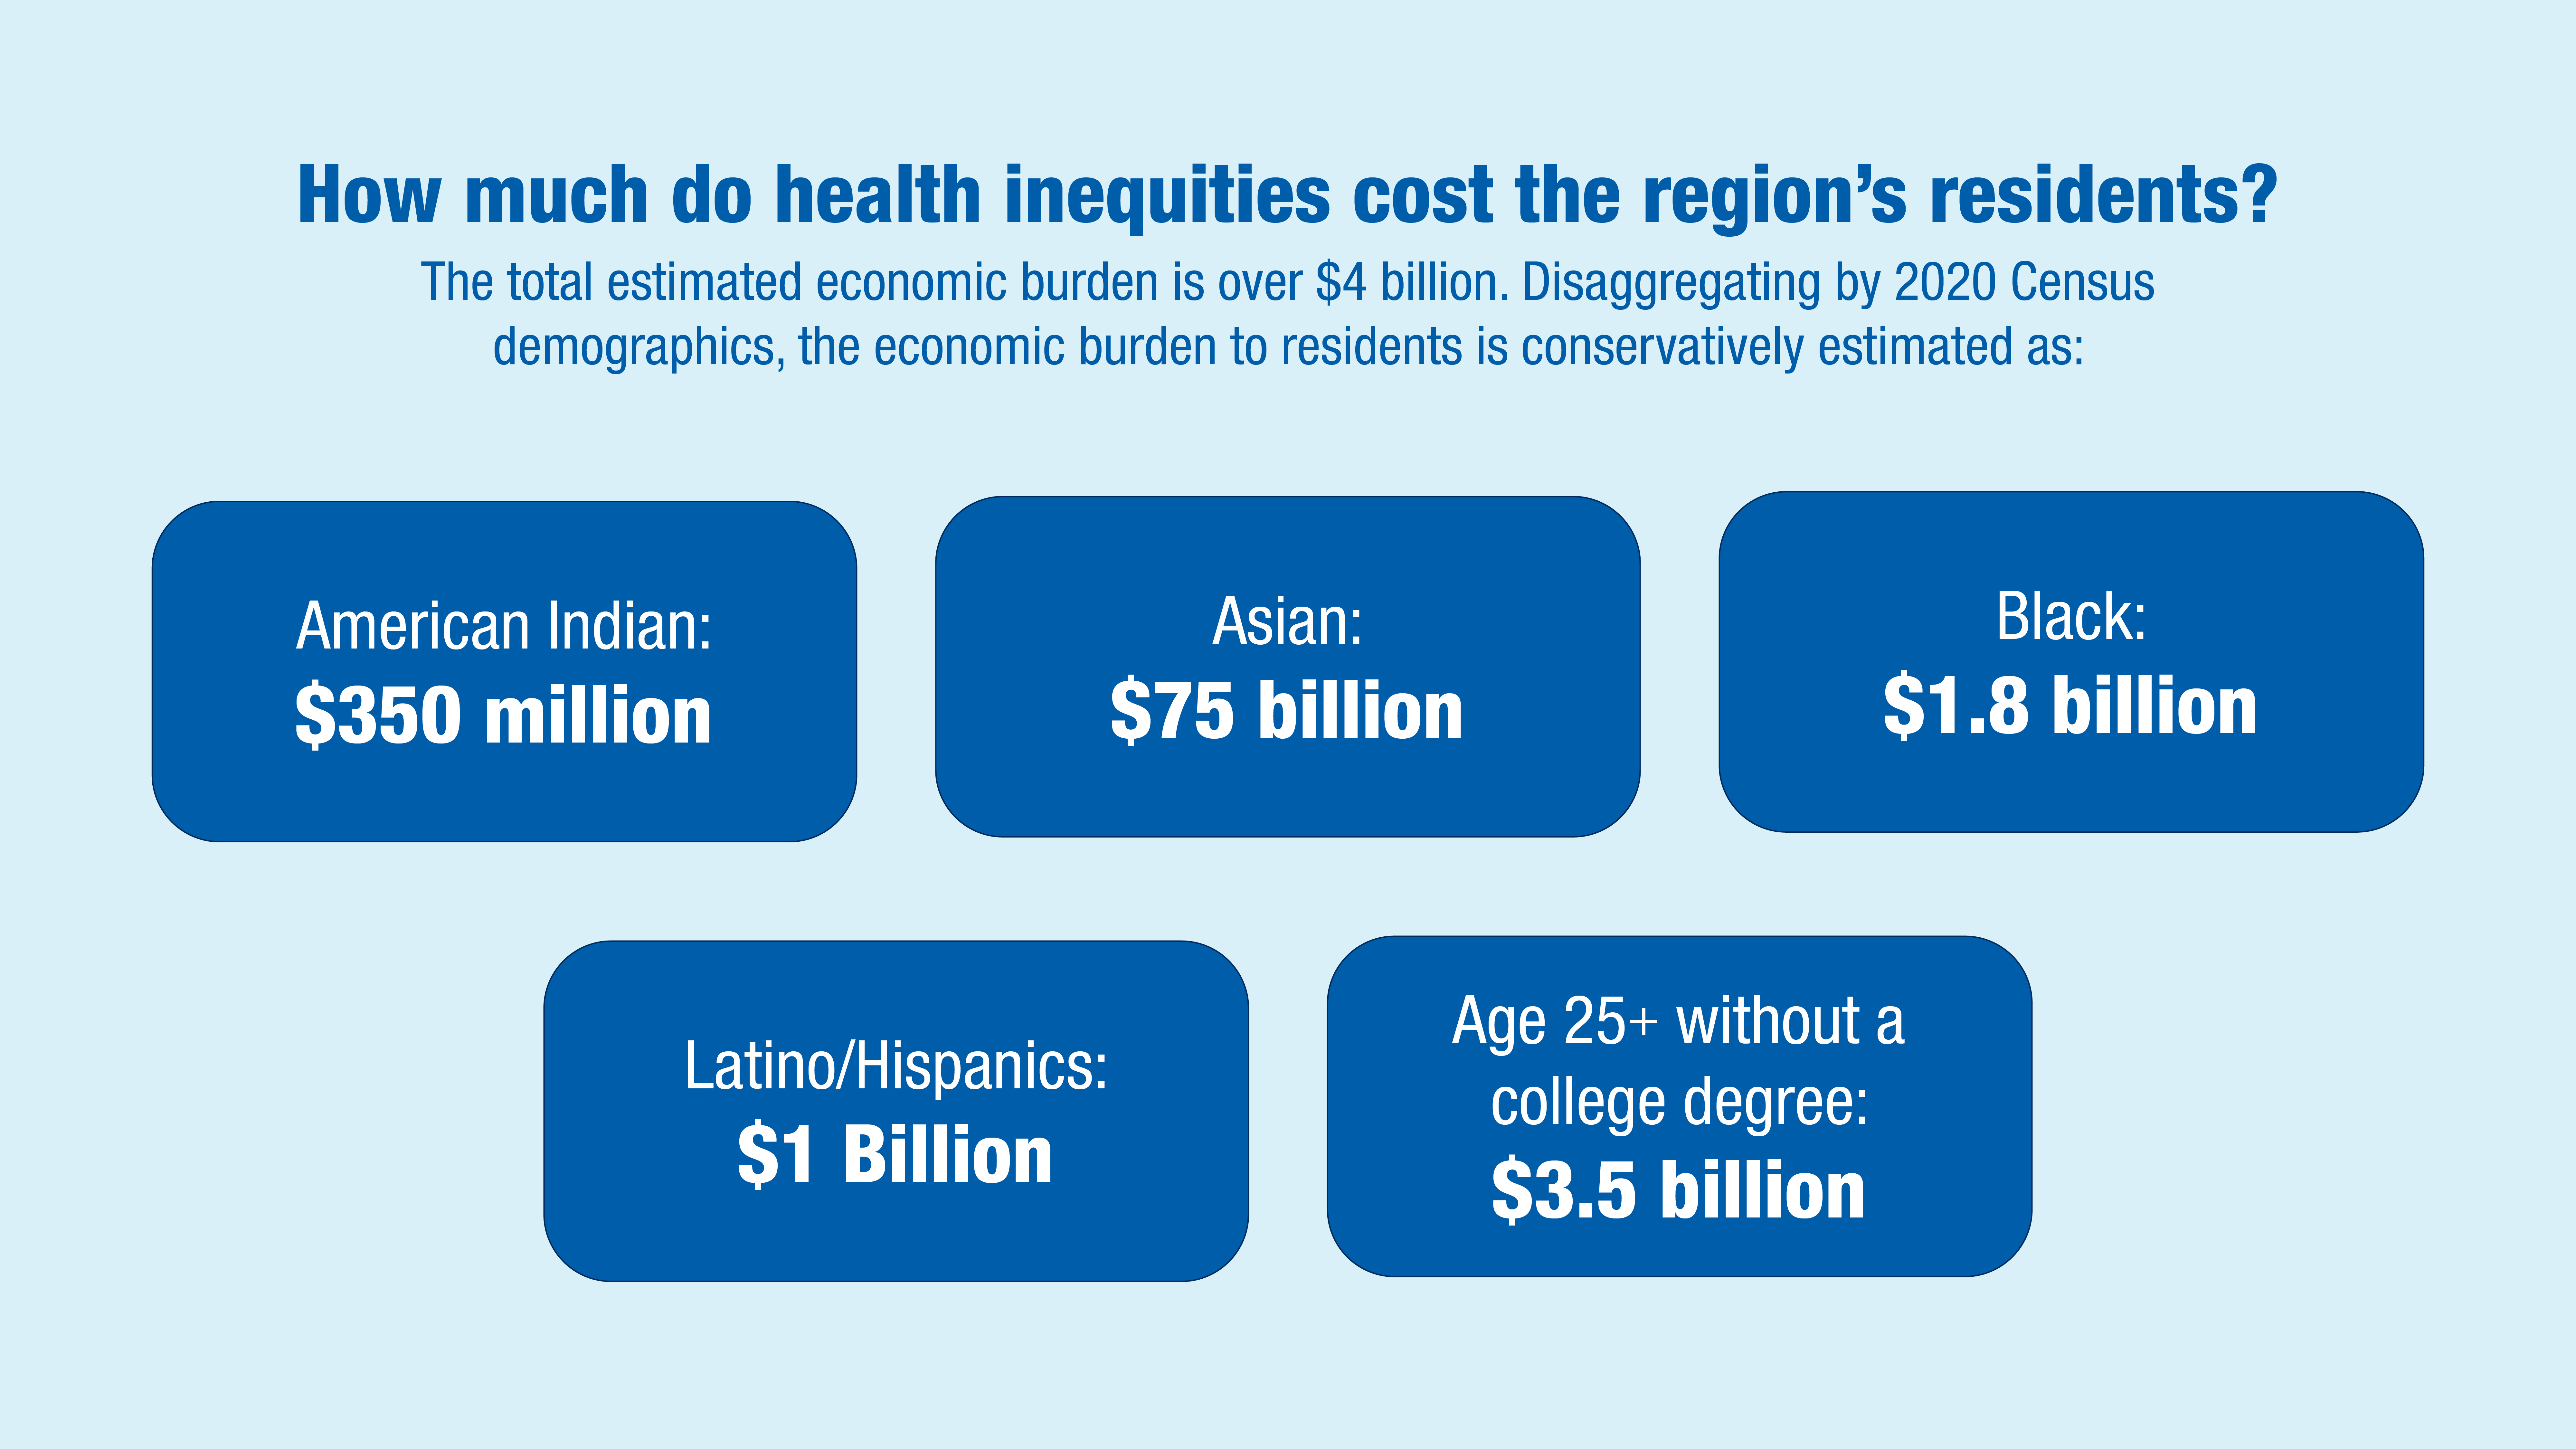
Health and safety includes both physical and mental health. The region ranks high overall in terms of some mental health infrastructure, including high access to recreational amenities, health insurance, and green spaces. However, in 2021, almost 30% of the region’s residents experienced one or more days each month when their physical health status was not good.178 This rose to more than 40% for mental health, worse than the national average.179 Healthy communities provide residents with opportunities for wellness and happiness. Imagine 2050 can support wellness through policies that expand opportunities to support individuals’ healthy choices, support neighborhoods that are welcoming and safe, and encourage meaningful social connections with others. Interventions and policy changes at the local level such as adding sidewalks, reducing noise exposure, and lowering the proportion of housing-cost burdened households have all been identified as supports to social determinants of health in the federal Healthy People 2030 initiative.180 Regional policy to achieve the Healthy People 2030 objectives within the region supports residents’ health and safety.
Development decisions can contribute to creating positive health outcomes. Mixed-use and transit-oriented development (TOD) land use policies provide demonstrated benefits by providing communities with increased opportunities for physical activity and social connection while potentially lowering crime and stress levels.181 Residents throughout the region told the Met Council how much they value cultural landscapes – spaces that reflect diverse cultures, histories, human necessities, and lifestyles. Walkable and interconnected communities, compact development, and green space for elements like community gardens increase positive emotions associated with mental health, like happiness.
Social connection combats the loneliness epidemic
Residents told the Met Council that pandemic isolation frayed community ties. They are eager to connect with their community and people beyond. They desire to feel a sense of trust in everyday interactions with others. Social connection creates happiness, belonging, job opportunities, and safety.
"After COVID-19, there's been a significant effect on a lot of community places and initiatives. People aren't as social as they used to be at holidays. They used to dance. They were out there. Mercado Central had a few immigration raids. Post-COVID ICE raids and riots created a community that is more focused on staying safe and holding on to the last bit of stability in their life instead of a community that flourishes."
-Receptionist and college student, Bloomington
Social isolation and loneliness have catastrophic effects for individual health and the U.S. economy. They affect two-thirds of adults and almost three-quarters of young people. Older adults, particularly from immigrant and LGBTQ+ communities, are vulnerable to loneliness and the health risks associated with it.182 Systemic issues, in the form of racial exclusion, lack of affordable childcare, spatial segregation, lack of broadband access, and an auto-dependent transportation system inequitably exacerbate social isolation. While mistakenly viewed as solely a personality or lifestyle issue, social connection emerges from intentional community design and systems, too.
Despite documented positive effects of social connection, the issue is relatively underrecognized in policy efforts. The U.S. Surgeon General called on local governments to address the issue through policy, including stable housing and safe neighborhoods with amenities for outside play for youth.183 Transportation systems connect residents to vital social relationships found in family, friends, coworkers, and neighbors. These connections, in turn, provide networks needed for access to jobs, education, health care and other opportunities.
A built environment where residents “feel seen” cultivates a sense of dignity
A sense of dignity is the feelings of worth and status that all humans should experience equally. A safe place to live, secure transportation access, and respectful communities emerge from effective policy and potentially contribute to residents’ sense of dignity. Young people advising the Met Council used the term “feeling seen” to describe built environments that conveyed a message of their worth and value. Having culturally appropriate food at the local store or businesses serving residents in their preferred language are ways residents reported feeling seen.
The Met Council can support community efforts through policies that cultivate respect and belonging through placemaking. The development or redevelopment of the built environment makes a difference. This begins with community-centered engagement and respect for Indigenous and cultural rights and extends with transparent, accountable planning efforts and accessible design. The treatment of workers during construction and management of land development as well as the support of end users’ physical and mental health in the resulting infrastructures contribute to a sense of dignity. Experiences with Met Met Council systems (transportation, water, and parks) and with the built environment contribute to feeling seen or disregarded. For example, placemaking efforts in neighborhoods, apartment buildings, and transit stops can tell stories that tell an inclusive history of the region.
FIGURE 4.2:
Rewarding lives are created in communities where residents feel safe and respected
A sense of safety emerges from both protection from harm and a sense of connection with others. Residents advising the Council about what they needed in their communities described these dual aspects as safety from violence, harassment, a polluted environment and accidents (protection from vulnerability) and connection with others (feeling a part of a community, trust among strangers in public spaces, opportunity to meet new people). Safe drinking water and breathable air contribute to safety. Access to safe and welcoming housing, freedom from racist or gender-based harassment or policing, and freedom of movement without violence create feelings of safety. Predictably respectful treatment while spending time outdoors, travelling in the region, or using Council systems all contribute to positive emotions and individual sense of dignity.
Healthy and safe communities in Imagine 2050
Access to nature is highly valued and creates healthy communities
Across the region, visits to parks, lakes, rivers and trails increased during the peak of pandemic social distancing. Public awareness about the importance of access to natural spaces expanded. Residents told the Met Council in Imagine 2050 engagement that access to nature was of the highest priority and the most important quality-of-life feature of our region. They treasure not only time in regional parks and trails, but also connections to everyday nature like neighborhood trees, bird-friendly planted areas, unbuilt open spaces, and community gardens.
Getting outdoors reduces medical costs, increases community trust, and provides health benefits. Visiting parks and trails increases physical activity and reduces risks of various chronic illnesses. Time in nature results in positive emotions like calmness, joy, and creativity. It results in stress reduction, attention restoration, enhanced spiritual wellness, and improved cognitive functioning. Social connections from outdoor activity increase social capital and family bonding. Parks and open space support public health through reducing the effects of urban heat islands and filtering the air we breathe.184
Residents’ ability to access nature is essential for individual well-being, community health, and social connection. Met Council engagement revealed that people feel reverence for and desire to live in community with non-human species. American Indian residents describe this desire as co-existence with plant and animal relatives, indicating a deeper interconnectedness of social relationships among all. Thriving habitats for more-than-human species deepens human residents’ connections to nature, fostering health for all.
A flourishing region is one with no social disparities in access to the outdoors. Social, geographic, and cultural barriers must be overcome to create equitable outdoor access by race, age, income, and ability so that all enjoy the health benefits of getting outside.185 Natural systems degradation such as water pollution, litter, climate change-induced flooding, and deferred maintenance needs to be mitigated and prevented. These challenges require policy commitments to ensure that inequities or degraded natural systems do not deny access to the benefits of getting outside and the flourishing of the region’s species – human and nonhuman.
Access to a clean environment is vital to public health
A clean, livable environment is a prerequisite for health, supporting healthy brain and body function, growth, and development.186 This includes clean water and air, as well as relief from the impacts of heat and transportation-related noise. The very young, older residents, and those with chronic health conditions are particularly vulnerable. Overburdened and underinvested communities within the region endure additional barriers to accessing a clean environment.
The Twin Cities metro region relies on clean, abundant water to drink, recreate, and rejuvenate. Lakes, rivers, and groundwater aquifers are threatened by pollutant-loaded runoff, current and emerging contaminants, and uncertainties in future conditions. These concerns are due to a growing population, climate change, and long-term contaminants. In rural areas, well-water users, particularly poorer residents, rely on regulatory protection from shortages caused by excessive agricultural aquifer water draws.187 Across the region, many areas with contaminated groundwater risk losing the use of existing wells or paying high costs for water treatment.
Surveyed residents' top 5 reasons for protecting lakes and rivers were:
- For safe and clean drinking water
- Equitable access to clean drinking water
- Future generations
- Equitable access to public waters for all Minnesotans
- Habitat for fish and wildlife survival
Source: Metropolitan Council's Value of Water in the Twin Cities Region Survey
The Met Council makes a critical contribution to the region’s water quality as it cleans and returns 250 million gallons of wastewater per day. As a result, the region’s population and others downstream enjoy clean water resources that protect public health and provide recreational opportunities. Strong regional water policies restore and protect the quality of our waters. Recognizing the connections between groundwater, lakes, streams, rivers, wastewater, and stormwater protects water quality. Collaboration is needed with all people and organizations who care about our region’s water.
Clean air protects residents from dementia, asthma, cardiovascular and heart disease, chronic obstructive pulmonary disease (COPD), and many cancers.188 Traffic-related particulates, including exhaust emissions as well as tire and brake particles, impact neighborhoods and indoor spaces across the region. Neighborhoods are disproportionately affected where larger percentages of residents live who are Black, American Indian, people of color, people who have low incomes, people who do not have health insurance, and people with disabilities.
Additional health benefits are gained from an environment free of excessive noise exposure and the effects of extreme heat. When buildings and roads are designed to lower noise exposure and communities consider excessive noise implications in development decisions, potential public health benefits are numerous and well-documented. Residents experience lower risks for heart attacks, cardiovascular disease, strokes, sleep disturbances, and cognitive issues.189 Healthy communities support residents through natural and built environments to reduce urban heat islands and provide access to support services like cooling centers.190 Reduction of these environmental hazards supports healthier communities through lower incidents of asthma, heat stroke, and violence.191
Quality housing choices throughout the region create safety, well-being, and dignity
Housing is a foundation for improving health, reducing homelessness, and providing a platform to build stability in other areas of life. Housing quality affects physical and mental health. Safe housing protects inhabitants from lead poisoning, bodily injury such as falls, and asthma.192 The region’s housing stock can protect health and safety through resilience to the effects of climate change. Affordable housing needs to be close to cooling green spaces and far from urban heat islands. Quality affordable housing needs to be built and maintained to a high standard.
Many residents lack dignified housing, especially those experiencing housing insecurity and homelessness. Averting or addressing homelessness prevents individuals from developing new health problems and from worsening existing health issues.193 Youth are disproportionately affected. In 2023, 41% of people experiencing homelessness were children and youth (under age 24), despite being only 32% of the region’s population.194 Investments in expanding quality housing choices results in higher levels of positive emotion and mental health.195
"Being homeless could come fast and easy. It's a scary feeling living with instability. We need more affordable housing and giving people a chance. I want to feel stable."
-Resident, Little Earth Community, Minneapolis
Quality housing choices meet all residents’ needs, are located where residents want to live, are affordable for the long term, and form a part of a connected cultural landscape. Inclusive housing options for diverse populations, including older adults, people with disabilities, and multigenerational households, ensure people can live close to desired social connections, education, and economic opportunities. In the short term, tenant protections and housing preservation programs for naturally occurring affordable housing help ensure people live in the neighborhoods of their choice. In the long-term, the Met Council tracking of anti-displacement ordnances and their effectiveness can provide guidance for best practices to avoid displacement.196
Housing located close to spaces that reflect diverse cultures, histories, human necessities and lifestyles support well-being. These flourishing cultural landscapes enhance access to community and cultural connection and contribute to the building of rewarding lives.
Many residents envisioned home ownership as part of a rewarding life. The Met Council heard in Imagine 2050 engagement that residents valued the opportunity to build wealth and have increased autonomy. Quality homeownership is not equitably accessible. Black homeownership is well below the national average due to redlining, the destruction of Black neighborhoods, predatory lending, and lack of intergenerational wealth due to systemic racism. Asian, American Indian, and Latine populations have lower rates of homeownership compared with white populations. As of 2023, the Twin Cities region was making progress in increasing housing supply, building more affordable housing, and expanding the number of Black homeowners.197 However, more needs to happen to make these changes permanent and reduce this barrier to equitable access to healthy, rewarding lives.
Social connection and rich cultural landscapes nurture healthy, rewarding lives for the region’s residents
A rewarding life includes the opportunity to make meaningful contributions and feel respected and valued within the community. Social connections and community involvement contribute to a rewarding life. However, many people in the region struggle to form stronger social ties and feel a part of the community. Rural communities have higher levels of social isolation, as do younger and older adult residents. Immigrants face barriers to connection due to language and cultural barriers in addition to the need for new social networks. The COVID-19 pandemic further decayed people’s social interconnection. As more people work from home and more educational and social opportunities move online, people experience the lack of depth in social interaction and feelings of disconnection from society. The social isolation and distress brought on by the pandemic impacted mental health, leaving a lasting impact on well-being.198
To address these challenges, planning strategies such as equitable transit-oriented development foster community and social connections. Equitable TOD brings people together and allows more social opportunities by increasing interactions through mixed-use neighborhoods.
"Having a walkable city is good for basically everything. It reduces the carbon footprint of the city. It increases the use of transportation. Having places that are walkable is good for the health of the citizens."
-High School Senior, Scott County
Walkable neighborhoods encourage social interactions, contributing to happiness and feelings of trust in others.199 Sustainable, diverse, and compact development enhances cultural landscape by supporting a diversity of spaces to create feelings of belonging. These types of development not only celebrate unique cultural identities in different communities, but also foster the sense of pride and belonging among residents.
Safety, comfort, and belonging while traveling is important for well-being
People have a wide variety of needs to feel safe, comfortable, and welcome while traveling. Travel experiences can vary depending on traveler’s social identities, such as race and ethnicity, gender, age, and disability. Facilities beyond traditional transportation infrastructure can be crucial for supporting safety and comfort, especially for people traveling by walking, rolling, biking, and transit. Being able to safely arrive at destinations or home should be a hallmark of a reliable, safe transportation system.
Policies resulting in lower stress and anxiety in travel can support the goal of healthy and safe communities. When walking, rolling, or bicycling, policies can support feelings of safety around vehicle traffic, inclement weather, or personal well-being. Transit stop and crosswalk design, additional bus shelters, warming and cooling stations, and other investment decisions can reduce traveling stress. Drivers can feel stress in different contexts, including some from traveling at high speeds on highways, in unexpected congestion, in interactions with aggressive drivers, or after near misses or crashes. Policies to reduce exposure to these stressors can create conditions that foster well-being for people who drive.

The well-being of residents in the Twin Cities depends on a dynamic and resilient region. The social and economic vibrancy of the region starts with a robust and inclusive economy. Our region has numerous assets that make it an attractive place to live, but it also faces many challenges that threaten the quality of life of its residents.
Many of our challenges emanate from the racial inequities that continue to fray the region’s social and economic fabric. These disparities stifle our economy and threaten the stability of our communities. A dynamic and resilient region requires a robust and socio-economically inclusive economy. The region needs to address existing racial disparities to alleviate structural economic problems such as workforce shortages, housing affordability issues, limited spending, and lagging business formation. For the region to remain competitive, it needs to have an economy where everyone can engage as entrepreneurs, innovators, employees, and consumers.
In an ever-changing world, the region needs the resilience to withstand and recover from various shocks and disruptions. While our economy has certain features that boost the region’s resilience, it also displays characteristics that make the region vulnerable to abrupt changes. Factors such as workforce stability, industrial diversity, economic competitiveness, and energy dependency impact the region’s resilience.
The region is also facing climate-change-related vulnerabilities, which impose significant and escalating personal and economic burdens on our residents. A dynamic and resilient economy is necessary to withstand the environmental and economic shocks introduced by climate change. Responding to these shocks requires resources and a proactive approach to climate mitigation and adaptation. The region is poised to take advantage of the economic opportunities created by climate change by investing in a green economy that can grow in an inclusive fashion.
In order to advance a dynamic and resilient regional economy, the Met Council makes the following commitments:
- Identify the region's economic strengths, weaknesses, threats, and opportunities, and collaborate with regional economic development partners to identify regional priorities and strategies.
- Convene a committee of stakeholders to update the Regional Economic Framework in accordance with the federal government’s Comprehensive Economic Development Strategy requirements.
- Advance efficient and thoughtful regional growth through wastewater, transportation and parks infrastructure investments, and the implementation of regional policies.
Our region’s economic assets
The Twin Cities region boasts numerous economic assets that contribute to its robust and dynamic economy. The region offers a cultural scene with numerous theaters, museums, art galleries, music venues, and festivals throughout the year. The region has consistently been recognized for its high levels of educational attainment, high workforce retention and productivity, and low unemployment.
The Twin Cities region has a strong economic base with a diversity of nation-leading sectors like healthcare, finance, technology, manufacturing, and education, including several Fortune 500 companies. The metro has substantial shares of the national market in printing and publishing, finance, insurance, health services, medical devices, metal products, machinery and technology. The area is also home to several prestigious colleges and universities, which attract students from around the world.
Minnesota-based venture capital investments are concentrated in the healthcare and technology sectors. The Twin Cities is the only area in the state with consistent gains in startup job creation in the past decade (2010-2019).200 From 2020 to 2021, new business applications spiked across the state. Despite underrepresentation of Black, American Indian, and people of color and women-owned businesses in the state's economy, Minnesota’s population of entrepreneurs of color is growing and outperforming their peers on a national level.201
Minnesota is increasingly recognized as a welcoming and inclusive place for LGBTQ+ individuals. The state has enacted laws prohibiting discrimination based on sexual orientation and gender identity in employment, housing, and public accommodations. Same-sex marriage has been legal since 2013. In April 2023, Minnesota passed a bill to protect gender-affirming services and care.
Unlike most U.S. metros, the Twin Cities region benefits from a coordinated regional planning and taxbase sharing arrangement, which foster cohesive, regional development. The Met Council plays a crucial role in the economic vitality of the region by overseeing regional planning, transportation, and wastewater services. This unique planning body coordinates efforts across the seven-county metropolitan area, ensuring efficient infrastructure development, sustainable growth, and equitable resource distribution. By managing public transit systems like Metro Transit, the Met Council supports workforce mobility and promotes economic activity. The Met Council's focus on affordable housing and environmental stewardship helps maintain a high quality of life.
What holds our economy back now and in the future
Inequities contribute to current workforce shortages
While the region enjoys numerous assets that contribute to its dynamic and robust economy, not all residents enjoy its prosperity, nor are they insulated from economic downturns. This poses significant challenges to the region’s growth and stability.
The region’s economic growth has been slowing and is forecasted to slow in the next three decades.202 Between 2018-2023, the region has experienced almost no job growth, ranking last among peer regions.203 There is regional consensus that this is mainly due to the existing workforce shortage. With nationally low unemployment rates, the region struggles to fill thousands of jobs, indicating a tight labor market.204 In fact, Minnesota’s labor shortage has been among the country’s most stark, with just 51 unemployed workers for every 100 unfilled jobs.205 With baby boomer retirements expected to peak in the next 10 years and just enough younger workers to backfill vacancies, shortages may continue to constrain economic growth.
The Twin Cities metro has a mixed record of attracting talent. The region, which recently lost as many young professionals as it attracted, needs to develop local talent to expand its workforce.206 This poses unique challenges as the region still has gaps in training and career pathways that hinder workforce development for key industries.207 As our region’s workforce continues to grow in racial diversity, it is crucial to address the systemic inequities hindering Black people, American Indian people, people of color, immigrants, and people with disabilities from full workforce participation. Existing racial inequities in educational attainment levels and unemployment rates continue to limit the growth of the local workforce and squander valuable talent. There are 98,000 unfilled job vacancies in the region.208 Eliminating inequities in the share of unemployed people in the working-age population could add as many as 41,000 Black, American Indian, and workers of color back into the economy.209
To meet its workforce needs, the region increasingly relies on immigrants, who contribute considerably to the region’s economy as taxpayers, business owners, and workers.210 They offer a swift influx of fresh talent amidst an aging U.S.-born workforce, bolstering the region’s workforce.211 Yet, barriers that impede their access to job opportunities continue to hamper economic growth. Difficulty in recognizing foreign credentials in the local job market, language barriers, and discrimination in the hiring and promotion processes are among these barriers. Moreover, undocumented immigrants often fear deportation, which can deter them from seeking higher-paying employment opportunities or investing in their education or businesses.
Health care, retail, and accommodation and food services are among the industries with the highest vacancies.212 Most of these jobs require very little formal education – a fact that lowers barriers to entry into the workforce.213 Despite this, the region has been unable to attract enough workers to fill these positions, partially due to low wages. The median hourly wage of unfilled job openings in the region stands at $19.96, well below the living wage of $25.214 Most workers of color and immigrant workers earn even lower wages because they are overrepresented in lower-paying occupations due to occupational segregation.215
This discrepancy between living and median wage makes being able to afford housing difficult, making the region less accessible to potential workers. While housing in the region is relatively affordable compared to other metros, this is not the case for all residents in the region. In fact, the region’s Black households, American Indian households, households of color, and low-income households disproportionately struggle with housing affordability.216 Moreover, increases in incomes have not kept up with rising home prices and rent, which have climbed faster than incomes.217 These factors, which increase housing cost burden for many Black households, American Indian households, households of color, deter them from moving to the region, exacerbating the region’s labor shortages as older adults retire and leave the workforce.
The region’s racial income disparities are another factor that stifles the economy. On average, Black people, American Indians, and people of color have lower incomes compared to their white counterparts.218 This limits their purchasing power and suppresses economic growth by dampening consumer spending, a crucial driver of economic activity. Overall, increased consumption creates a positive feedback loop in the economy, driving production, business expansion, and job creation. This, in turn, further stimulates consumption, thereby fostering economic growth and employment opportunities in the region. If existing earnings gaps by race were eliminated, it could inject nearly $11 billion into the economy and significantly boost consumer spending.219
In the context of a rapidly aging and rapidly diversifying workforce over the next 30 years, the racial inequities described here as already impeding economic outcomes will become greater threats to the region’s economic prosperity and resilience over the next 30 years.
Missed opportunities in business formations, entrepreneurship, and diverse industry mix
The region struggles with slowing job growth partly because it trails peers in new business formations.220 Venture capital flows into the region historically have been limited and have declined significantly since 2020.221 The region has been able to secure large investments in nationally competitive sectors ranging from health care, med-tech, food, and agriculture to data centers and high-tech manufacturing.222 Despite these notable investments, the region overall has failed to attract as much investment as it has sent out, resulting in net deficits in terms of employment.223
Business formation in the region is slow due to the underutilization of existing entrepreneurial potential for small businesses. New businesses, especially small ones, generate job creation. In fact, small businesses (less than 20 jobs) have created 48% of the region’s employment growth since the pandemic.224 However, the region does not take full advantage of its small business potential, with entrepreneurs of color and immigrant entrepreneurs starting businesses at lower rates than their share of the population.
Entrepreneurs of color and immigrant entrepreneurs face significant barriers in access to capital, which limits their inclusion in the regional economy and overall success. BIPOC entrepreneurs are less likely to secure business loans, and when they do, the loans are smaller than those obtained by their white counterparts.226 As a result of limited capital access, BIPOC-owned businesses tend to be smaller and generate less revenue.227 In addition, businesses owned by people of color or immigrants are concentrated in different industries than white-owned businesses. The economic sectors where BIPOC-owned firms are most common tend to have lesser revenues and fewer employees.228 To maximize the job creation capacity of small businesses, the region needs to take full advantage of its entrepreneurial potential and address racial disparities in access to capital and participation in entrepreneurial activities.
The industry composition of the region’s economy is another factor that slows growth. The industries that are nation-leading tend to employ only a fraction of the region’s workforce. For instance, the region is known for its nation-leading industrial cluster of medical device manufacturing, but this cluster employs only 1% of the region’s workforce. Overall, only a third of the region's jobs are in growing and leading or emerging industries, while the rest are in industries that are either declining or losing their national competitiveness.229
Opportunities for an economically resilient future
Resilience is a critical attribute for the Twin Cities region to withstand and recover from various shocks and disruptions. Many factors impact the resilience of the region’s economy: workforce stability; diversity and competitiveness of the region’s economy; an inclusive economy that ensures the vitality of all types of places and communities; energy independence; broadband access; and climate change.
Investing in people
In the Twin Cities region, workforce instability undermines the region’s economic resilience more than anything else. Due to ongoing labor shortages, the region is highly dependent on migrant labor. The heavy reliance on migrant labor in tight labor markets undermines the stability of the region’s workforce, leaving the region vulnerable to external factors such as fluctuations in federal immigration policies. Addressing these shortages through strategic planning, training programs, and policies that promote local workforce development can enhance resilience in the face of workforce-related shocks. Removing the barriers to integrating the region’s foreign-born residents into the workforce can also be an important step in promoting a more stable local workforce.230
Minnesota offers various initiatives to develop local talent through a systemic approach to workforce development. It provides accessible and affordable post-secondary education and career training through the state colleges and universities system. The state integrates work-based learning into degree and certificate programs linking industries with educational opportunities, and the Minnesota Job Skills Partnership promotes industry-specific training programs. In addition to these state efforts, the region uses digital platforms for data-driven solutions to workforce development. The region has many additional opportunities to strengthen this workforce infrastructure.
Promoting a more balanced economy
Economic resilience is deeply intertwined with the diversity and competitiveness of local industries. The region’s economic diversity acts as a buffer against shocks. The region has many industries that have nation-leading shares of national industry employment.231 Nation-leading industries in the region contribute to economic stability and foster innovation and adaptability. By nurturing a diverse array of industries and supporting emerging sectors, the region can fortify itself against industry-specific challenges and downturns. The region can reinvigorate its nation-leading industries that are struggling to grow and those industries that have been declining. In fact, this is not only an opportunity but a necessity since these industries employ a significant share of the region’s labor force. Regional economic resilience depends on economic development strategies that are inclusive of all industries and not just the emerging and highly competitive ones.
Cultivating a more inclusive economy
The region cannot be resilient unless it grows in an inclusive fashion. Resilience encompasses the economic vitality of all communities. Historically disinvested communities in the region tend to be economically fragile places. Small-to-medium-sized businesses, that generate considerable employment in the region, can play a key role in strengthening the economic fabric of communities. Supporting these businesses, especially the ones owned by historically marginalized groups, can foster more resilient communities. Policies that target small and medium-sized businesses and enhance their access to capital and business development initiatives can enhance their viability.
For the region to be resilient, every part of it, including its downtowns, must be vibrant. The rise of teleworking, accelerated by the COVID-19 pandemic, poses unique challenges to downtown areas. Downtowns are home to many “knowledge worker” and management functions, occupations where one-third to one-half of total employment can work from home.232 The continuing absence of commuting workers challenges the well-being and recovery of downtowns. As teleworking becomes more prevalent, reimagining downtown spaces and revitalizing these local economies through innovative approaches becomes essential for ensuring their long-term resilience and vibrancy.
Supporting energy independence
As a region that is dependent on imported energy sources, the Twin Cities metro faces heightened vulnerability to external shocks. Diversifying energy resources is essential for the region to mitigate the impacts of supply disruptions. Investing in a renewable energy infrastructure, promoting energy efficiency measures, and exploring alternative energy sources can bolster the region’s energy resilience. These strategies can provide a more sustainable and secure foundation for the region’s economy.
The region is making strides toward enhancing its economic resilience by decreasing its reliance on imported energy sources. For instance, Minnesota has the nation’s fourth largest community solar capacity, and the solar industry is projected to grow.233 The region is poised to leverage new opportunities through its strong partnerships among utilities, businesses, government, and nonprofit organizations. Since businesses in the region have strong interest in clean energy, a growing sector in the region, renewable energy sources have the potential to substitute for imported energy. Ongoing grid modernization efforts also help reduce the region’s vulnerability in the face of supply disruptions.
Transitioning to renewable energy sources like solar, wind, and hydroelectric power can reduce greenhouse gas emissions and dependence on fossil fuels. Diversifying and upgrading the region’s energy grid and power resources will make the grid more resilient to extreme weather events, reduce instances of blackouts and brownouts, and make the economy more resilient to changing conditions. According to the American Council for an Energy-Efficient Economy, Minnesota ranks 1st in the Midwest and 10th nationally for its comprehensive energy efficiency programs. A 2024 report from The Business Council for Sustainable Energy showed that zero-carbon energy has powered the majority of Minnesota's electricity (54%) for four consecutive years, compared to the national average of 42%. In the last decade, renewables accounted for 84% of all new energy capacity in Minnesota.234
Fostering a robust digital infrastructure
The region’s broadband infrastructure, the backbone of remote work and data connections during the pandemic, is growing. Committed to achieving broadband availability and speed goals, the state of Minnesota provides numerous opportunities for broadband development through technical and financial assistance. As an exemplary model of a state-led broadband initiative, the region already has one of the nation’s lowest rates of digital poverty.235 In 2024, the Office of Broadband Development submitted the state’s Digital Opportunity Plan to guide the implementation of a federal Digital Equity Capacity Grant. This plan aims to reduce gaps in access, device ownership, and digital skills to build a digitally equitable state.236 Through its Minnesota Broadband Initiative, the Department of Transportation informs broadband providers about upcoming construction projects to coordinate broadband infrastructure installation.237
Building resilience to climate change impacts
Climate change imposes new vulnerabilities on the region’s economy. Increasing temperatures and more frequent and intense extreme weather events, are expected to create significant and escalating economic burdens over time. They are likely to impose substantial new costs, risks, and externalities on the region’s economy, adversely affecting the economic well-being of many Minnesotans.
The economic and human consequences of climate change are highly uneven across communities, industries, and the region. Certain communities and individuals are more vulnerable to the impacts of climate change for several reasons, which are discussed in the ‘Our Region is Equitable and Inclusive’ section.
Increased frequency and severity of extreme weather events, such as storms, floods, droughts and heatwaves, can disrupt the economy by destabilizing agricultural production, damaging the region’s energy and transportation infrastructure, impacting supply chains, and leading to economic losses in many industries. These events disrupt transportation routes, damage infrastructure, and affect the availability of raw materials. These disruptions can impact producers and consumers alike through shortages, increased costs, and higher consumer prices. Impacts and disruptions to infrastructure can also limit the flow of goods and employees throughout the region, creating shortages, backlogs, and supply-chain issues.
Climate change particularly affects the state’s agricultural sector. Minnesota was the fourth largest exporter of agricultural goods in the country in 2019. During the past several decades, the state has experienced increasing temperatures and varying precipitation rates, trends that are expected to continue. These trends can reduce crop yields and livestock productivity and increase pests and diseases. Warmer temperatures may prolong the growing season, shift the growing region for corn and soybeans, and change the viability of crops grown in the region.238 They can also impact the sector’s labor force by making farm laborers vulnerable to heat-related illnesses.
Climate change also has significant impacts on the region’s energy infrastructure. Extremely hot or cold weather strains the grid as people attempt to acclimatize their spaces. This can overwhelm energy infrastructure and lead to outages. Extreme weather can damage power plants and lines, resulting in shortages. Utility companies may also increase energy prices during peak usage times, a particular challenge for low-income families or renters without control over appliances or thermostats.
Severe and increasingly intense weather patterns also affect the insurance markets that are crucial for financial resilience. Increasing frequency and severity of disasters result in higher insurance payouts and premiums, impacting businesses and consumers reliant on insurance services. The costs of public programs such as crop insurance and wildfire suppression are likely to increase because of climate-change related events as well.
Rising temperatures and milder winters have substantial effects on the tourism industry. Algae blooms caused by high temperatures can be a major health hazard to humans and pets, reducing recreational activities around lakes. This disproportionately affects local economies and lakeside communities reliant on tourism revenue. Warmer winters lead to less snow and ice which results in shorter snowmobiling, skiing, and ice-fishing seasons, which impact resorts and communities that rely on snowy conditions to bring in tourists.
The negative impacts of climate change on the economy are immense and increasing. However, along with these impacts, climate change also presents opportunities for a green economy that focuses on sustainability and climate resilience. A green economy can promote employment in sectors such as renewable energy, energy efficiency, sustainable agriculture, reforestation, and carbon offsetting. These sectors can grow the economy while mitigating and adapting to the effects of climate change.
Increasing awareness of the global effects of climate change has led to a transformation of the workforce on a global scale, creating new opportunities and challenges for workforce adaptation and green job creation. Green jobs, which can span multiple sectors, including energy, agriculture, and construction, can also include employment in industries which promote environmental protection and support renewable energy. These jobs can contribute to improving energy efficiency and sustainable resource management in a variety of industries including manufacturing and construction. Creating green jobs and developing a workforce that meets the needs of green sectors are crucial for the region to adapt to climate change.

The inheritors of our 2050 region are the youth of today, and we hear their urgency when it comes to the climate emergency our region and globe are facing. We need rapid, decisive climate action at all levels of society, including across governments and across all sectors of our economy. Students like those in Roseville expect the Met Council to deliver meaningful change when it comes to climate action. We are fully committed to the youth of our region, and we plan to deliver on ensuring a resilient climate future.
Climate change is both a threat and opportunity for our region. If we plan for climate change now, we will not only thrive despite its impacts but can also create a more just, equitable, and climate resilient region for 2050 and beyond. The Met Council commits to working with local and Tribal government partners as well as nonprofit partners and new stakeholders that seek to collaborate on climate solutions.
"If the Met Council could work on things that lead us to a more climate-conscious future, that would be great."
-Local high school student
To achieve the climate goal, the Met Council makes the following commitments:
- Reduce the region’s emissions 50% by 2030 (from 2005 levels) and achieve net-zero emissions by 2050.
- Plan, build, and operate infrastructure to address present and anticipated climate challenges and increase regional resilience.
- Acknowledge and remedy historic and ongoing environmental injustices to provide environmental benefits for all.
Renewed commitment on climate
The Met Council’s climate work aligns with the State of Minnesota’s vision to be carbon neutral, resilient, and equitable.239 Minnesota makes a commitment to reduce statewide emissions 50% by 2030 (from 2005 levels), with a Statewide goal of net-zero emissions by 2050. The Met Council’s climate commitments seek to advance the state’s goal and call for the region to reduce its emissions 50% by 2030 (from 2005 levels), with a region-wide goal of net-zero emissions by 2050.
Imagine 2050’s climate commitments arrive at a pivotal moment in Minnesota’s progress on climate change. In 2023, the Minnesota State Legislature passed an amendment to the Metropolitan Land Planning Act which requires the Met Council to include climate change in the regional development guide (Minn. Stat. §473.145), as well as requires incorporation of planning for climate change in local comprehensive plans (Minn. Stat. 473.859, subd. 2(e)). In addition, the Met Council’s climate efforts support and build upon recent federal and state climate efforts, such as the Minnesota Climate Action Framework and the U.S. EPA’s Climate Pollution Reduction Grant.240 The Met Council’s regional efforts expand upon our operational climate efforts that are detailed in the Met Council’s Climate Action Work Plan.241
Climate connections to natural systems
Our natural systems, when in a healthy, connected, and biodiversity-rich state, are our best line of defense against projected climate impacts. When our natural systems are degraded through poor planning and overuse of resources, natural systems become less resilient to climate change impacts. Therefore, the protection, integration, and restoration of natural systems at all scales is vital to creating climate resilience in our region. Development activities will continue, but we need to design with nature to create a future that can reduce climate impacts, be they extreme heat, localized flooding, or other climate-related hazards.
Climate connections to environmental justice
By understanding the impacts of historic policies, we can create equitable climate solutions that lessen the current impacts. Historically disinvested and overburdened communities, such as Black, American Indian communities, people of color, and low-income communities, continue to face the effects of decades-old policies today. Many of these effects, such as poor air quality, localized heat islands, and chronic health issues, are amplified by climate change. Impacts such as contaminated soil and water further amplify the challenges of preparing for and responding to a changing climate. These environmental challenges also come with increased health risks on the elderly, the young, and those with chronic and acute health conditions, particularly when such communities hold intersecting identities as part of low-income and/or Black, American Indian, and people of color communities. In addition, systemic disinvestment has prevented generational wealth-building, leaving many communities with fewer financial resources to respond to the climate impacts of today.
Our climate actions can help mitigate the current impacts that stem from past planning practices. A focus on equity and environmental justice also seeks to ensure the conscious distribution of the costs and benefits associated with the actions within this plan.
Regional greenhouse gas emissions
The region’s greenhouse gas emissions come from diverse sources, ranging from powering our workplaces to heating our homes to driving vehicles. In 2021, the region was responsible for approximately 33% of the state’s total greenhouse gas emissions. From 2005 to 2021, regional emissions saw a 26% decline, driven primarily by decreases in the electricity and transportation sectors. However, transportation emissions were depressed by the COVID-19 pandemic to a significant degree.
Figure 6.1: Change in greenhouse gas emissions, by sector, 2005-2021 for the seven-county region
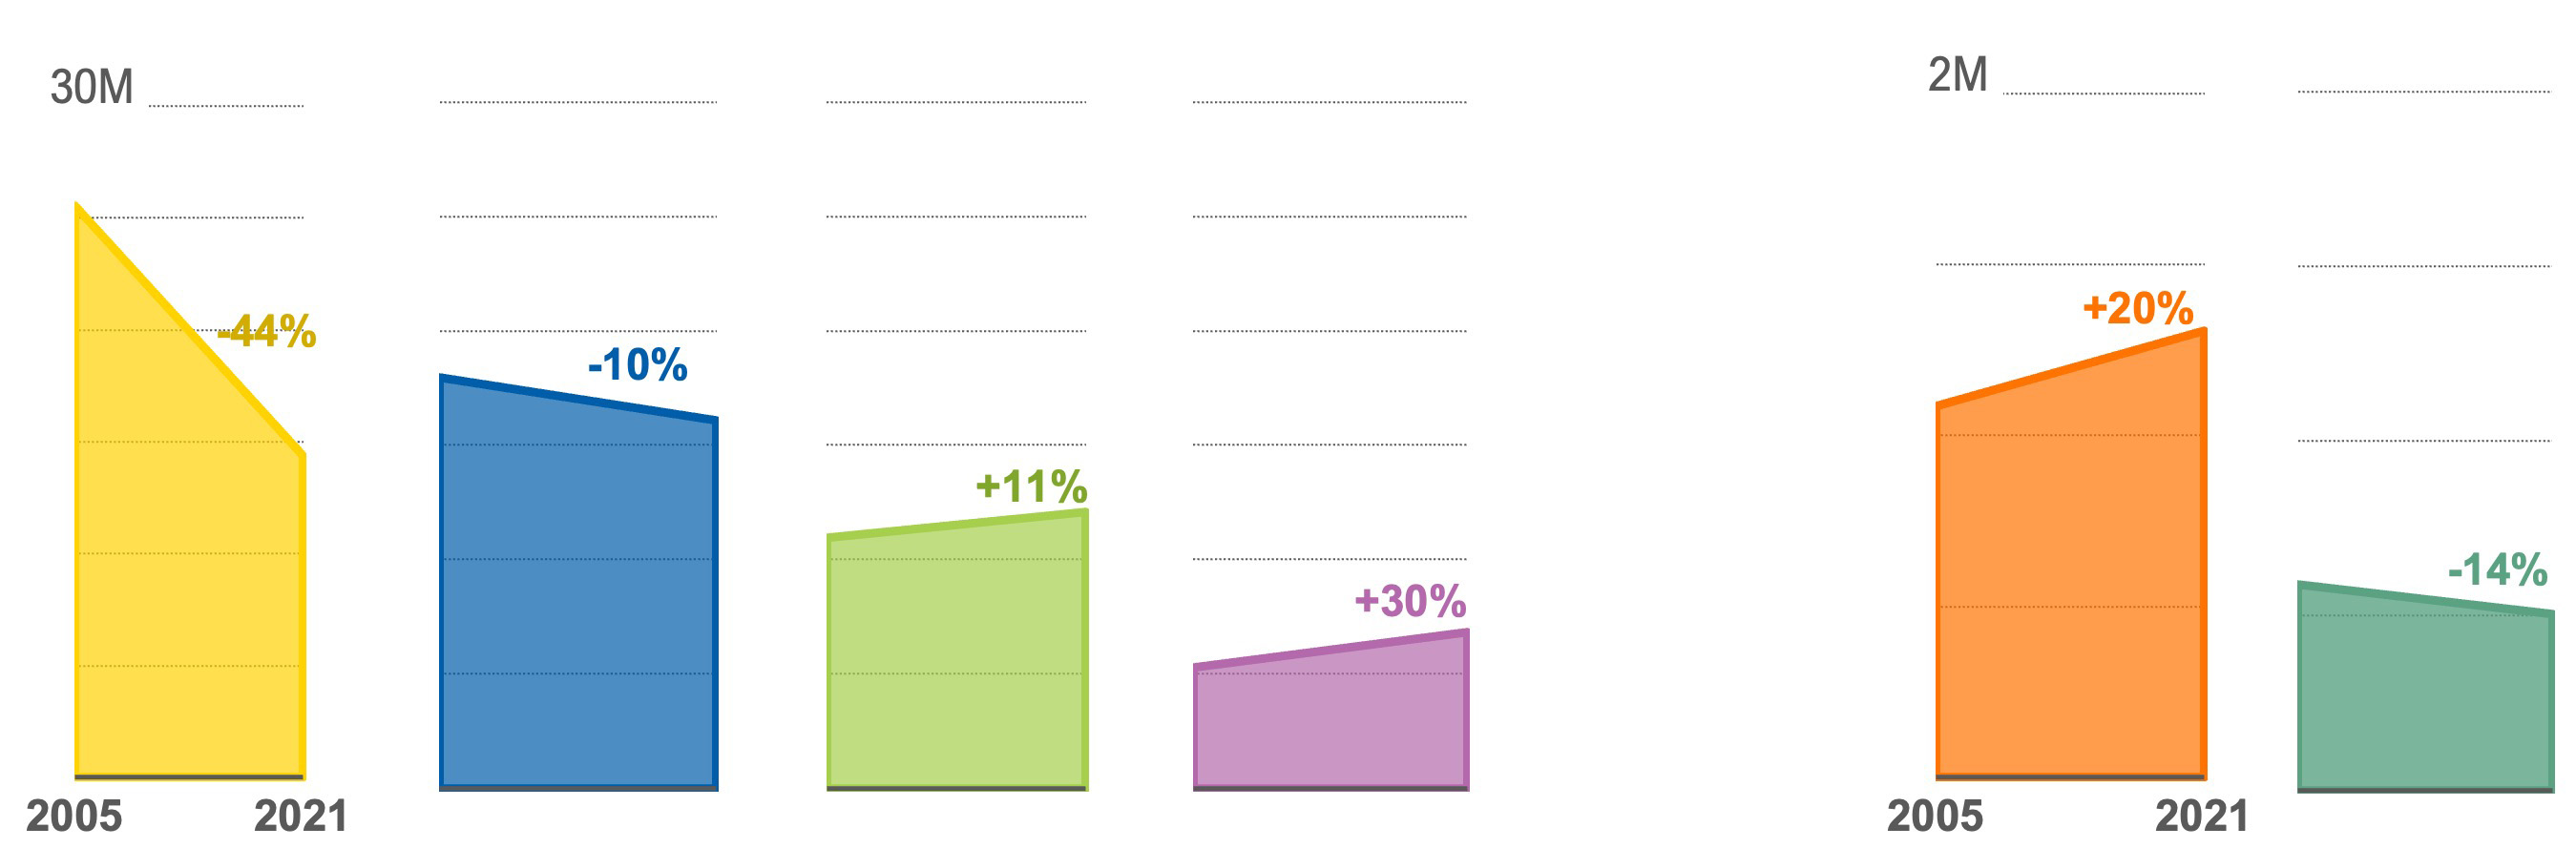
Source: Metropolitan Council analysis of state, federal, and scientific sources of sector data.
The built environment and how people travel around the region are significant contributors to greenhouse gas emissions in the region. Most of the region’s greenhouse gas emissions come from electricity usage and burning natural gas to fuel our homes, businesses, and industries (Figure 17). A very small portion of the region’s emissions come from kerosene or propane used for heating.
To significantly reduce emissions and meet the goal to become net-zero by 2050, the region will need to reduce its natural gas use. As a cold climate region, most homes and businesses rely on natural gas furnaces and hot water heaters. Switching to electric options requires decarbonization of the electric grid to reduce net emissions. The residential, commercial, and industrial sectors can lower emissions from electricity by increasing the energy efficiency of buildings and through Minnesota’s efforts to move toward a decarbonized electrical grid.
Our region is already moving towards a more sustainable energy system. Currently, 26 metro area communities, representing nearly half of our region's population, have worked with the national SolSmart program to incorporate solar energy best practices into their planning and permitting.242 Additionally, as required by the Metropolitan Land Planning Act, every community’s comprehensive plan contains an element for the protection and development of access to direct sunlight for solar energy systems and many communities have exceeded this requirement through plans, ordinances, and resources.
The region can build on these successes to continue to reduce energy use and transition energy sources to renewables.
Residential
Most homes in the region are heated through natural gas combustion. Additionally, appliances like stoves, hot water heaters, and driers often rely on natural gas. Electrification combined with a carbon-free grid is key in reducing emissions in this sector. Home heating and cooling alternatives such as air source heat pumps can lower emissions. Similarly, fully electronic appliances are readily available as alternatives to those requiring natural gas. Lastly, promoting LEED Gold and other green building standards for new buildings and weatherization for existing buildings can reduce overall energy demand.
The cost of our energy system does not affect all residents equally. The "energy burden" of a household is the percentage of income spent on energy bills. Across the U.S., Black, Hispanic, American Indian, older adults, and low-income residents tend to have higher energy burdens (a high energy burden is spending more than 6% of your monthly income on energy costs). In the Twin Cities region, where the median energy burden is 2.2%, the median energy burden of low-income households is 6.6%243 Energy efficiency programs targeting low-income households can decrease energy burdens and ensure the benefits of the clean energy transition are felt equally across the region.
Figure 6.2: Residential greenhouse gas emissions (in metric tons of CO2e) by county in 2021
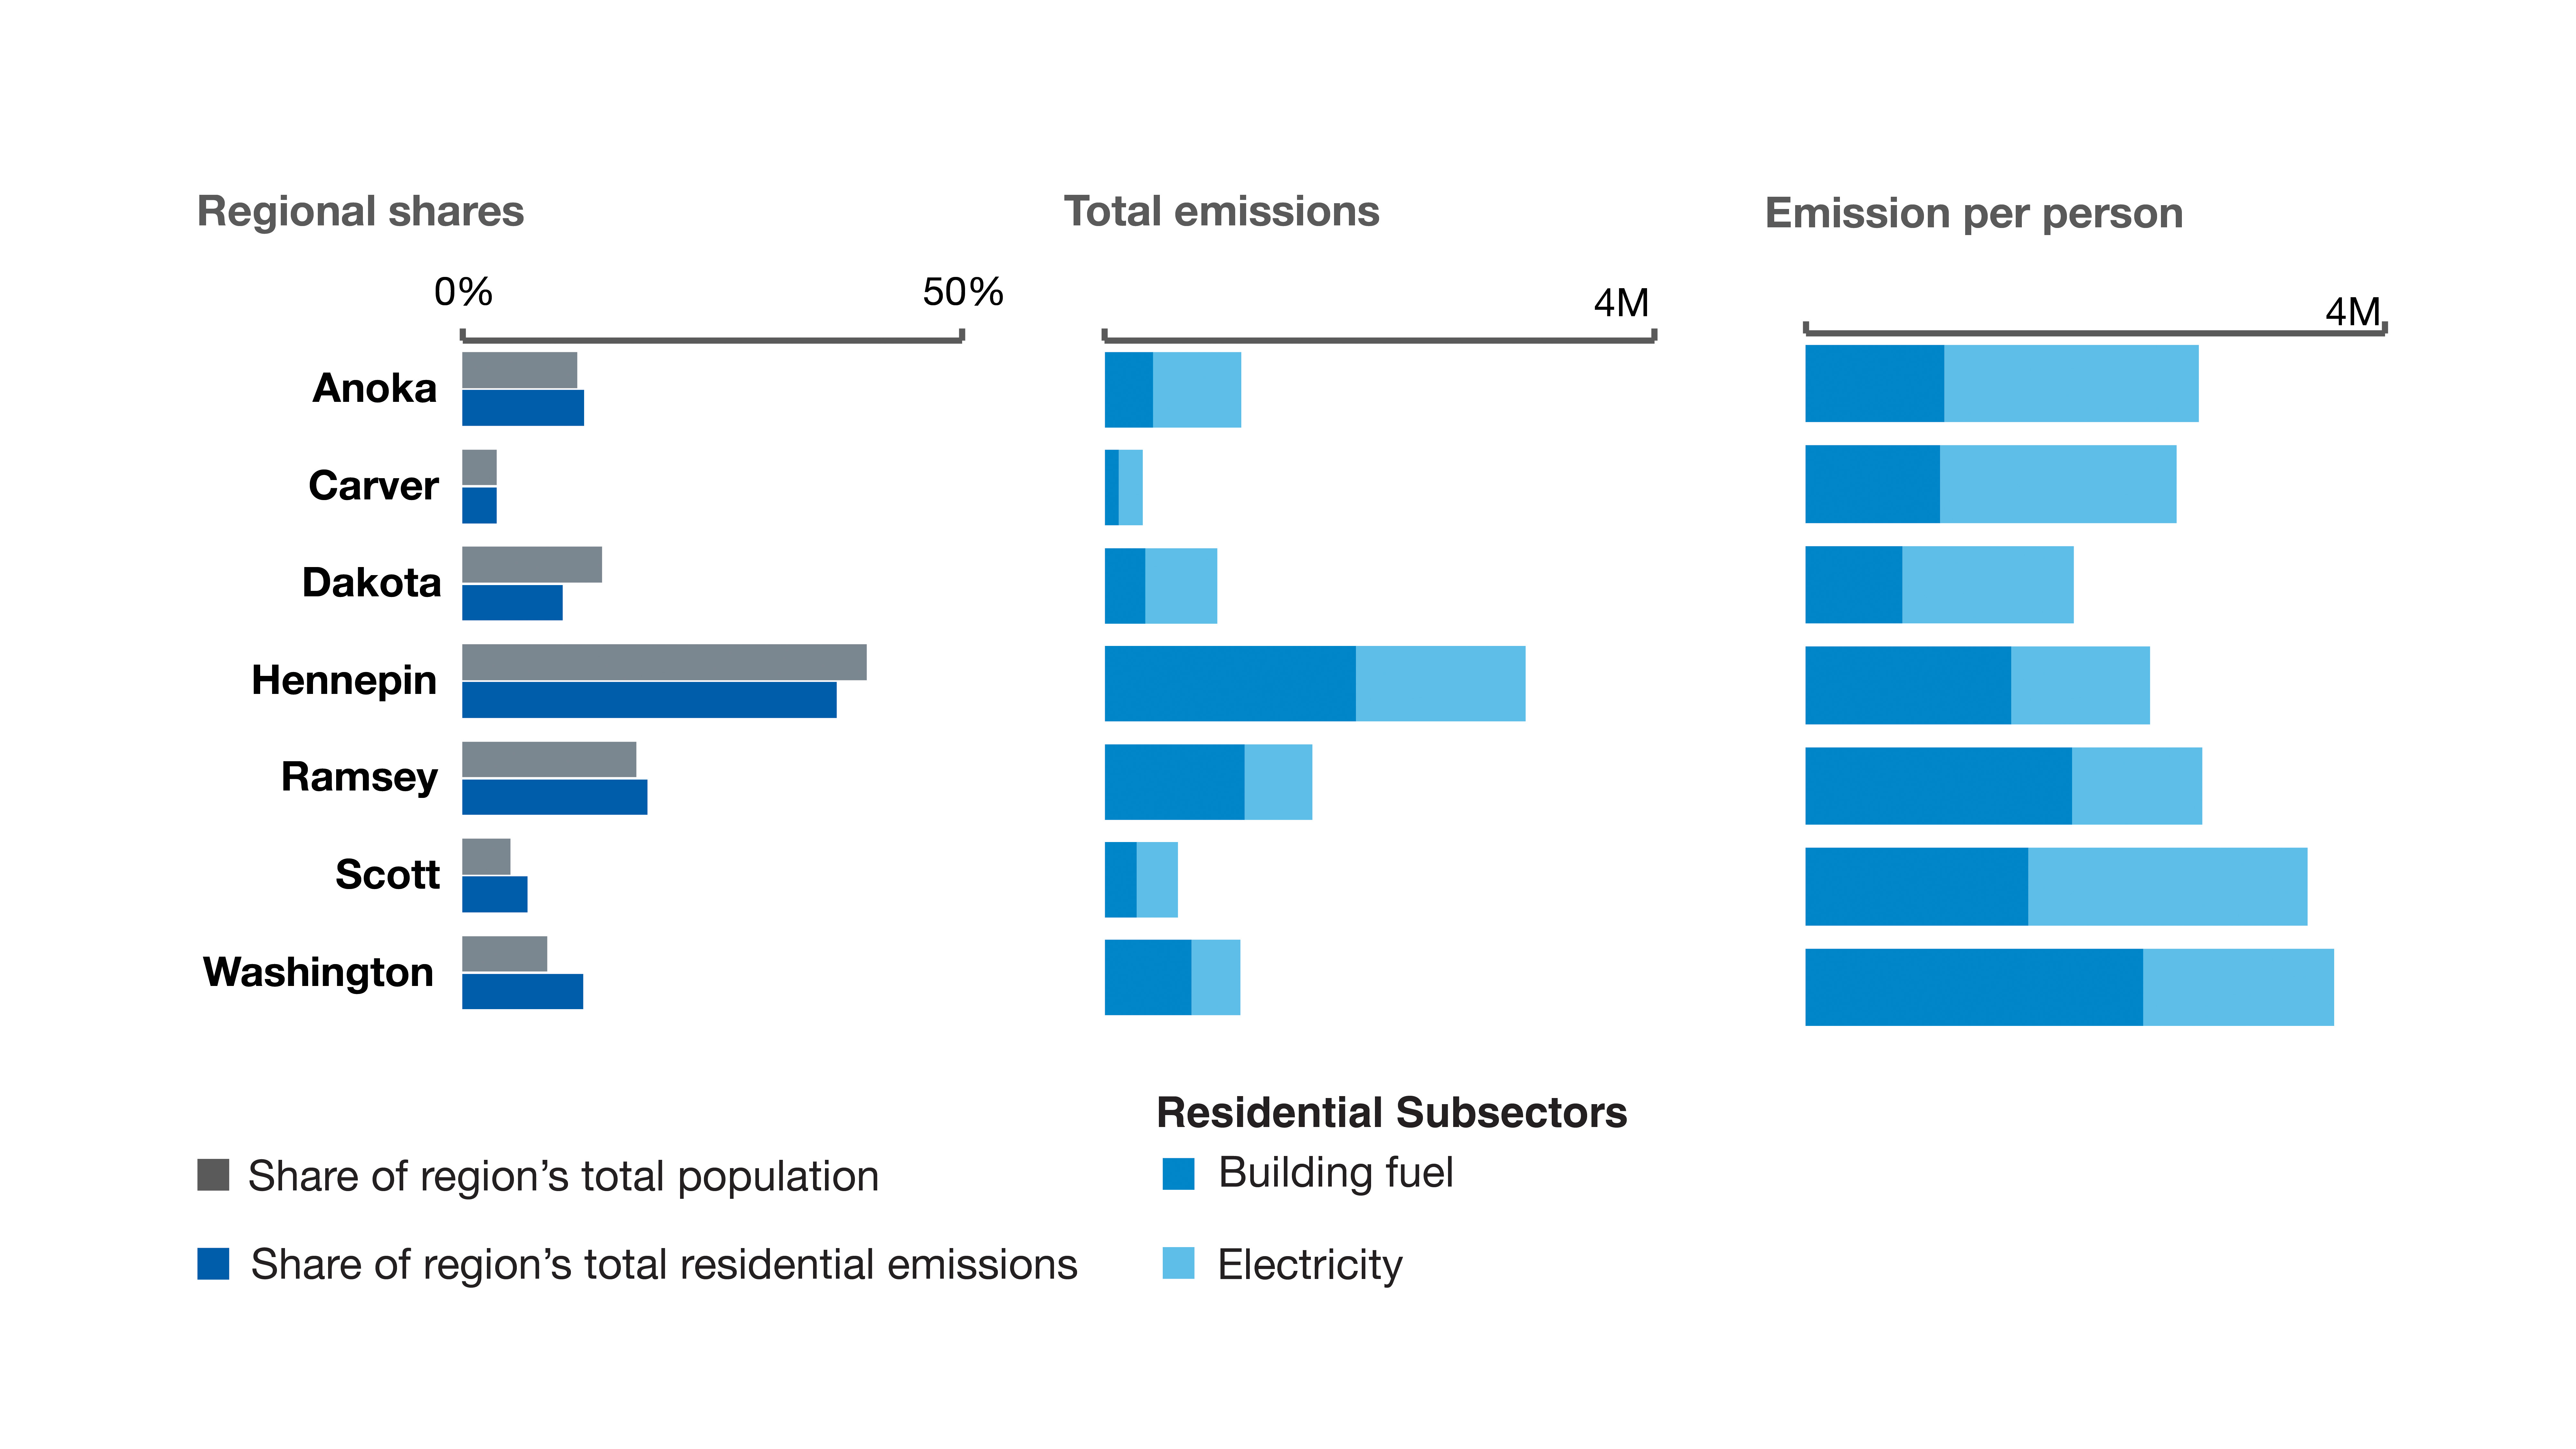
Source: Metropolitan Council analysis of county-level utility energy delivery reports, EPA Emissions and Generation Resource Integrated Database, and National Renewable Energy Laboratory data
Commercial
Businesses rely on natural gas for heating and appliances (for example, gas stoves in restaurants). Building weatherization can reduce heating and cooling demands. The commercial sector can promote similar policies for green building and appliance electrification as the residential sector but may additionally be able to leverage more cost intensive but beneficial heating technology such as geothermal heat pumps and district energy in commercially dense areas.
Figure 6.3: Commercial greenhouse gas emissions (in metric tons of CO2e) by county in 2021
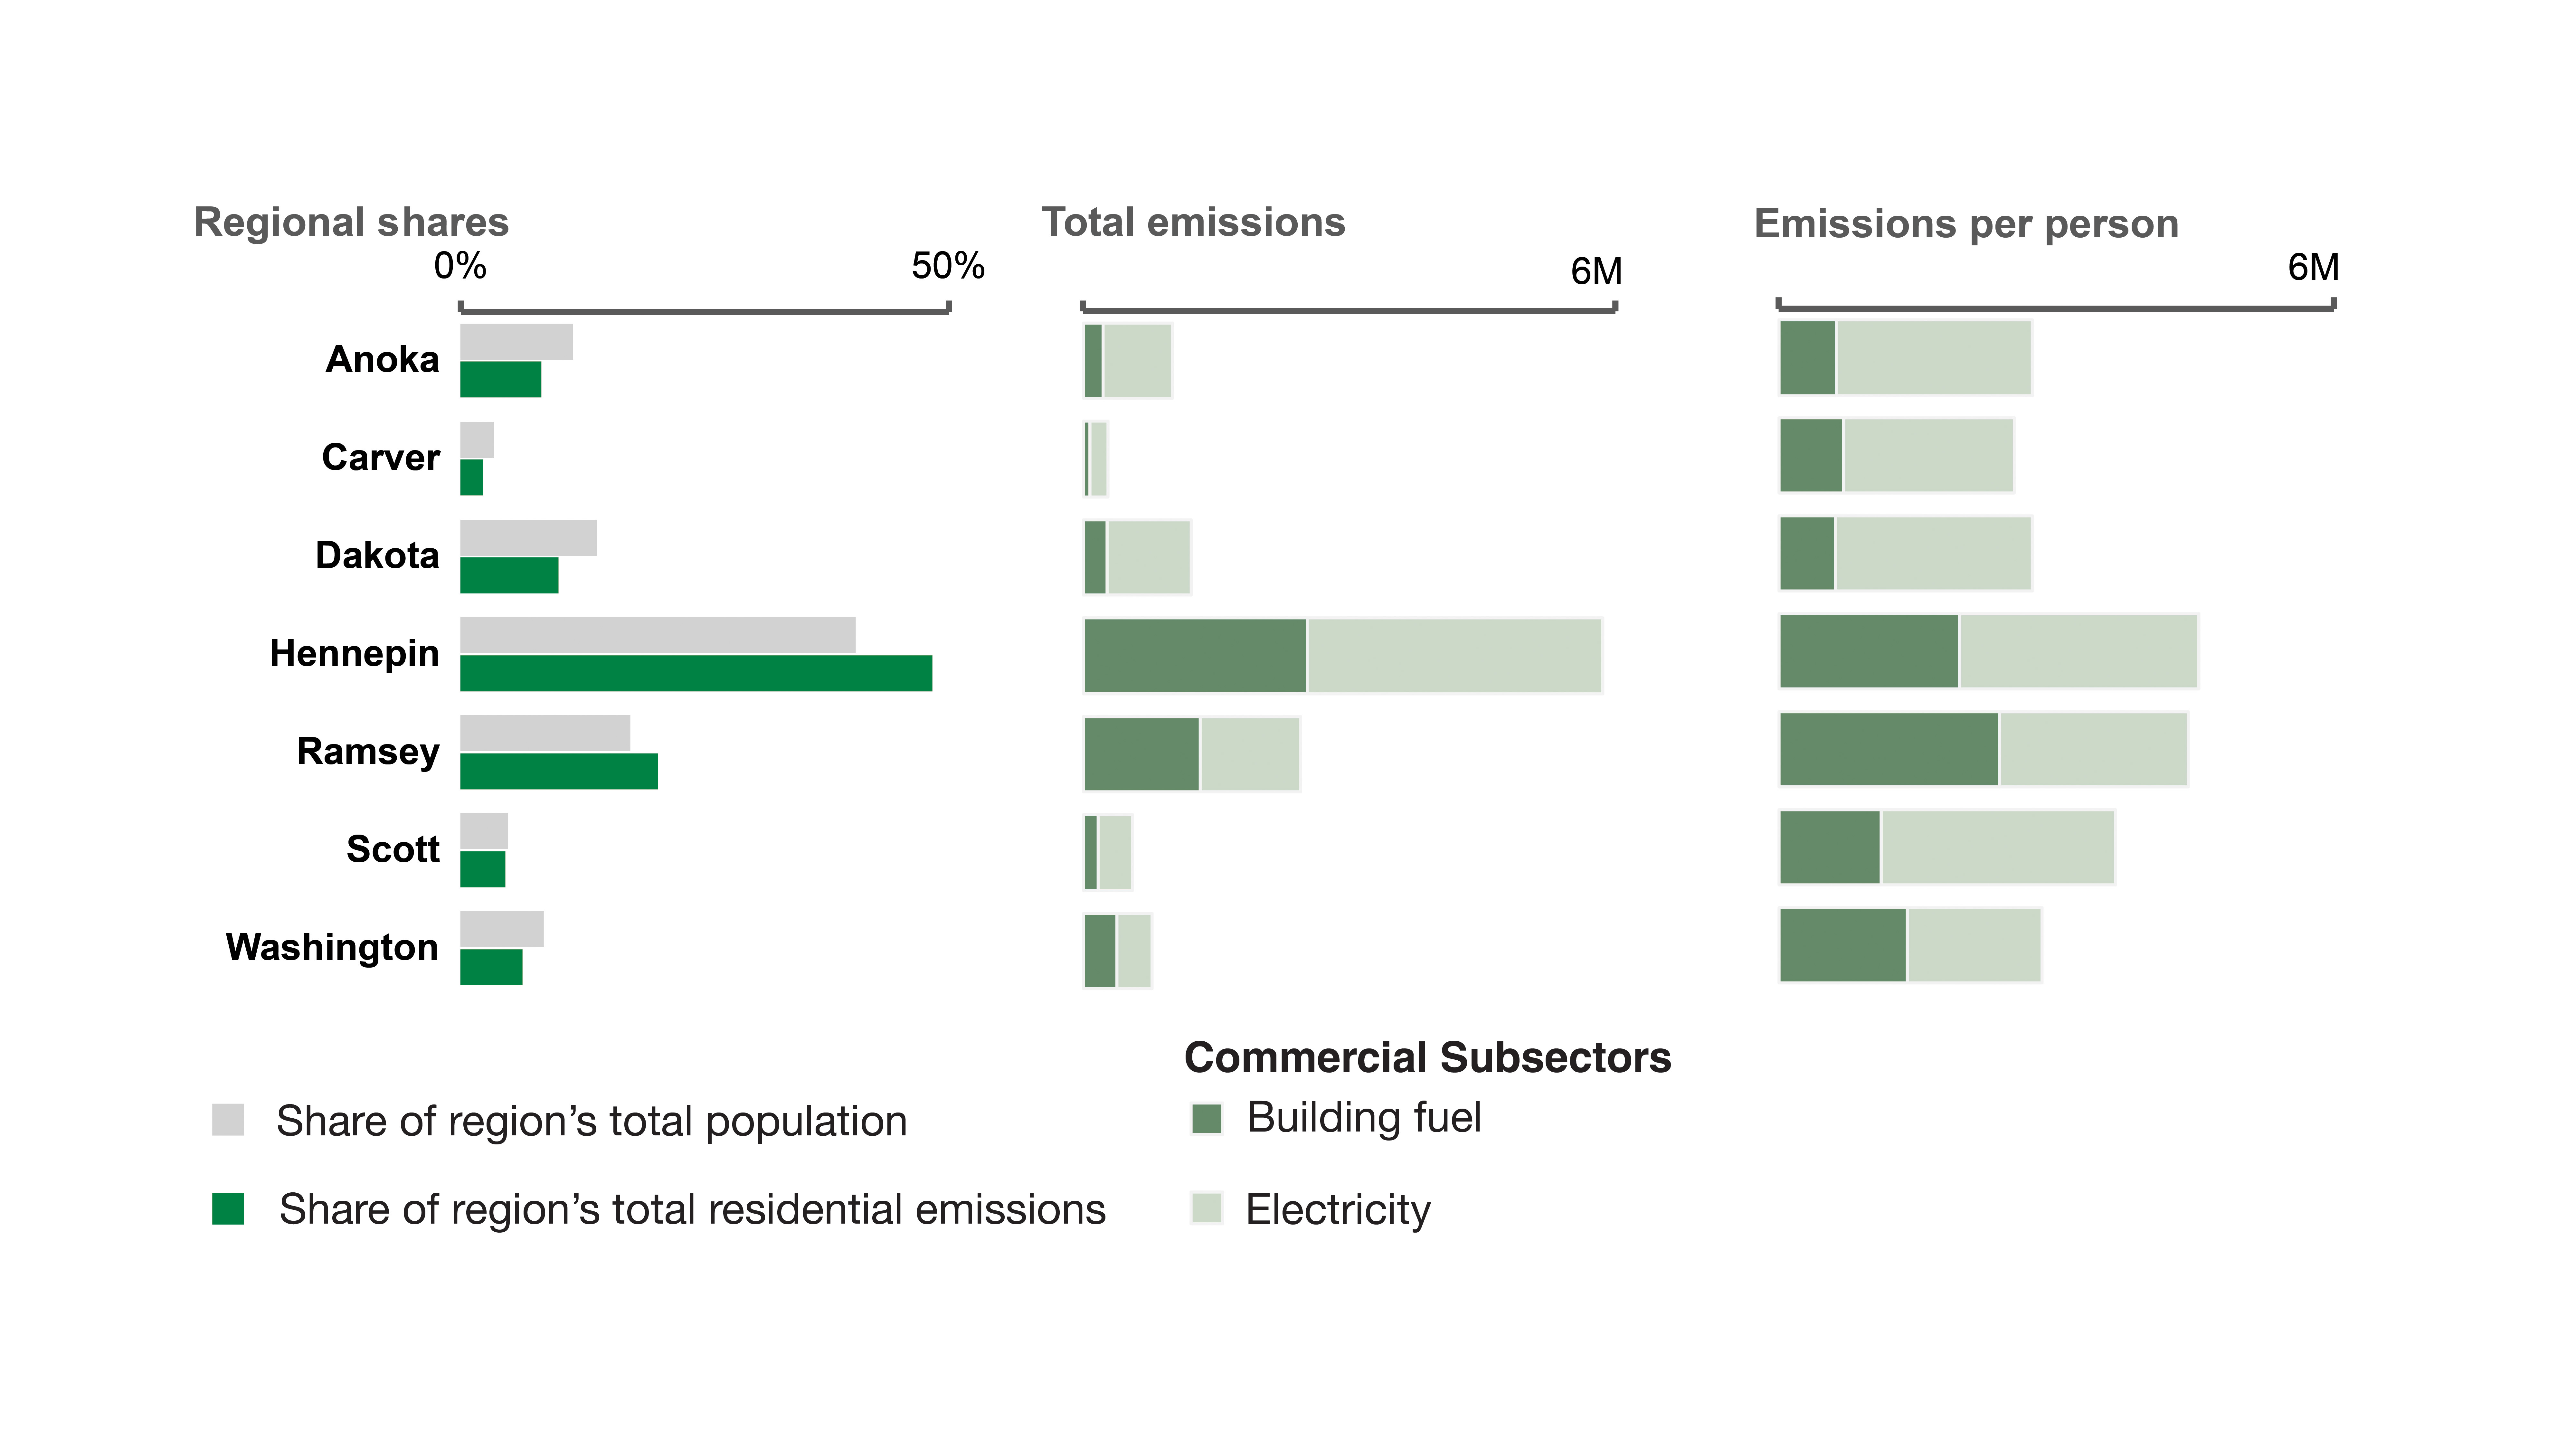
Source: Metropolitan Council analysis of county-level utility energy delivery reports, EPA Emissions and Generation Resource Integrated Database, National Renewable Energy Laboratory data and EPA Greenhouse Gas Reporting Program.
Industrial
Industrial facilities use natural gas for building heat and also emit greenhouse gases through extensive fuel combustion for industrial processes. The industrial processes themselves can emit greenhouse gases, such as oil refining or the manufacture of electronics and semiconductors. Industrial processes also tend to emit additional co-pollutants with more directly adverse public health effects. As such, the pathway to decarbonization for this sector is more varied and technical than electrifying building heat. Nonetheless, electrification is expected to be heavy in this sector to meet Minnesota’s 2050 net-zero goal, emphasizing the need for increased and carbon-free electricity generation.
Figure 6.4: Industrial gas greenhouse gas emissions (in metric tons of CO2e) by county in 2021
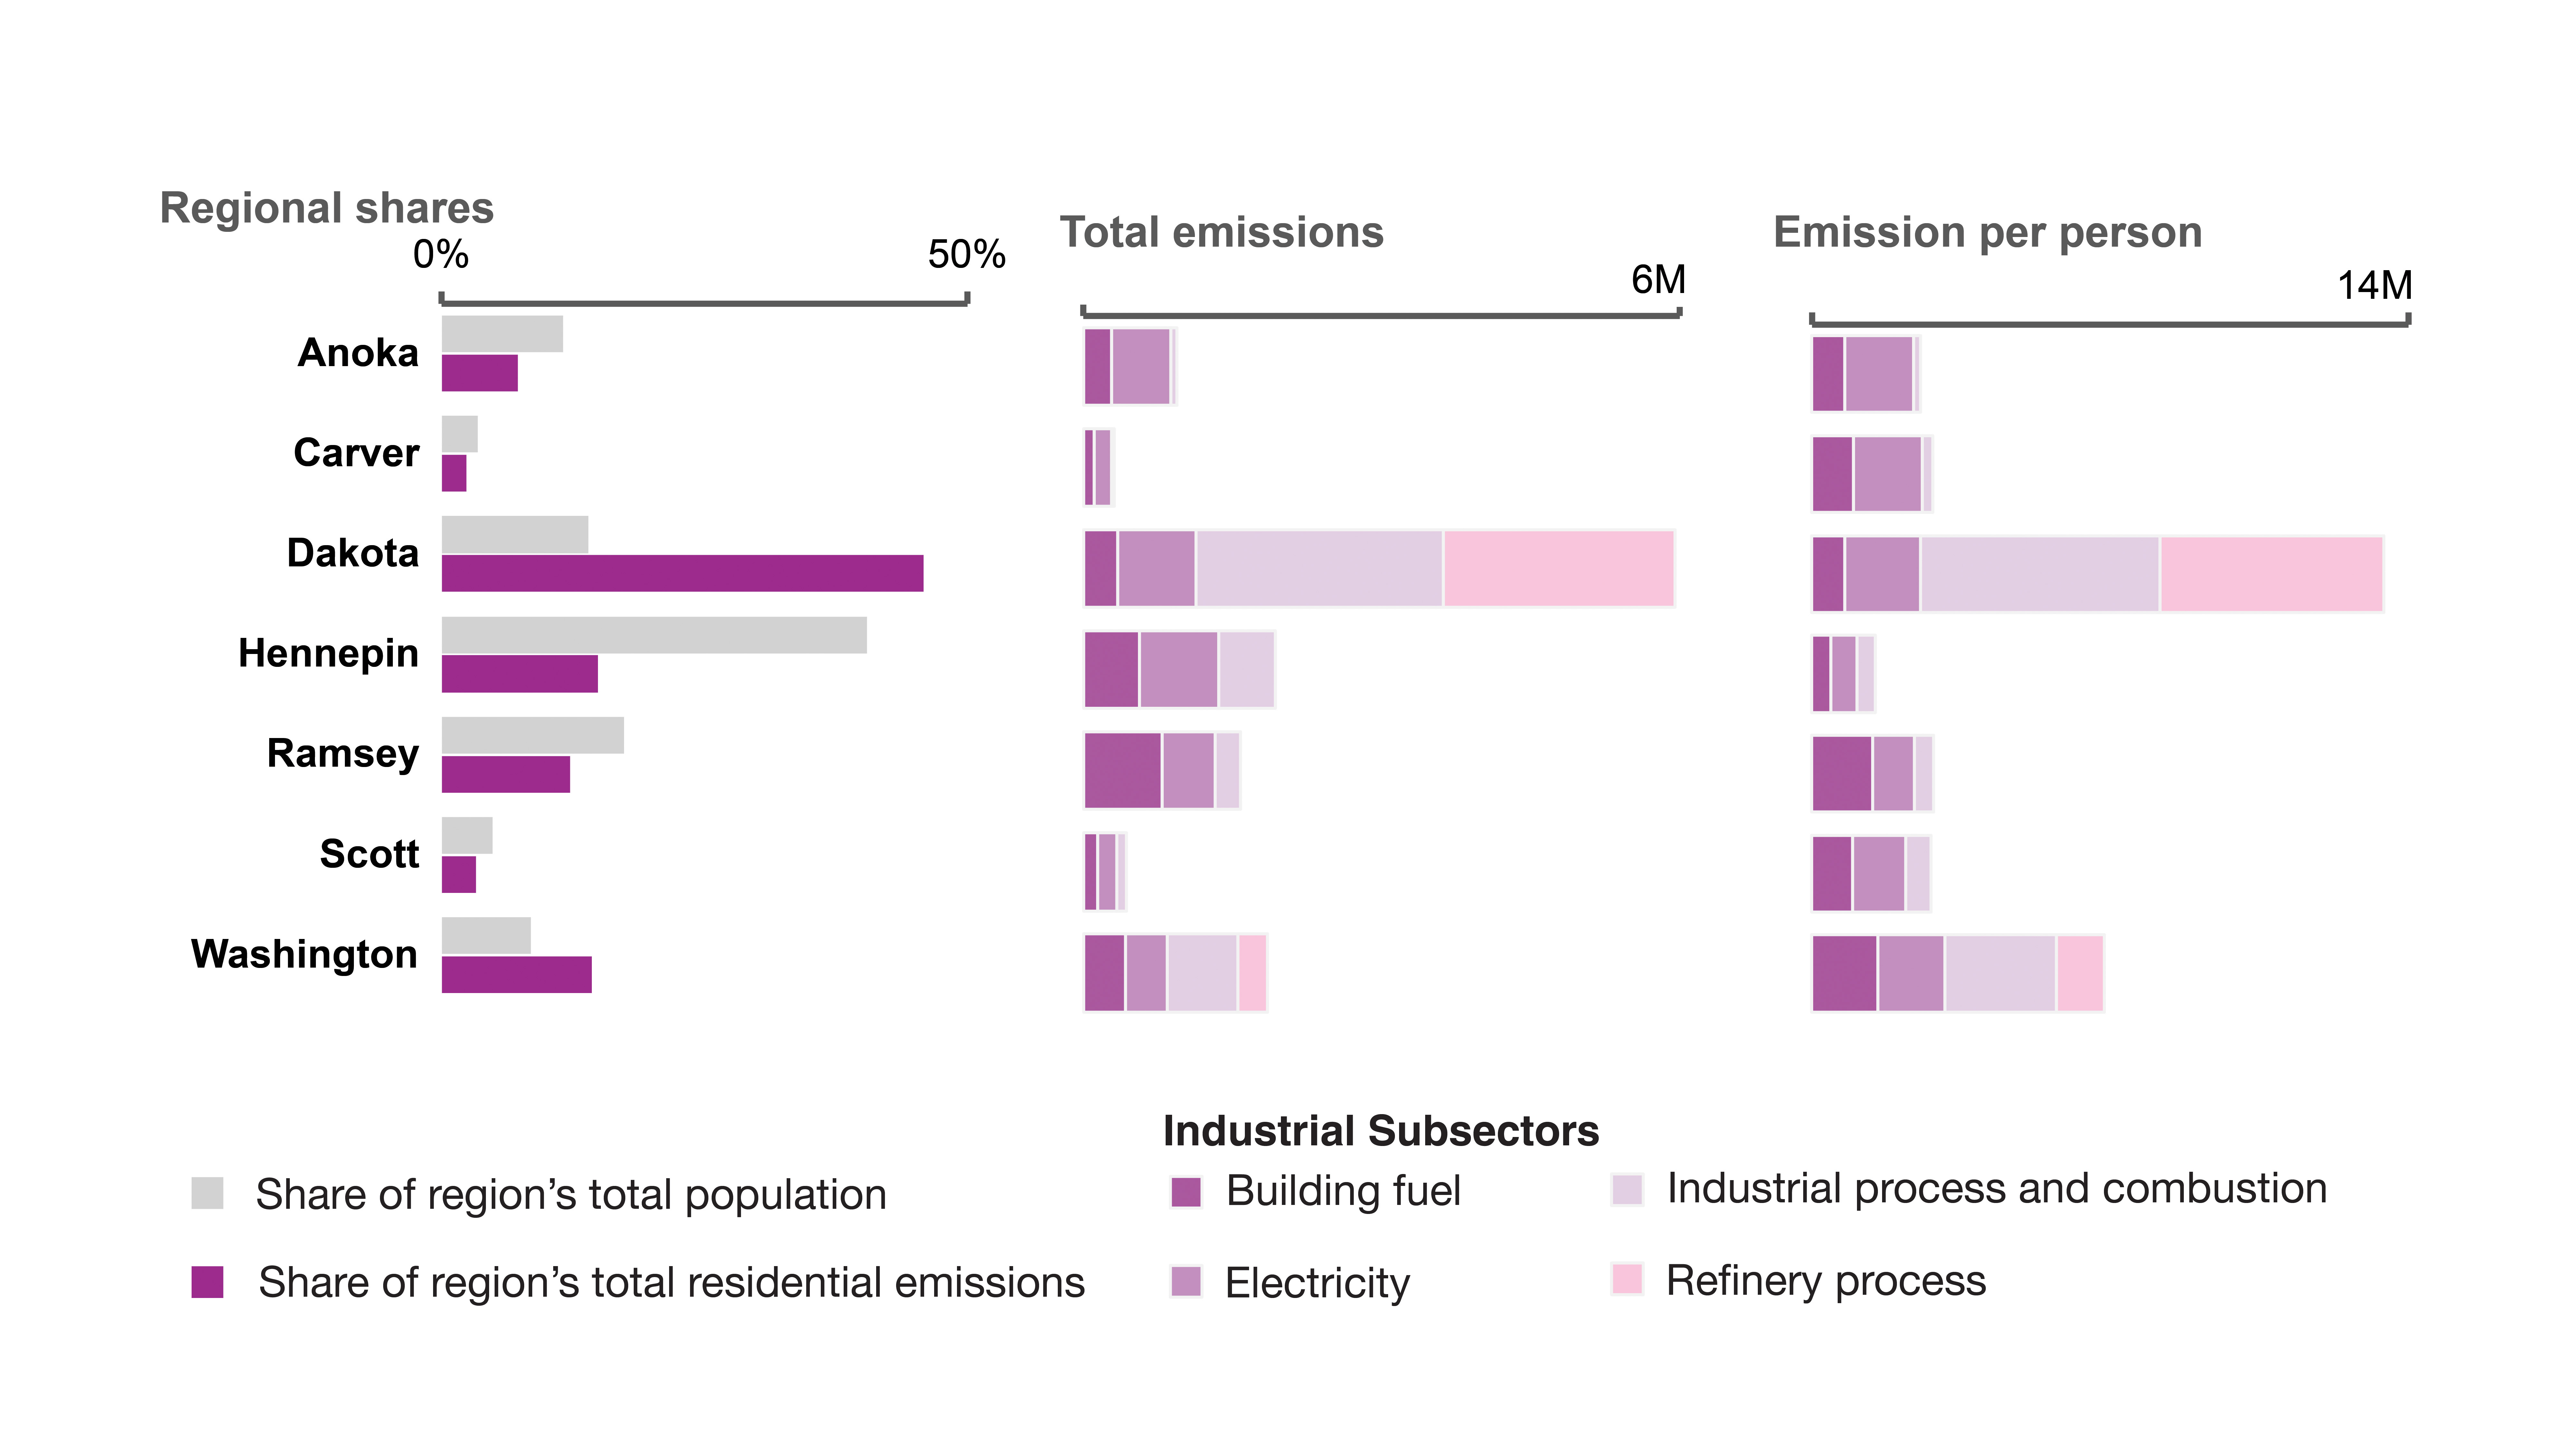
Source: Metropolitan Council analysis of county-level utility energy delivery reports, EPA’s emission factor hub, and National Renewable Energy Laboratory data.
Transportation emissions
The Met Council’s 2024 regional greenhouse gas emissions inventory244 shows that transportation makes up approximate 33% of the region’s greenhouse gas emissions, compared with 25% of emissions statewide as reported in the Minnesota Pollution Control Agency’s statewide 2020 greenhouse gas emission data.245 In the regional inventory, 58% of transportation emissions come from passenger vehicles, 28% comes from heavy duty vehicles, and the remaining 14% come from aviation.
A MnDOT analysis of transportation emissions calculated how much current state emission projections will exceed the state’s net-zero emission target and then allocated emission reduction targets to the seven-county Met Council region based on population proportion. Specifically, the seven-county region should reduce annual surface transportation emissions by 4,024,000 metric tons of CO2e in 2030 and by 9,626,000 metric tons of CO2e in 2050. Cumulatively, this would require approximately 44,000,000 less metric tons of CO2e be emitted from surface transportation in region from 2025 to 2050 below what is currently forecast. Additionally, statewide non-surface transportation (for example, aviation and railroad) emissions have annual reduction goals of 523,000 and 3,565,000 metric tons of CO2e per year in 2030 and 2050, respectively.
Figure 6.5: Transportation greenhouse gas emissions (in metric tons of CO2e) by county in 2021
![]()
Source: Metropolitan Council analysis of the EPA National Emissions Inventory database.
The Climate section of the Transportation Policy Plan chapter addresses strategies to reduce regional transportation-related emissions, including electric vehicle charging infrastructure and reductions in vehicle miles traveled (VMT). Other modal specific chapters support a shift to lower emitting modes of transportation than driving alone. Both electrification and VMT reduction have important co-benefits, including public health and reduced transportation costs; both also have challenges, including needed public investments and public awareness.
Waste emissions
Greenhouse gas emissions from the waste sector (landfills, waste-to-energy facilities, composting, recycling, and wastewater emissions) make up less than 5% of the region’s greenhouse gas emissions. Of these emissions, the Met Council only has control over emissions related to our wastewater treatment facilities. The Met Council’s Climate Action Work Plan drives our work to reduce emissions from our wastewater processes.
Figure 6.6: Waste-related greenhouse gas emissions (in metric tons of CO2e) by county in 2021
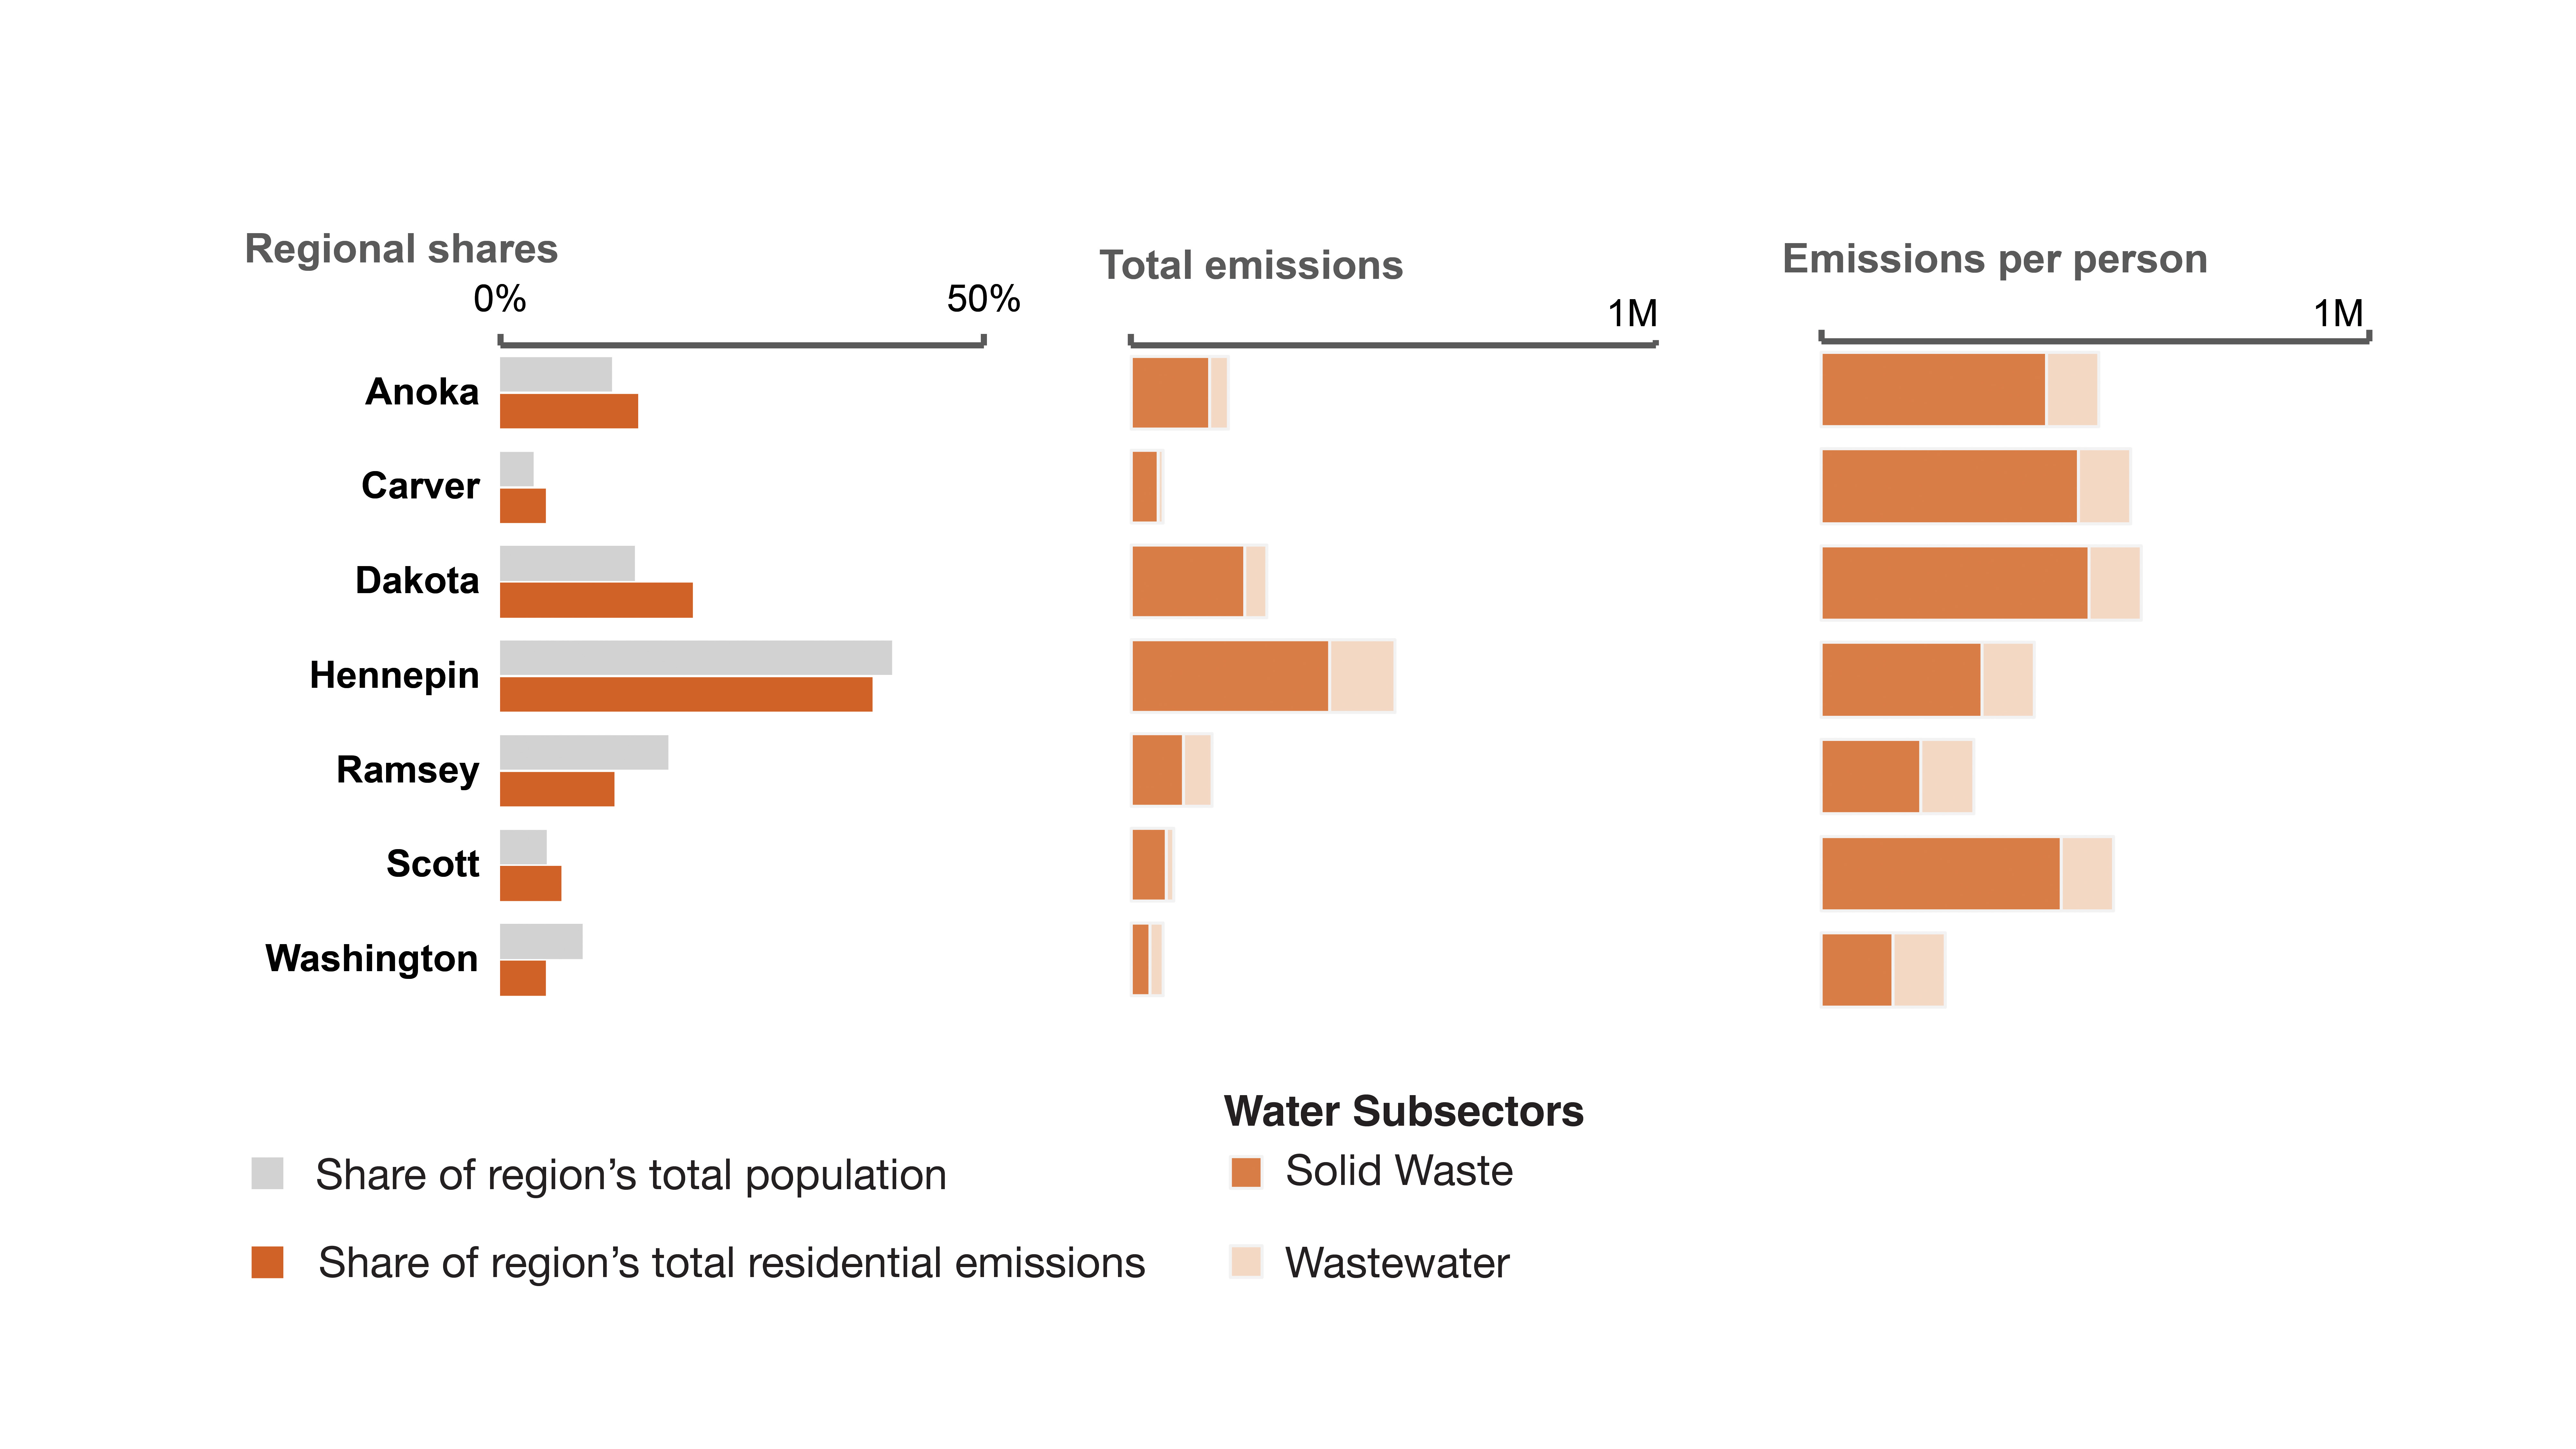
Source: Metropolitan Council analysis of MPCA SCORE database (solid waste) and EPA’s State Inventory Tool (wastewater).
Landfills, waste-to-energy facilities, composting, and recycling strategies for the region are overseen by the Minnesota Pollution Control Agency.246 As such, Imagine 2050 does not focus on policies and actions that reduce solid waste-related emissions and instead defers to the MPCA’s plan. However, the Met Council commits to collaborating with counties, local governments, and transportation authorities to reduce greenhouse gas emissions associated with waste management.
Agricultural emissions
Agricultural emissions are the smallest emission sector in the region, accounting for less than 2% of the region’s emissions, while they account for over 33% of the state’s total emissions. Accordingly, Imagine 2050 does not focus on policies and actions to reduce agricultural emissions and instead defers to the state Climate Action Framework.
Figure 6.7: Agricultural greenhouse gas emissions (in metric tons of CO2e) by county in 2021
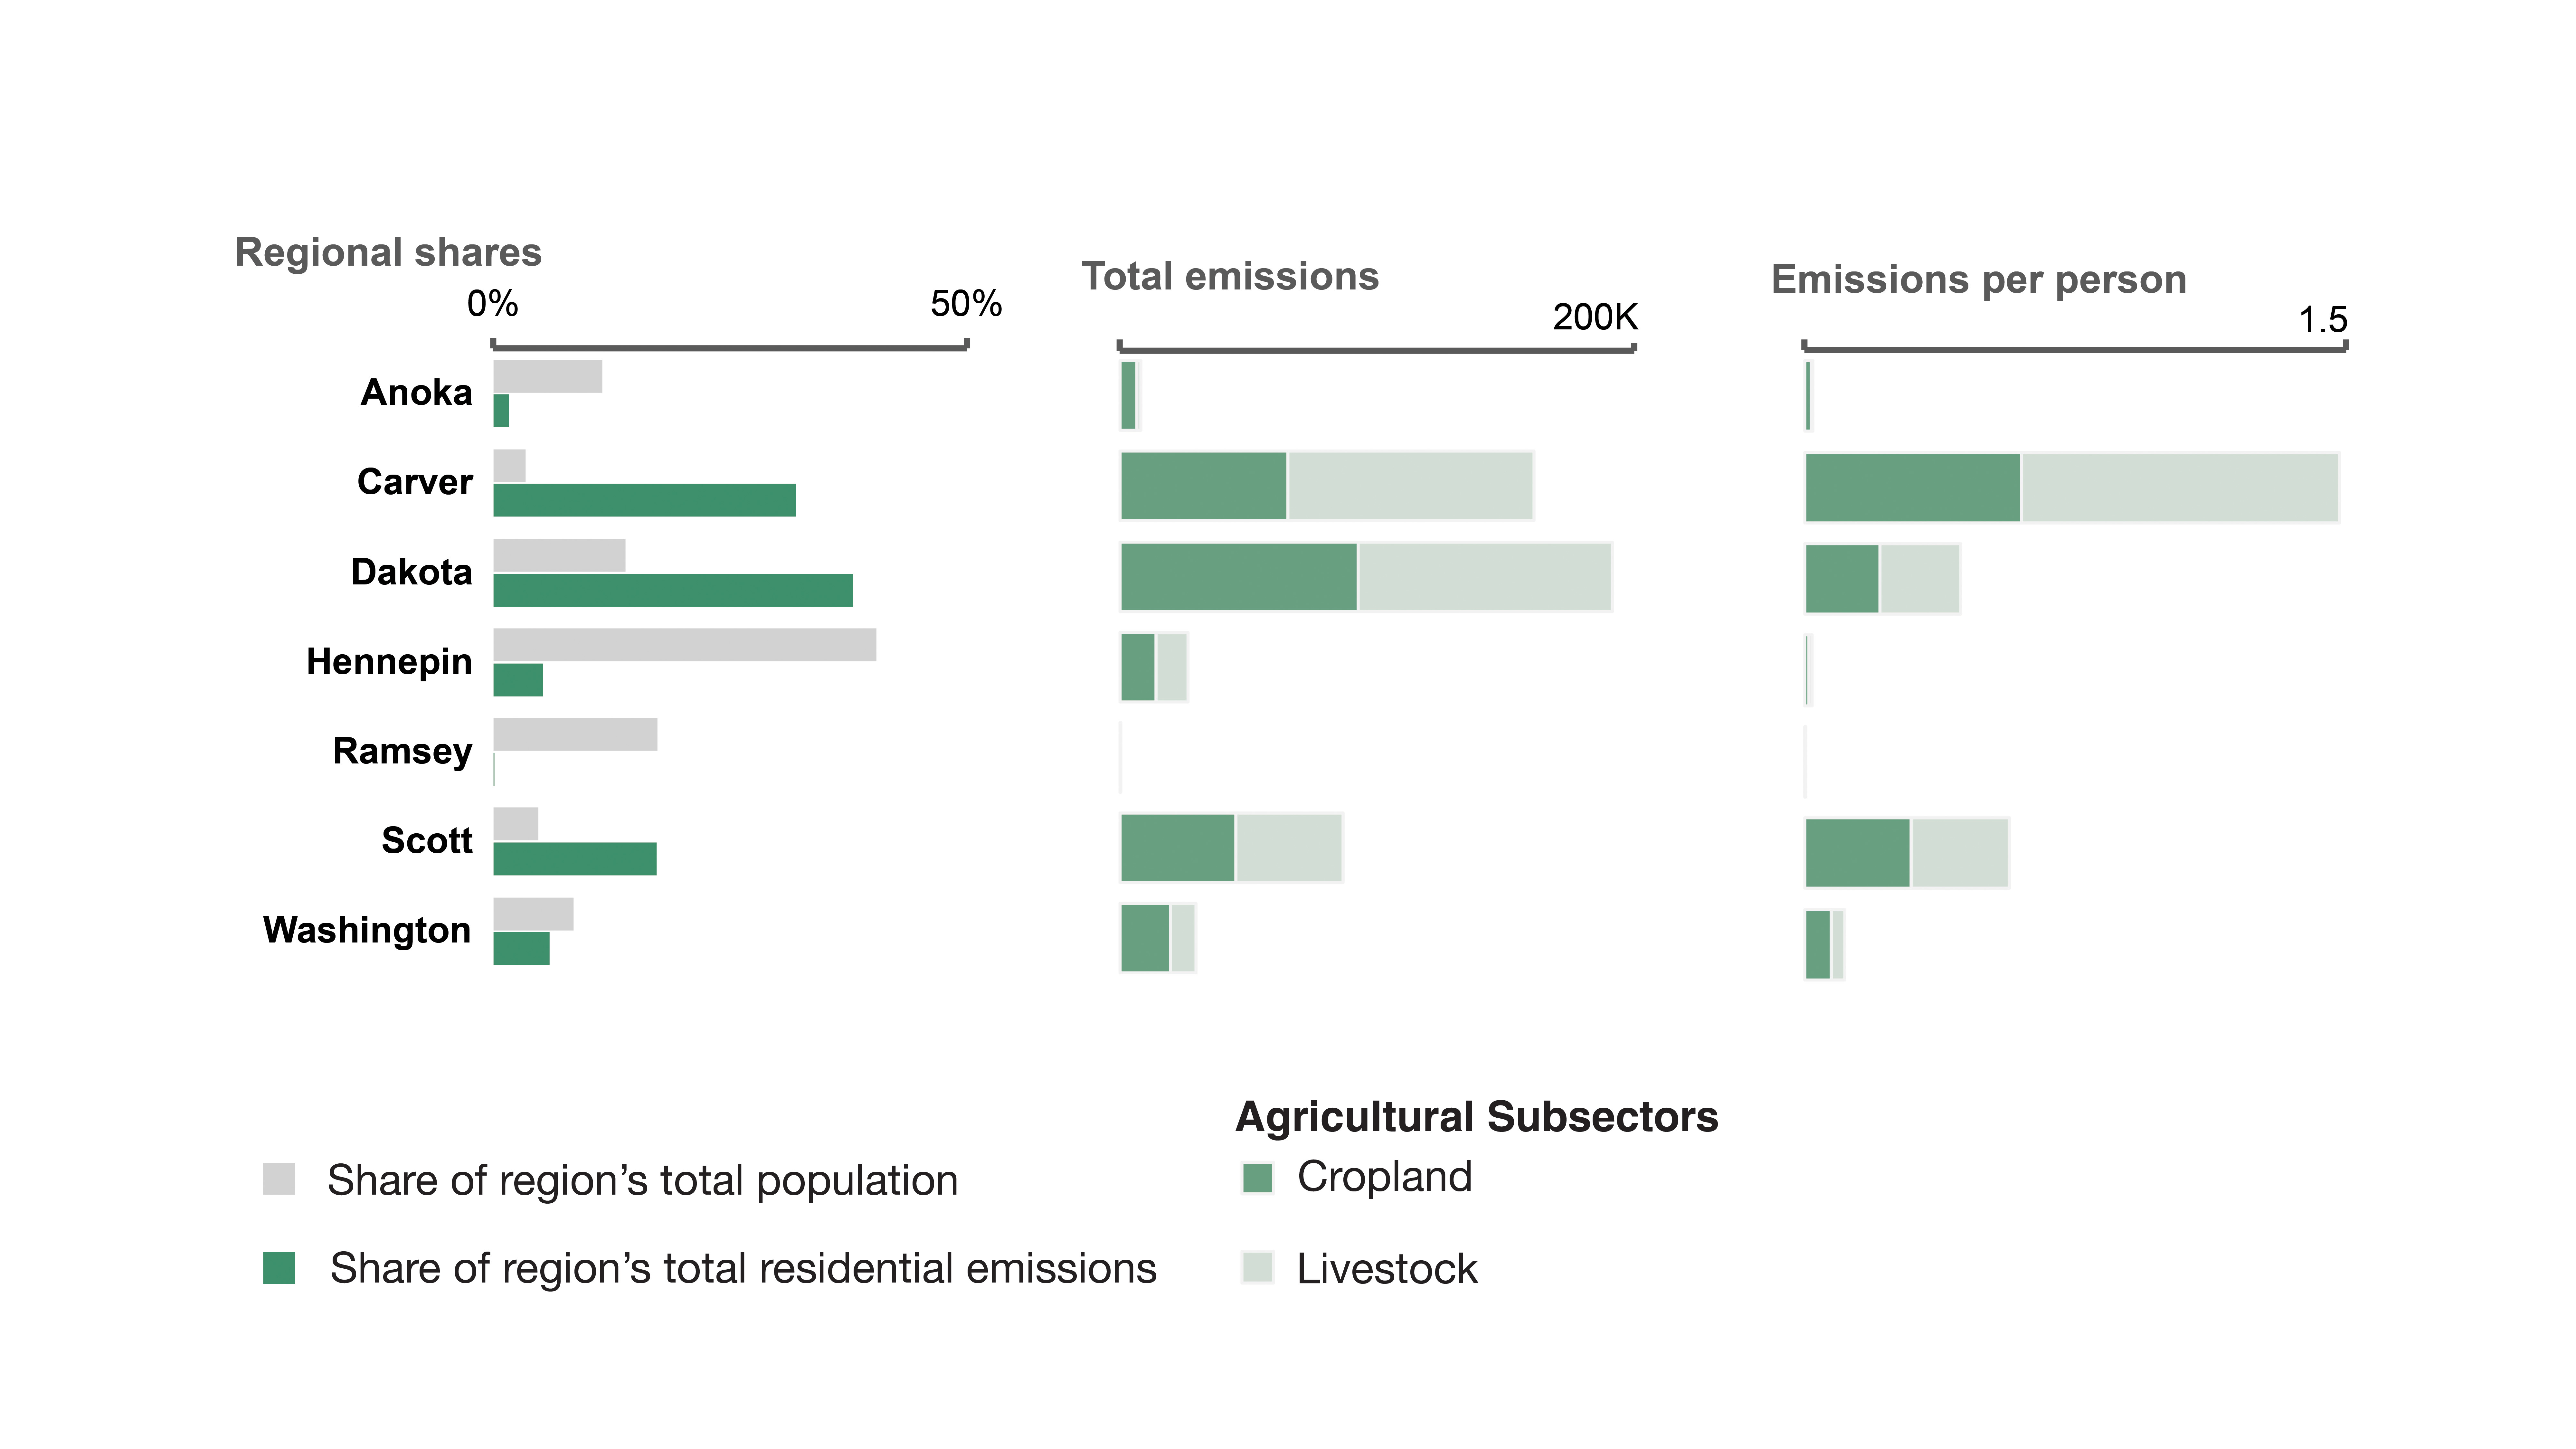
Source: Metropolitan Council analysis of USDA farm census data and EPA State and Inventory Tool data
Climate change impacts
Evidence of climate change clearly exists within our region today, and we expect climate impacts to increase and intensify.
Overburdened communities, natural systems, and infrastructure are most likely to be affected. Temperatures are rising and precipitation patterns are changing. Each of the top 10 combined warmest and wettest years on record in Minnesota occurred between 1998 and 2020.247 The Met Council’s Regional Climate Vulnerability Assessment (Metropolitan Council, 2018, p. 2) identifies the region’s top climate hazards as warming winters, extreme rainfall, heat waves, drought, and intense storms. These risks are expected to amplify both direct and indirect consequences to people, infrastructure, and ecosystems.
According to researchers from the Universities of Maryland and North Carolina, climate conditions in the Twin Cities metro area will look more like northern Oklahoma in the future. By 2080, the metro’s climate will be better suited to grasslands and shrubs like those found in northern Oklahoma than to the mixed forests that currently fill our seven counties.248
"Having a plan for how to deal with [climate disasters] as a community is important. And naming these things as disasters if they are fueled by climate change is important so that people see that things are happening now."
-Local high school student
Rising winter temperatures
"Today is my birthday, and I usually see snow, but not this year."
- Urban Roots youth participant
Our winters are warming faster than our summers. In the last 50 years, average daily winter low temperatures have risen more than 15 times faster than average daily summer high temperatures. The winter average daily low temperatures have risen from -2°F to 2°F.249
Warming temperatures in Minnesota have the potential for creating more freeze/thaw cycles through the winter and early spring. These cycles can be hard on streets and highways, creating more potholes. Another implication of more melting and freezing is a potential increase in the use of salt on roads and sidewalks to keep them easily passable. However, this salt eventually runs off into area lakes, rivers, and streams, creating a permanent environmental pollutant. A recent Met Council study shows that chloride levels increased between 1999 and 2019 in nearly all 18 streams that were studied in the metro area, some at alarming levels. Statewide, 41% of all chloride in lakes, streams, and rivers comes from de-icing salt. Stabilizing chloride levels will be critical to maintain water quality and ecosystem health for our highly valued waters.
Extreme heat and droughts
Minnesota will see more extreme heat days and drought events in the coming decades. The number of days with a temperature above 100°F in the region could increase to 11 by the middle of the century and 30 by the end of the century.250 Extreme heat and drought stress water resources, increasing water supply costs and straining aquatic ecosystems. Periods of extreme heat are also particularly concerning for the Twin Cities region, which typically sees more heat events per year than the rest of the state. Temperatures can differ by over 10°F across neighborhoods within Minneapolis, and these temperature disparities align with formerly redlined and disinvested areas.251 People living in these areas can experience increased illness and even death during extreme heat events. Extreme heat also has economic ripple effects as it makes outdoor work unsafe and over time, can lead to more rapid degradation of infrastructure.
More high frequency and intense precipitation events
"I think about the plants in our environment. If you look at the trees, this year, they shed their leaves early; they think they're supposed to be doing things too early."
-Urban Roots youth participant
Rain events that drop heavy precipitation in a short period are becoming more common in our region. Long-term observations have shown a dramatic increase in major rainstorms in Minnesota, which are projected to keep increasing. More rainstorms lead to more erosion and polluted rainwater runoff which affects water quality across the region. Major rain events also increase flooding risks, which can result in safety, accessibility, and property damage concerns. During a flood event, roads may be impassable or inaccessible to those with limited mobility and transportation services may be disrupted. Flooding also has long-term impacts through property damage, which can be particularly hard-hitting in low-income communities where repairs are financially challenging.
Disrupted growing seasons
Climate change is expected to negatively impact species’ growing conditions, threatening agriculture, biodiversity, and the integrity of ecosystems. Warmer and wetter conditions can increase the spread of pathogens and parasites, such as the West Nile Virus from mosquitos and Lyme disease from ticks, which pose threats to people working or recreating outside. Additionally, the region’s natural flora and fauna have evolved to live within the area’s specific weather patterns. Increased temperatures harm many species and alter behavior patterns, making them vulnerable to disease and damage. Populations of introduced species are expected to rise, which can lead to ecosystem impacts including tree loss, decreased water quality, and loss of wildlife and habitat. Public green space maintenance will require thoughtful planning as species survival shifts in response to changing climatic conditions.
"Native plants are blooming much earlier than they're supposed to, so it messes up the cycle. When we think about planting a pollinator garden, we plan which plants will bloom at which times, so when they bloom early, it messes up the bees."
-Urban Roots youth participant

The quality of all life in the Twin Cities region depends on abundant, healthy natural systems. Natural systems include land, air, water, vegetation, and wildlife as well as their connections within ecosystems, natural cycles, and human society. Abundant and functioning natural systems nurture ecosystem and public health, allow economies to function and grow, and meet the social, cultural, and spiritual needs of people living in the region.
Natural systems are everywhere. However, they may be more connected and healthier in some areas and more fragmented and polluted in other areas. A comprehensive approach to protecting, integrating, and restoring natural systems ensures that large, biodiverse areas are preserved, while we enhance neighborhood-scale natural systems that help connect residents to nature at their doorstep.
Historically, regional planning viewed natural systems through resource management and conservation lenses. Policies and management approaches have considered land, air, water, vegetation, and wildlife as things to be used primarily for the benefit of humans and human economies. We've seen the outcomes of this approach in the region. Habitat and biodiversity loss, water pollution, contaminated air, expanses of paved surfaces, and climate change are costly results of not balancing natural systems with other social, cultural, and economic needs. We've also seen that when natural systems are protected and restored, the needs of natural systems are aligned with human needs. The result is improved public and ecosystem health.
Imagine 2050 takes a holistic approach to natural systems, recognizing that natural systems possess intrinsic value; that people, development, and natural systems are intertwined; and that the benefits and consequences of natural system policies are felt by all communities, residents, and living beings.
Natural systems include the land, air, water, vegetation, and wildlife as well as their connections within ecosystems, natural cycles, and human society.
Protecting, integrating, and restoring natural systems means:
- Protect: Steward and maintain natural systems to preserve their intrinsic, ecological, and human benefits for the present and the future.
- Integrate: Incorporate and prioritize the needs of natural systems with human development to achieve harmony between built and natural environments.
- Restore: Enhance natural systems degraded by human development to create cleaner land, water, and air that support human and ecological well-being.
Connection to climate change
Climate change threatens the health of natural systems, and healthy natural systems also represent solutions, refuges, and buffers to climate change impacts. Ecosystems serve as important carbon sinks, taking greenhouse gas emissions out of the atmosphere. This can occur at all scales of natural systems and is especially true for larger open spaces like regional parks. Preserving or adding woody crop land and forests represents opportunities for sequestering carbon while providing additional public and ecosystem health benefits.
Figure 7.1: Natural systems sequestration rates by county in 2021
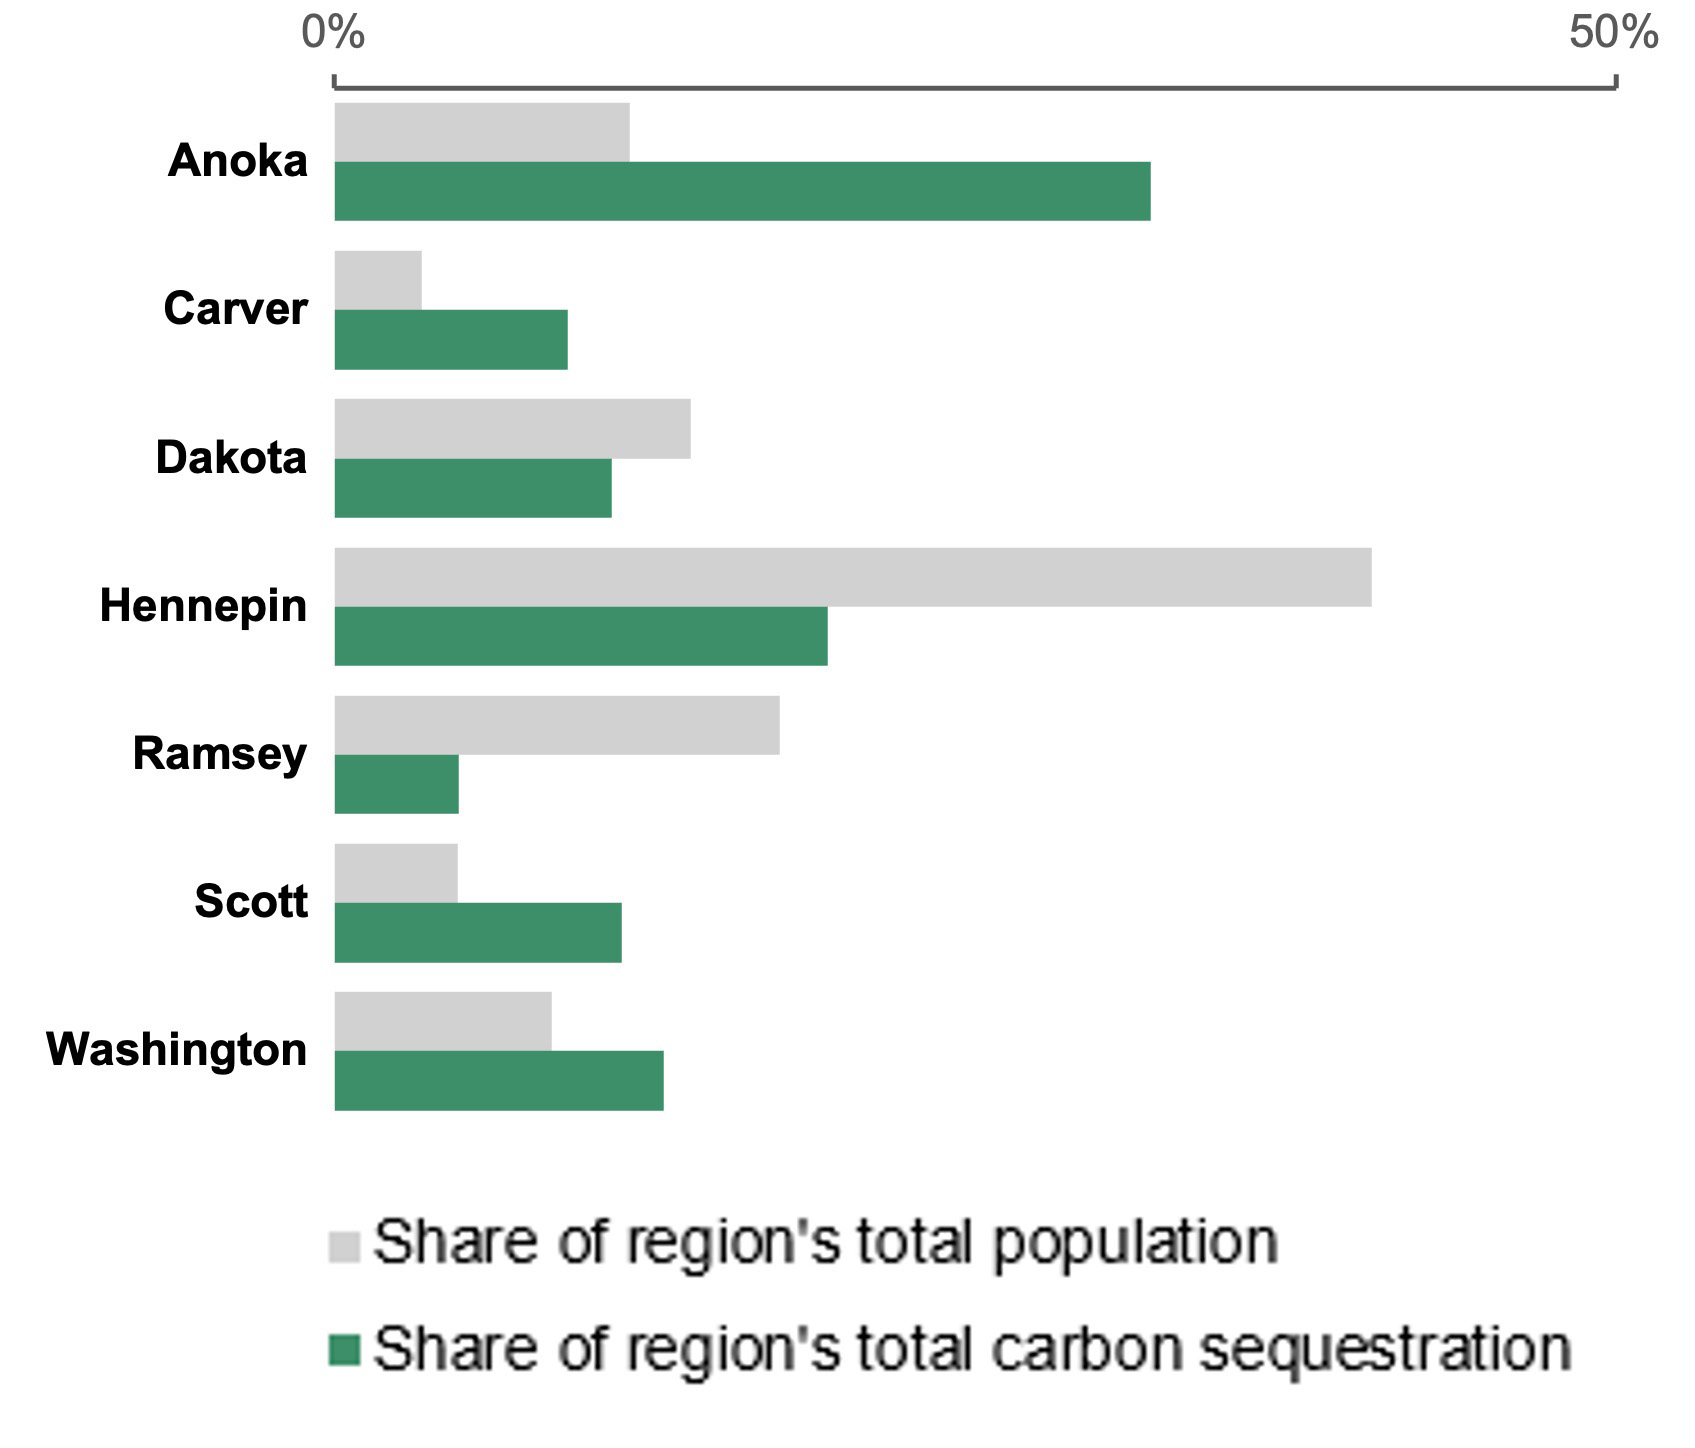
Source: Metropolitan Council analysis of the USGS National Land Cover Database and other primary literature sequestration rates
Restoring natural systems also provides critical benefits as the region experiences more climate impacts. In times of heavy precipitation events, more intact ecosystems better handle large amounts of water and reduce impacts from flooding. More connected green (forests, grasslands, parks, etc.) and blue (lakes, rivers, streams, etc.) spaces provide critical habitat, as plants and animals must also adapt to a changing climate. Additionally, more robust natural systems in urban areas provide people with cooling shade and refuge during extreme heat events, particularly for vulnerable communities that most lack access to these environments.
Wakan Tipi Awanyankapi is a Native-led nonprofit that works to restore and steward urban natural landscapes and create opportunities for cultural connections and healing. Guided by Dakota values, they worked with community partners over many years to restore the Bruce Vento Nature Sanctuary from a polluted dump site to vibrant natural landscape that honors the sacredness of the land to Dakota peoples. Their work now extends across the east side of Saint Paul.
The organization's approach reflects the deep relationship between land and people in Dakota and other American Indian knowledge ways. They host events that strengthen the connection American Indian communities have with the land including Dakota storytelling sessions and plant medicine workshops. Their work highlights the importance of American Indian leadership in restoring the natural systems of the region.
"My vision for natural systems is not only restoring natural habitat, but also adapting our systems. Given climate change, what strategies are feasible resilient, fair, and sustainable? We want to put in place future-thinking changes."
(From engagement with Wakan Tipi staff)
A recent study completed by Earth Economics for The Nature Conservancy on the economic impact of natural climate solutions states that natural climate solutions would provide Minnesota with $37 billion in ecosystem services per year, 5,200 jobs and $148 million in annual wages.252 Not only does nature provide the best defense against the impacts associated with climate change, it also fosters a strong economy and creation of jobs.
Connection to American Indians and traditional knowledge
American Indian people have long recognized that human health and the health of natural systems are intertwined. In the Twin Cities region, the Dakota people have lived in relationship with the land, water, plants, and animals since time immemorial. Deteriorating quality of natural systems in the region coincided with the genocide and displacement of the Dakota people. Reconciliation with the land, water, and American Indian communities will take time and dedicated action; one aspect of this work includes learning from American Indian peoples to be better stewards of our natural systems.
Connection to state efforts and Met Council roles
Roles and responsibilities of the Met Council
The Met Council has influence over certain aspects of natural systems (parks, water, and land use planning) and works with cities, townships, counties, watershed districts, and other partners to protect, integrate, and restore natural systems in the region.
The Met Council works with park implementing agencies to develop and maintain the regional parks and trails system, an important resource in preserving and restoring natural areas. This role stems from state law that charges the Met Council with overseeing the acquisition and development (planning) of and funding for the regional parks system.
The Met Council also ensures that the region has access to clean and plentiful water by providing regional wastewater treatment and integrated water planning services and collaborating with local partners such as municipalities and watershed districts to address water sustainability. These services protect natural systems by safeguarding water quality and quantity as it flows through the region, is used by residents, businesses, and institutions, and returns to the environment.
Finally, the Met Council’s role in regional land use planning supports preserving areas of significant ecological value while guiding development in more urban areas to encourage both higher density and access to green space. Through working with local communities, the Met Council encourages sustainable land use patterns and climate resilient neighborhoods.
The Met Council mapped the land surface temperature from 2016 and 2022 using remote sensing and satellite imagery. The 2022 data is intended to show the heat differences across the region. With the three-day heat wave that occurred during 2016, the data closely approximates the maximum land surface temperature that urban areas may reach. These maps show that developed areas are hotter in temperature than parks, green space, and areas near water bodies. Utilizing this tool can be helpful to mitigate extreme heat in different locations. Read more about the Extreme Heat tool.
State and local roles and responsibilities in managing and protecting natural systems
A range of state agencies work on topics related to natural systems including the Department of Health, Department of Natural Resources, the Board of Water and Soil Resources, Department of Agriculture, and Pollution Control Agency.
State law protects different elements of natural systems and are applicable at different stages of the planning and development process. Some of our natural systems are protected as parks and public lands by federal, state, and local levels of government. Spring Lake Park Reserve in Dakota County, Carlson Avery Wildlife Management Area in Anoka County, and the U.S. Fish and Wildlife Service Louisville Swamp in Scott County are just a few examples of how different levels of government have protected our natural systems.
The St. Croix River is a federally designated National Scenic Riverway with management coordinated among local governments, the National Park Service, and the Minnesota Department of Natural Resources. The Mississippi River has both a federal designation as a National River and Recreation Area253 and as a state designated Critical Area, which requires local governments in the corridor to develop plans that comply with Minn. Rules 6106.0010 – 6106.0180. State shoreland rules (Minn. Rules 6120.2500-3900) set statewide standards that local governments must adopt to manage development along lakeshores to protect water quality.
Minnesota’s Wild and Scenic River regulations establish rules for development within legally prescribed areas along six rivers in the state, with river-specific rules for the Rum River (Minn. Rules 6105.1400-6105.1500) that communities within the region are responsible for implementing. The Wetland Conservation Act is implemented through local land use controls with oversight from the Board of Water and Soil Resources. Like the very natural areas that they seek to preserve and protect, these rules are applicable across all community types in the region, not just in rural areas or just in urbanized areas.
Local and regional governments have authority over land use and manage natural systems within their jurisdictions, working on efforts related to tree planting, land preservation, air monitoring, and more. Through comprehensive planning and through strategic partnerships, local governments have agency over how best to manage natural systems within their jurisdiction. Innovative approaches to development and maintenance can increase the integrity and health of natural systems in and across communities. Several cities across the region have developed tree protection ordinances and other methods for locally protecting natural systems. Washington County, for example, established a Land and Water Legacy Program to purchase land or land interests to preserve water quality, woodlands, and other natural areas in the county.
The City of Woodbury set a goal of having a city-wide tree canopy cover of 40% by 2040 in their 2040 Comprehensive Plan. As of 2020, Woodbury had about 22% tree canopy cover and had seen about a 4% increase in tree canopy in the previous decade. To support further progress toward the goal, the city identified several key opportunities to enhance its urban forest including updating its Urban Forest Management Plan, conducting a comprehensive tree canopy assessment, and enhancing tree planting and preservation practices in Woodbury by revising relevant codes and standards. The City established clear metrics and targets to track progress towards its goal and strives to be a national leader in urban forestry.254
Other rules and programs help prevent pollution in the environment, such as effective management of subsurface sewer treatment systems (SSTS). Minn. Rules Chapters 7080-7083 requires that cities, townships, and counties incorporate those regulations into their local ordinances and programming for managing SSTS.
Risks and opportunities related to natural systems
Air
The air quality of the Twin Cities region is generally good and has been improving over the last few decades.255 However, there is a highly unequal spread of poor air quality in the region. Low-income and disadvantaged communities have higher exposure to pollution like fine particulate matter and diesel pollution.256 These pollutants can come from specific industrial sources as well as dispersed sources like vehicles and can impact ecosystem and human health. Air quality is also increasingly threatened by wildfire smoke, often traveling from other parts of the continent and provoked by droughts worsened by climate change. Finally, overall air temperatures are rising because of climate change, which results in more extreme heat days that stress existing infrastructure and create dangerous conditions for outdoor workers.
Figure 7.2: Low-income communities, communities of color, and Indigenous communities are more likely to live near higher levels of air pollution257
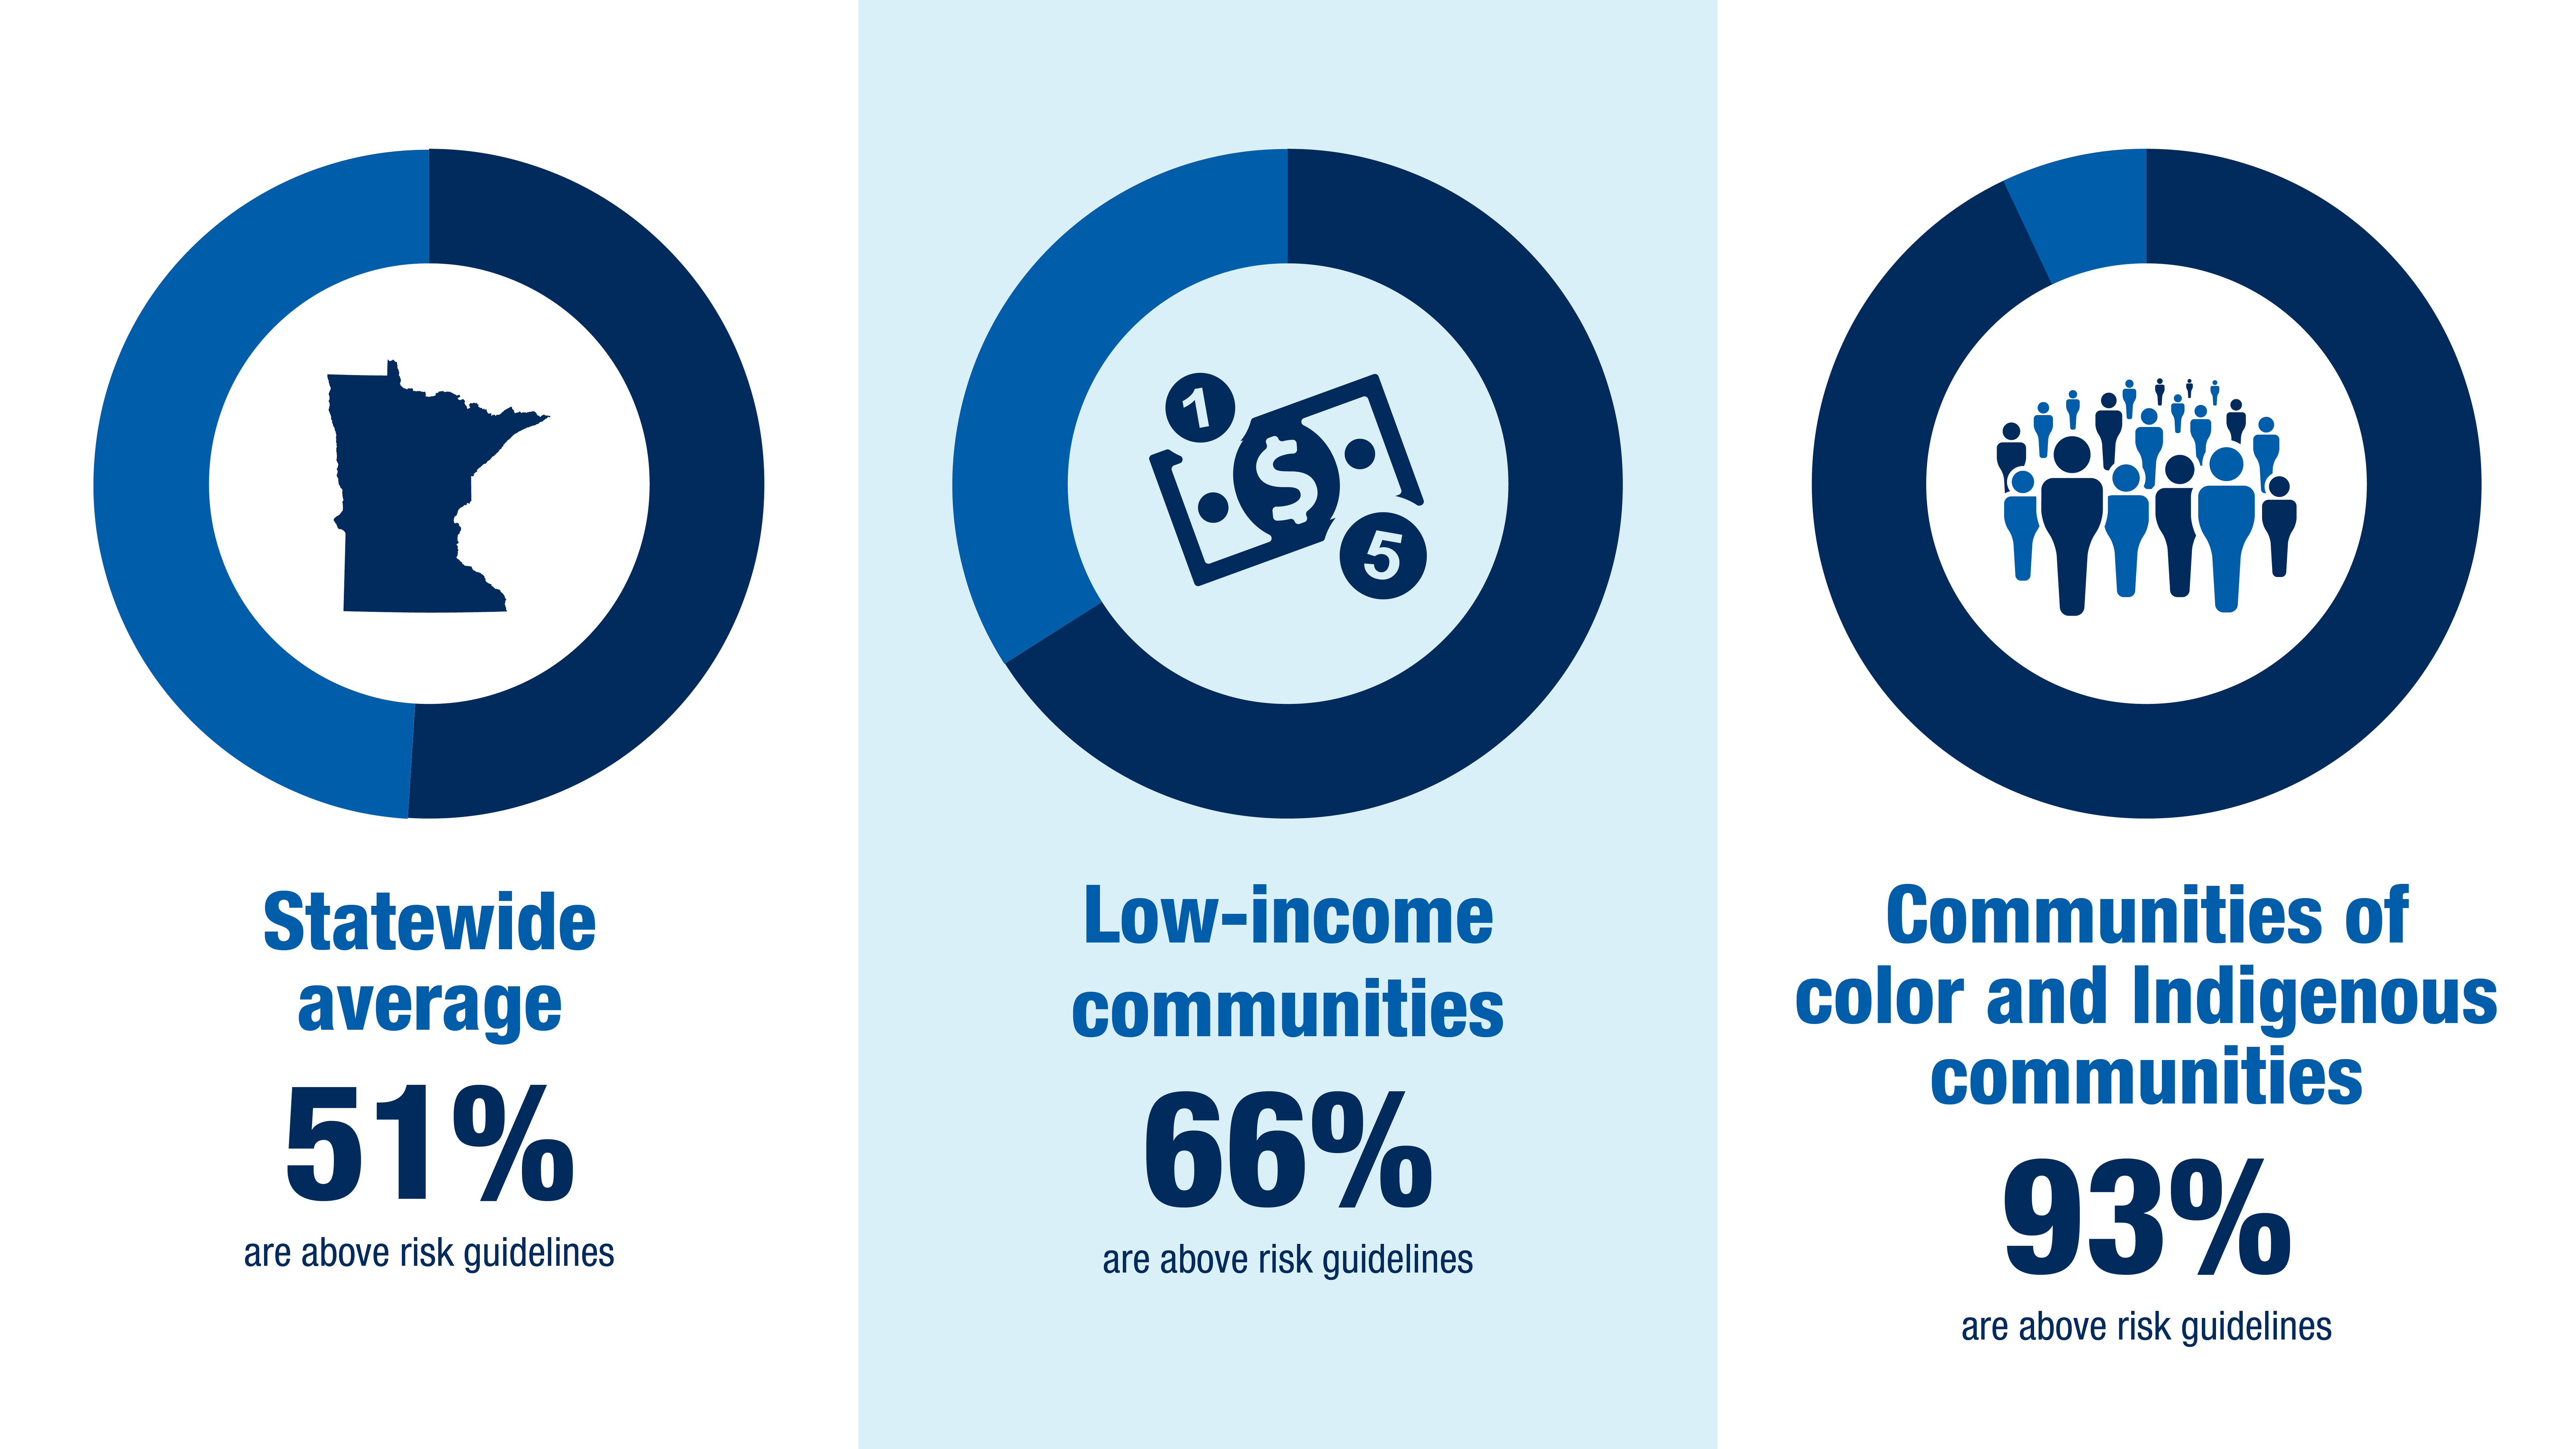
Improving air quality and better ecosystem health has ripple effects throughout the region. Air pollution in the U.S. has a $600 billion annual impact, representing 3% of the country’s GDP.258 Improving air quality would mean improving the economic productivity of the region. It can also result in more equitable health outcomes, as communities that experience health impacts like increased asthma rates due to pollution exposure would benefit from cleaner air. Improving air quality involves addressing pollutants from two angles: reducing pollution at the source and promoting vegetation-rich landscapes that can remove existing pollution from the air. These landscapes, such as urban forests, can foster human health benefits valued at over $6.8 billion USD nationally.259
"Why are there such high asthma rates here in the cities, but not in the suburbs? It's intentional. The air quality needs to be addressed because it's poisoning us."
-Minnesota Indian Women's Resource Center
Water
The Twin Cities region depends on clean and plentiful water for ecosystem and public health, a thriving and growing economy, and for all aspects of daily life. Water quality in the region has steadily improved over decades,260 though there are still some lakes, rivers, and other water bodies with poor quality and newer emerging concerns.261,262 Once pollutants enter the water, they are often difficult and expensive to remove. Water runoff, especially during extreme storm events, impacts water quality, as does inadequate stormwater management.263 Moreover, droughts in recent years have served as a reminder that abundant water should not be taken for granted.264
Degraded water conditions significantly affect ecosystem health through loss of biodiversity, habitat degradation, and disrupted ecosystem functions. Degraded water quality and quantity also impacts people in our region, particularly underserved communities. For example, the inability to consume fish caught in rivers and lakes in the region due to contaminated water limits cultural fishing practices and the ability to use subsistence fishing to supplement other food sources.
Improved water quality and quantity benefit all life in the region. For humans, healthy water systems not only support cultural and subsistence uses but also support more recreational opportunities and reduce water treatment costs for drinking water. For aquatic and semi-aquatic species, clean and abundant water allows them to thrive and strengthen local ecosystems. Carefully considered land use and development plans are crucial to maintaining the region’s water quality. Thoughtfully integrating natural systems (such as wetlands, bioswales, and rain gardens) into development has the dual benefits of filtering pollutants before they reach source waters while also reconnecting ecosystems.
Soil
Soil is critical to all terrestrial life. Soil nourishes plants, filters ground water, regulates the climate, and contains its own wealth of biodiversity.
The Twin Cities region is a soil-rich environment, with prime agricultural soils dominating the rural portions of the region, particularly in Carver, Scott, and Dakota counties. Seeing the value of continued farming close to the growing region, the Legislature established the Metropolitan Agricultural Preserves Program in 1980 to maintain “viable productive farm operations in the metropolitan area” (Minn. Stat. 473H). This program provides tax benefits for farmers with properties of at least 40 acres along with long-range planning protections in local comprehensive plans and ordinances to protect farming.
Similarly, the Green Acres program, established in the late 1960s, provides landowner tax benefits with a focus on smaller farms (at least 10 acres), but does not include the land use and planning restrictions to participate in the program. These programs are one tool that can help reduce pressure for development in the rural area. Our region’s fertile land has been degraded, especially over the last century, due to human activities. In more rural areas of the region, industrial agriculture practices have led to loss of the nutrient- and biodiversity-rich topsoil, amounting to an estimated $520 million loss for Minnesota per year.265
In suburban and urban areas, our soil has been compromised by pollution from pesticide and fertilizer use, industrial activities, compaction, and development. Across all landscapes, clear-cutting and grading associated with development results in soil erosion, often impacting local water bodies. Throughout the region, contaminated land is most often located near poorer residents and residents of color. Contaminated land can harm human health while preventing productive use of the land. Additionally, degraded land hampers carbon sequestration and water filtration, both of which are vital to the maintenance of healthy ecosystems.
Preserving and restoring healthy soil has many benefits for human and ecosystem health in the region. Adopting more sustainable agricultural practices improves soil health and can also benefit water quality, improve agricultural productivity, and support local food systems. Additionally, remediating contaminated land at specific sites promotes the health of nearby residents and allows for more productive, community-driven uses to develop. Finally, healthy soil and landscapes are vital for fostering diverse habitats and ecosystems that sustain biodiversity in the region.
Vegetation and wildlife
Ecosystems are defined by complex interactions linking organisms to each other and their physical environment. Human development threatens the health of ecosystems when it severs these interactions through processes such as habitat fragmentation, climate change, and pollution. These processes can directly harm plants and animals via contamination and loss of suitable habitat or allow some plant and animal populations to grow rapidly and cause ecological and economic harm (for example, emerald ash borer and zebra mussels).
Development frequently leads to habitat loss and fragmentation, but these harms can be mitigated by encouraging habitat connectivity and urban greening. Natural systems are currently most at risk across rural and agricultural landscapes, where unsewered, large-lot, or rural development and agricultural expansion are predicted to consume between 16,000 to 48,000 acres by 2050 based on past development patterns.266 This habitat loss leads to the direct and indirect loss of biodiversity through reducing overall open space and connectivity between natural habitats.
Habitat loss and fragmentation affect people in the region as well. In areas with fewer trees and green space, the urban heat island effect is more extreme. People living in areas with access to quality green space tend to have lower stress levels and better mental health.267 Access to healthy ecosystems allows people to carry on cultural traditions like fishing and foraging. In many parts of our region, healthy ecosystems tend to be least accessible to lower-income people and Black, American Indian, and people of color communities.268
How we develop land is just as important as where we develop. We can reduce the harm to vegetation and wildlife by pairing low-impact development practices with sensible habitat protections, such as maintaining connections between natural habitats. Creating natural habitat within suburban and urban areas, such as pollinator gardens, can support increasing habitat connectivity.
Additionally, ensuring the protection and restoration of ecological areas can help buffer biodiversity losses that result from human development via habitat loss, pollution, and climate change. The presence of many species in a habitat can lead to better functioning ecosystem services like carbon sequestration. Biodiversity can also provide desirable outcomes for natural systems such as more resilient ecosystems, efficient pollutant filtration, carbon sequestration, and wildlife support.
Appendix A
Table A.1: Imagine 2050 Local Forecasts
Adopted by Metropolitan Council, February 12, 2025
Interactive map tool available on Metrocouncil.org
Downloadable PDF of Adopted Local Forecasts for 2050 also available on Metrocouncil.org
| County | City or township | 2050 Community Designation | Population 2020 |
Population 2030 |
Population 2040 |
Population 2050 |
Households 2020 |
Households 2030 |
Households 2040 |
Households 2050 |
Employment 2020 |
Employment 2022 |
Employment 2030 |
Employment 2040 |
Employment 2050 |
|---|---|---|---|---|---|---|---|---|---|---|---|---|---|---|---|
| Anoka | Andover | Suburban Edge | 32,601 | 33,700 | 35,400 | 38,100 | 10,782 | 11,500 | 12,300 | 13,300 | 5,609 | 6,467 | 6,800 | 7,300 | 7,400 |
| Anoka | Anoka | Urban Edge | 17,921 | 18,400 | 19,400 | 21,200 | 7,578 | 7,900 | 8,500 | 9,300 | 13,415 | 14,365 | 14,500 | 15,500 | 15,700 |
| Anoka | Bethel | Rural Center | 476 | 490 | 530 | 560 | 186 | 196 | 215 | 230 | 215 | 185 | 199 | 214 | 242 |
| Anoka | Blaine (Anoka part) | Suburban Edge | 70,222 | 78,800 | 83,700 | 90,200 | 25,172 | 28,600 | 31,000 | 33,600 | 20,908 | 24,809 | 26,800 | 29,100 | 33,600 |
| Anoka | Centerville | Suburban Edge | 3,896 | 4,000 | 4,700 | 4,700 | 1,411 | 1,520 | 1,790 | 1,790 | 434 | 464 | 1,020 | 1,240 | 1,280 |
| Anoka | Circle Pines | Suburban | 5,025 | 5,000 | 5,100 | 5,300 | 2,037 | 2,060 | 2,100 | 2,210 | 399 | 520 | 570 | 610 | 680 |
| Anoka | Columbia Heights | Urban | 21,973 | 23,300 | 23,600 | 24,500 | 8,777 | 9,600 | 9,900 | 10,300 | 3,790 | 4,284 | 4,400 | 4,500 | 4,800 |
| Anoka | Columbus | Suburban Edge | 4,159 | 4,200 | 4,700 | 5,200 | 1,553 | 1,630 | 1,830 | 2,050 | 1,114 | 1,729 | 1,850 | 2,110 | 2,250 |
| Anoka | Coon Rapids | Suburban | 63,599 | 64,200 | 65,400 | 67,100 | 24,518 | 25,400 | 26,200 | 27,000 | 23,206 | 27,109 | 27,800 | 30,100 | 32,700 |
| Anoka | East Bethel | Rural Center | 11,786 | 13,300 | 14,100 | 15,400 | 4,262 | 5,000 | 5,400 | 5,900 | 1,323 | 1,476 | 1,880 | 2,150 | 2,540 |
| Anoka | Fridley | Urban Edge | 29,590 | 31,200 | 31,100 | 32,300 | 11,695 | 12,700 | 13,000 | 13,600 | 22,305 | 24,784 | 25,900 | 26,200 | 28,300 |
| Anoka | Ham Lake | Rural Residential | 16,464 | 16,900 | 17,500 | 19,000 | 5,718 | 6,100 | 6,400 | 7,000 | 3,509 | 3,952 | 4,100 | 4,600 | 5,000 |
| Anoka | Hilltop | Urban | 958 | 1,070 | 1,050 | 1,040 | 391 | 420 | 420 | 420 | 697 | 622 | 620 | 660 | 690 |
| Anoka | Lexington | Suburban | 2,248 | 2,900 | 2,940 | 2,970 | 916 | 1,270 | 1,310 | 1,330 | 464 | 521 | 540 | 580 | 650 |
| Anoka | Lino Lakes | Suburban Edge | 21,399 | 24,600 | 26,600 | 29,200 | 6,957 | 8,300 | 9,200 | 10,200 | 3,786 | 4,424 | 5,200 | 5,600 | 6,000 |
| Anoka | Linwood Township | Diversified Rural | 5,334 | 5,200 | 5,300 | 5,500 | 1,993 | 1,970 | 2,030 | 2,120 | 340 | 369 | 373 | 381 | 410 |
| Anoka | Nowthen | Rural Residential | 4,536 | 4,800 | 4,900 | 5,200 | 1,510 | 1,600 | 1,670 | 1,770 | 602 | 699 | 730 | 910 | 910 |
| Anoka | Oak Grove | Rural Residential | 8,929 | 9,700 | 10,000 | 10,600 | 3,078 | 3,450 | 3,620 | 3,870 | 870 | 1,012 | 1,120 | 1,210 | 1,320 |
| Anoka | Ramsey | Suburban Edge | 27,646 | 30,000 | 33,500 | 37,200 | 9,591 | 10,800 | 12,200 | 13,600 | 6,345 | 7,305 | 8,300 | 9,300 | 10,600 |
| Anoka | Spring Lake Park (Anoka part) | Suburban | 6,983 | 7,300 | 7,300 | 7,300 | 2,877 | 3,060 | 3,120 | 3,130 | 2,481 | 3,481 | 3,550 | 3,850 | 4,300 |
| Anoka | St. Francis | Rural Center | 8,142 | 8,800 | 9,700 | 11,000 | 2,877 | 3,150 | 3,530 | 4,000 | 1,409 | 1,565 | 1,850 | 2,210 | 2,760 |
| Anoka | Anoka County Total | 363,887 | 387,860 | 406,520 | 433,570 | 133,879 | 146,226 | 155,735 | 166,720 | 113,221 | 130,142 | 138,102 | 148,325 | 162,132 | |
| Carver | Benton Township | Agricultural | 753 | 740 | 860 | 910 | 300 | 310 | 369 | 394 | 313 | 321 | 400 | 410 | 420 |
| Carver | Camden Township | Agricultural | 924 | 920 | 930 | 1,060 | 338 | 352 | 366 | 420 | 99 | 87 | 88 | 108 | 129 |
| Carver | Carver | Suburban Edge | 5,241 | 9,600 | 11,200 | 14,900 | 1,669 | 3,210 | 3,920 | 5,300 | 182 | 365 | 394 | 610 | 1,270 |
| Carver | Chanhassen (Carver part) | Suburban Edge | 25,947 | 27,700 | 29,500 | 32,100 | 9,644 | 10,700 | 11,700 | 12,800 | 11,409 | 13,046 | 14,200 | 15,800 | 18,400 |
| Carver | Chaska | Suburban Edge | 27,810 | 31,300 | 33,300 | 36,800 | 10,438 | 11,900 | 13,000 | 14,500 | 11,722 | 13,237 | 15,000 | 15,900 | 17,800 |
| Carver | Cologne | Rural Center | 2,047 | 2,230 | 2,810 | 3,400 | 734 | 830 | 1,080 | 1,320 | 349 | 398 | 400 | 490 | 590 |
| Carver | Dahlgren Township | Agricultural | 1,442 | 1,250 | 1,220 | 1,030 | 503 | 460 | 470 | 400 | 478 | 505 | 690 | 680 | 410 |
| Carver | Hamburg | Rural Center | 566 | 580 | 610 | 610 | 219 | 228 | 246 | 250 | 89 | 78 | 114 | 134 | 147 |
| Carver | Hancock Township | Agricultural | 336 | 320 | 348 | 410 | 129 | 128 | 143 | 168 | 27 | 27 | 27 | 35 | 35 |
| Carver | Hollywood Township | Agricultural | 1,058 | 1,050 | 1,100 | 1,220 | 387 | 391 | 420 | 470 | 198 | 269 | 269 | 273 | 273 |
| Carver | Laketown Township | Suburban Edge | 1,966 | 1,880 | 1,690 | - | 611 | 600 | 560 | - | 488 | 715 | 530 | 450 | - |
| Carver | Mayer | Rural Center | 2,453 | 2,710 | 2,960 | 3,270 | 800 | 930 | 1,070 | 1,200 | 168 | 177 | 237 | 291 | 349 |
| Carver | New Germany | Rural Center | 464 | 530 | 760 | 920 | 180 | 205 | 300 | 364 | 36 | 46 | 77 | 92 | 101 |
| Carver | Norwood Young America | Rural Center | 3,863 | 4,300 | 4,900 | 5,700 | 1,551 | 1,740 | 2,060 | 2,410 | 810 | 938 | 1,240 | 1,450 | 1,740 |
| Carver | San Francisco Township | Agricultural | 871 | 880 | 870 | 930 | 325 | 336 | 353 | 383 | 57 | 61 | 61 | 61 | 61 |
| Carver | Victoria | Suburban Edge | 10,546 | 14,400 | 17,000 | 20,700 | 3,542 | 5,000 | 6,100 | 7,500 | 963 | 1,296 | 1,790 | 2,000 | 2,430 |
| Carver | Waconia | Suburban Edge | 13,033 | 17,400 | 18,800 | 22,600 | 4,659 | 6,500 | 7,200 | 8,600 | 6,745 | 7,663 | 8,100 | 8,800 | 10,200 |
| Carver | Waconia Township | Suburban Edge | 1,068 | 1,160 | 1,260 | 1,200 | 396 | 440 | 490 | 470 | 116 | 115 | 186 | 185 | 185 |
| Carver | Watertown | Rural Center | 4,659 | 5,200 | 6,600 | 7,400 | 1,714 | 1,980 | 2,620 | 3,000 | 555 | 600 | 810 | 1,010 | 1,200 |
| Carver | Watertown Township | Agricultural | 1,188 | 1,180 | 1,270 | 1,420 | 462 | 470 | 530 | 600 | 431 | 436 | 440 | 309 | 346 |
| Carver | Young America Township | Agricultural | 683 | 690 | 710 | 770 | 261 | 273 | 288 | 312 | 57 | 61 | 67 | 73 | 79 |
| Carver | Carver County Total | 106,918 | 126,020 | 138,698 | 157,350 | 38,862 | 46,983 | 53,285 | 60,861 | 35,292 | 40,441 | 45,120 | 49,161 | 56,165 | |
| Dakota | Apple Valley | Suburban | 56,374 | 57,800 | 59,300 | 61,500 | 21,464 | 22,800 | 24,000 | 25,000 | 13,016 | 15,549 | 15,800 | 16,700 | 18,000 |
| Dakota | Burnsville | Suburban | 64,317 | 66,400 | 70,200 | 76,600 | 25,480 | 27,100 | 29,400 | 32,300 | 29,675 | 33,640 | 36,100 | 38,200 | 42,400 |
| Dakota | Castle Rock Township | Agricultural | 1,350 | 1,400 | 1,400 | 1,540 | 506 | 530 | 550 | 610 | 312 | 336 | 341 | 348 | 383 |
| Dakota | Coates | Diversified Rural | 147 | 140 | 140 | 140 | 62 | 63 | 69 | 71 | 295 | 282 | 285 | 311 | 345 |
| Dakota | Douglas Township | Agricultural | 748 | 750 | 770 | 840 | 261 | 270 | 287 | 314 | 130 | 166 | 166 | 166 | 166 |
| Dakota | Eagan | Suburban | 68,855 | 72,000 | 75,200 | 79,200 | 27,609 | 30,000 | 32,000 | 33,900 | 51,341 | 51,288 | 57,600 | 62,200 | 70,000 |
| Dakota | Empire | Suburban Edge | 3,177 | 3,630 | 3,940 | 4,300 | 1,021 | 1,220 | 1,380 | 1,530 | 524 | 549 | 730 | 900 | 1,100 |
| Dakota | Eureka Township | Agricultural | 1,373 | 1,400 | 1,440 | 1,520 | 524 | 540 | 570 | 610 | 230 | 242 | 254 | 302 | 315 |
| Dakota | Farmington | Suburban Edge | 23,632 | 24,600 | 25,400 | 27,300 | 7,906 | 8,600 | 9,300 | 10,100 | 4,431 | 4,849 | 5,400 | 5,800 | 6,500 |
| Dakota | Greenvale Township | Agricultural | 796 | 800 | 850 | 930 | 285 | 294 | 319 | 351 | 134 | 159 | 159 | 161 | 166 |
| Dakota | Hampton | Rural Center | 744 | 730 | 810 | 820 | 274 | 279 | 314 | 320 | 64 | 308 | 308 | 316 | 330 |
| Dakota | Hampton Township | Agricultural | 832 | 850 | 940 | 1,060 | 328 | 335 | 381 | 430 | 205 | 247 | 247 | 246 | 246 |
| Dakota | Hastings (Dakota part) | Suburban | 22,152 | 23,500 | 24,700 | 26,500 | 9,128 | 9,800 | 10,500 | 11,300 | 6,942 | 7,718 | 8,100 | 8,500 | 9,000 |
| Dakota | Inver Grove Heights | Suburban Edge | 35,791 | 37,800 | 38,700 | 42,500 | 14,338 | 15,600 | 16,300 | 18,000 | 9,602 | 11,206 | 12,400 | 13,700 | 15,700 |
| Dakota | Lakeville | Suburban Edge | 69,490 | 79,900 | 84,700 | 89,500 | 23,265 | 28,100 | 31,000 | 33,100 | 15,888 | 20,896 | 23,100 | 25,200 | 29,900 |
| Dakota | Lilydale | Suburban | 809 | 820 | 1,030 | 1,050 | 543 | 570 | 720 | 730 | 362 | 453 | 450 | 490 | 530 |
| Dakota | Marshan Township | Agricultural | 1,153 | 1,210 | 1,260 | 1,440 | 426 | 460 | 490 | 560 | 161 | 189 | 215 | 246 | 246 |
| Dakota | Mendota | Suburban | 183 | 215 | 287 | 354 | 78 | 92 | 126 | 157 | 64 | 223 | 223 | 253 | 300 |
| Dakota | Mendota Heights | Suburban | 11,744 | 11,800 | 12,300 | 12,900 | 4,787 | 4,900 | 5,200 | 5,500 | 10,503 | 11,988 | 12,100 | 12,600 | 13,300 |
| Dakota | Miesville | Diversified Rural | 138 | 137 | 146 | 154 | 57 | 58 | 64 | 68 | 79 | 77 | 90 | 96 | 103 |
| Dakota | New Trier | Diversified Rural | 86 | 86 | 93 | 108 | 38 | 38 | 42 | 49 | 60 | 80 | 80 | 96 | 104 |
| Dakota | Nininger Township | Agricultural | 865 | 930 | 970 | 1,070 | 312 | 347 | 372 | 410 | 144 | 195 | 229 | 232 | 238 |
| Dakota | Northfield (Dakota part) | Non-Council Community | 1,261 | 1,470 | 1,610 | 1,730 | 503 | 600 | 670 | 720 | 1,110 | 1,136 | 1,180 | 1,160 | 1,260 |
| Dakota | Randolph | Diversified Rural | 466 | 470 | 510 | 540 | 166 | 172 | 192 | 204 | 143 | 183 | 187 | 202 | 238 |
| Dakota | Randolph Township | Diversified Rural | 760 | 760 | 790 | 840 | 276 | 287 | 305 | 326 | 160 | 195 | 200 | 254 | 254 |
| Dakota | Ravenna Township | Diversified Rural | 2,354 | 2,350 | 2,380 | 2,450 | 826 | 840 | 870 | 900 | 107 | 110 | 116 | 125 | 135 |
| Dakota | Rosemount | Suburban Edge | 25,650 | 31,400 | 33,100 | 38,800 | 8,931 | 11,300 | 12,200 | 14,400 | 7,072 | 8,304 | 9,600 | 11,500 | 15,300 |
| Dakota | Sciota Township | Agricultural | 460 | 460 | 480 | 540 | 155 | 161 | 178 | 202 | 66 | 84 | 84 | 84 | 84 |
| Dakota | South St. Paul | Urban | 20,769 | 20,900 | 20,900 | 21,500 | 8,432 | 8,700 | 8,900 | 9,200 | 5,863 | 6,433 | 7,100 | 7,200 | 7,600 |
| Dakota | Sunfish Lake | Rural Residential | 522 | 540 | 520 | 530 | 179 | 191 | 199 | 205 | 5 | - | 5 | 6 | 8 |
| Dakota | Vermillion | Rural Center | 441 | 430 | 430 | 430 | 168 | 169 | 175 | 175 | 111 | 149 | 149 | 153 | 173 |
| Dakota | Vermillion Township | Agricultural | 1,290 | 1,320 | 1,400 | 1,570 | 479 | 490 | 530 | 600 | 263 | 293 | 295 | 296 | 299 |
| Dakota | Waterford Township | Agricultural | 538 | 530 | 550 | 630 | 205 | 207 | 223 | 258 | 604 | 639 | 640 | 650 | 660 |
| Dakota | West St. Paul | Urban | 20,615 | 21,300 | 22,100 | 23,300 | 8,996 | 9,800 | 10,400 | 11,000 | 7,279 | 8,300 | 8,500 | 8,700 | 8,900 |
| Dakota | Dakota County Total | 439,882 | 468,828 | 489,346 | 524,186 | 168,008 | 184,913 | 198,226 | 213,600 | 166,945 | 186,466 | 202,433 | 217,393 | 244,283 | |
| Hennepin | Bloomington | Urban Edge | 89,987 | 95,300 | 98,100 | 103,400 | 38,080 | 41,200 | 42,500 | 44,800 | 73,382 | 87,234 | 91,100 | 92,600 | 98,300 |
| Hennepin | Brooklyn Center | Urban Edge | 33,782 | 35,600 | 36,000 | 36,900 | 11,309 | 12,100 | 12,300 | 12,600 | 12,585 | 13,166 | 14,000 | 14,300 | 15,000 |
| Hennepin | Brooklyn Park | Suburban | 86,478 | 89,300 | 94,000 | 103,500 | 28,749 | 30,300 | 32,000 | 35,300 | 29,761 | 33,678 | 35,500 | 39,500 | 44,700 |
| Hennepin | Champlin | Suburban | 23,919 | 25,300 | 25,400 | 25,700 | 8,879 | 9,400 | 9,500 | 9,600 | 3,854 | 4,566 | 4,600 | 4,800 | 5,300 |
| Hennepin | Chanhassen (Hennepin part) | Suburban Edge | - | - | - | - | - | - | - | - | 2,235 | 2,414 | 2,410 | 2,520 | 2,620 |
| Hennepin | Corcoran | Suburban Edge | 6,185 | 9,200 | 11,100 | 13,800 | 2,174 | 3,300 | 4,000 | 5,000 | 1,454 | 1,769 | 2,090 | 2,320 | 2,770 |
| Hennepin | Crystal | Urban Edge | 23,330 | 24,100 | 24,800 | 25,500 | 9,552 | 9,800 | 10,100 | 10,400 | 3,466 | 4,230 | 4,300 | 4,400 | 4,700 |
| Hennepin | Dayton (Hennepin part) | Suburban Edge | 7,212 | 11,300 | 13,800 | 16,700 | 2,438 | 3,980 | 5,000 | 6,100 | 1,063 | 1,353 | 2,120 | 3,020 | 4,300 |
| Hennepin | Deephaven | Suburban Edge | 3,899 | 3,830 | 3,880 | 3,880 | 1,403 | 1,410 | 1,430 | 1,430 | 1,024 | 1,246 | 1,250 | 1,270 | 1,290 |
| Hennepin | Eden Prairie | Suburban | 64,198 | 71,700 | 76,500 | 84,700 | 24,892 | 28,400 | 30,400 | 33,700 | 54,841 | 58,699 | 61,700 | 64,900 | 70,200 |
| Hennepin | Edina | Urban Edge | 53,494 | 60,600 | 64,800 | 70,200 | 22,093 | 26,000 | 27,800 | 30,100 | 37,468 | 43,311 | 45,600 | 46,500 | 50,000 |
| Hennepin | Excelsior | Suburban | 2,355 | 2,420 | 2,630 | 2,760 | 1,148 | 1,200 | 1,310 | 1,370 | 1,445 | 1,972 | 1,970 | 2,040 | 2,230 |
| Hennepin | Fort Snelling (Unorganized) | Urban | 438 | 490 | 600 | 690 | 283 | 320 | 430 | 510 | 21,300 | 25,996 | 26,700 | 26,800 | 27,500 |
| Hennepin | Golden Valley | Urban Edge | 22,552 | 23,400 | 24,700 | 26,500 | 9,957 | 10,400 | 11,000 | 11,800 | 28,845 | 28,473 | 29,900 | 30,700 | 32,700 |
| Hennepin | Greenfield | Rural Center | 2,903 | 3,210 | 3,510 | 3,880 | 1,013 | 1,110 | 1,220 | 1,350 | 522 | 701 | 740 | 840 | 910 |
| Hennepin | Greenwood | Suburban Edge | 726 | 730 | 760 | 760 | 286 | 289 | 300 | 300 | 123 | 192 | 194 | 227 | 236 |
| Hennepin | Hanover (Hennepin part) | Non-Council Community | 666 | 720 | 770 | 780 | 236 | 258 | 278 | 280 | 73 | 64 | 85 | 88 | 98 |
| Hennepin | Hopkins | Urban | 19,084 | 21,400 | 22,600 | 23,900 | 9,110 | 10,400 | 11,000 | 11,600 | 16,855 | 18,401 | 18,700 | 19,300 | 20,700 |
| Hennepin | Independence | Diversified Rural | 3,755 | 4,400 | 4,600 | 4,900 | 1,288 | 1,490 | 1,600 | 1,700 | 697 | 806 | 850 | 920 | 1,030 |
| Hennepin | Long Lake | Suburban | 1,741 | 2,010 | 2,070 | 2,070 | 737 | 850 | 880 | 880 | 1,009 | 1,222 | 1,220 | 1,370 | 1,410 |
| Hennepin | Loretto | Suburban Edge | 646 | 690 | 720 | 740 | 268 | 281 | 295 | 304 | 266 | 494 | 510 | 530 | 540 |
| Hennepin | Maple Grove | Suburban Edge | 70,253 | 74,600 | 81,800 | 90,200 | 26,728 | 29,300 | 32,400 | 35,800 | 31,786 | 38,695 | 39,000 | 41,300 | 46,600 |
| Hennepin | Maple Plain | Suburban | 1,743 | 2,050 | 2,450 | 2,720 | 734 | 900 | 1,090 | 1,210 | 1,949 | 1,755 | 1,940 | 2,020 | 2,190 |
| Hennepin | Medicine Lake | Suburban Edge | 337 | 358 | 358 | 360 | 154 | 163 | 163 | 164 | 44 | 60 | 61 | 66 | 70 |
| Hennepin | Medina | Suburban Edge | 6,837 | 8,900 | 10,000 | 10,800 | 2,298 | 3,090 | 3,500 | 3,820 | 4,822 | 5,587 | 5,800 | 6,600 | 7,500 |
| Hennepin | Minneapolis | Urban | 429,956 | 451,400 | 484,800 | 514,200 | 187,671 | 203,100 | 218,000 | 231,200 | 294,467 | 316,504 | 323,600 | 332,100 | 352,900 |
| Hennepin | Minnetonka | Suburban | 53,776 | 59,300 | 64,000 | 69,900 | 23,694 | 26,600 | 28,900 | 31,600 | 43,624 | 47,383 | 49,600 | 52,100 | 55,100 |
| Hennepin | Minnetonka Beach | Suburban Edge | 546 | 540 | 560 | 590 | 198 | 201 | 209 | 218 | 120 | 254 | 258 | 260 | 263 |
| Hennepin | Minnetrista | Suburban Edge | 8,262 | 10,200 | 11,300 | 12,500 | 2,765 | 3,410 | 3,800 | 4,200 | 652 | 875 | 940 | 1,140 | 1,380 |
| Hennepin | Mound | Suburban | 9,398 | 9,500 | 9,500 | 9,700 | 4,160 | 4,300 | 4,300 | 4,400 | 1,074 | 1,396 | 1,400 | 1,470 | 1,570 |
| Hennepin | New Hope | Urban Edge | 21,986 | 22,200 | 22,500 | 23,100 | 8,984 | 9,200 | 9,300 | 9,500 | 10,460 | 11,359 | 11,400 | 11,600 | 12,200 |
| Hennepin | Orono | Suburban Edge | 8,315 | 8,600 | 9,800 | 10,800 | 3,152 | 3,280 | 3,710 | 4,100 | 1,320 | 1,573 | 1,670 | 1,800 | 2,030 |
| Hennepin | Osseo | Urban Edge | 2,688 | 2,730 | 3,110 | 3,210 | 1,285 | 1,300 | 1,480 | 1,520 | 1,694 | 2,987 | 2,990 | 3,210 | 3,650 |
| Hennepin | Plymouth | Suburban | 81,026 | 81,700 | 86,000 | 91,700 | 32,041 | 33,200 | 35,200 | 37,600 | 52,025 | 55,310 | 57,400 | 60,600 | 66,000 |
| Hennepin | Richfield | Urban | 36,994 | 38,900 | 40,500 | 41,700 | 15,940 | 16,900 | 17,600 | 18,100 | 15,735 | 18,494 | 17,500 | 18,000 | 18,500 |
| Hennepin | Robbinsdale | Urban | 14,646 | 15,600 | 16,200 | 16,900 | 6,289 | 6,900 | 7,200 | 7,500 | 6,402 | 7,303 | 7,300 | 7,400 | 7,600 |
| Hennepin | Rockford (Hennepin part) | Non-Council Community | 455 | 450 | 470 | 570 | 197 | 198 | 207 | 251 | 139 | 186 | 261 | 290 | 317 |
| Hennepin | Rogers | Suburban Edge | 13,295 | 18,300 | 21,300 | 25,200 | 4,534 | 6,400 | 7,500 | 8,900 | 9,817 | 11,445 | 13,200 | 15,100 | 17,900 |
| Hennepin | Shorewood (Hennepin part) | Suburban | 7,779 | 8,100 | 8,300 | 8,400 | 2,872 | 3,020 | 3,100 | 3,150 | 1,665 | 1,879 | 1,880 | 1,920 | 2,030 |
| Hennepin | Spring Park | Suburban | 1,734 | 1,750 | 1,860 | 2,060 | 1,040 | 1,070 | 1,130 | 1,250 | 678 | 998 | 1,000 | 1,020 | 1,090 |
| Hennepin | St. Anthony (Hennepin part) | Urban Edge | 5,612 | 5,900 | 5,900 | 6,100 | 2,248 | 2,390 | 2,440 | 2,540 | 2,079 | 2,587 | 2,590 | 2,650 | 2,790 |
| Hennepin | St. Bonifacius | Suburban Edge | 2,307 | 2,300 | 2,290 | 2,400 | 896 | 920 | 930 | 980 | 354 | 416 | 500 | 530 | 580 |
| Hennepin | St. Louis Park | Urban | 50,010 | 52,400 | 55,500 | 59,500 | 23,830 | 25,700 | 27,200 | 29,100 | 33,432 | 38,316 | 39,900 | 40,100 | 41,800 |
| Hennepin | Tonka Bay | Suburban | 1,442 | 1,610 | 1,750 | 1,770 | 586 | 690 | 750 | 760 | 233 | 408 | 410 | 420 | 430 |
| Hennepin | Wayzata | Suburban | 4,434 | 4,700 | 5,300 | 5,500 | 2,206 | 2,370 | 2,630 | 2,750 | 4,152 | 5,288 | 5,300 | 5,500 | 5,800 |
| Hennepin | Woodland | Suburban Edge | 384 | 420 | 420 | 440 | 150 | 166 | 167 | 175 | 10 | 15 | 15 | 15 | 15 |
| Hennepin | Hennepin County Total | 1,281,565 | 1,368,208 | 1,457,308 | 1,561,580 | 528,547 | 577,256 | 616,249 | 659,912 | 811,001 | 901,060 | 931,454 | 966,156 | 1,036,839 | |
| Ramsey | Arden Hills | Suburban | 9,939 | 11,500 | 12,000 | 13,700 | 3,114 | 3,710 | 4,000 | 4,700 | 10,143 | 9,182 | 11,500 | 12,700 | 14,700 |
| Ramsey | Blaine (Ramsey part) | Suburban Edge | - | - | - | - | - | - | - | - | 707 | 625 | 700 | 800 | 1,060 |
| Ramsey | Falcon Heights | Urban Edge | 5,369 | 5,700 | 5,700 | 5,900 | 2,203 | 2,390 | 2,480 | 2,580 | 4,603 | 5,230 | 5,300 | 5,400 | 5,700 |
| Ramsey | Gem Lake | Suburban | 528 | 590 | 660 | 660 | 199 | 220 | 250 | 250 | 357 | 437 | 470 | 500 | 570 |
| Ramsey | Lauderdale | Urban Edge | 2,271 | 2,300 | 2,320 | 2,380 | 1,170 | 1,200 | 1,240 | 1,280 | 637 | 678 | 830 | 830 | 890 |
| Ramsey | Little Canada | Suburban | 10,819 | 10,600 | 11,100 | 11,600 | 4,601 | 4,700 | 5,000 | 5,300 | 5,426 | 6,229 | 6,700 | 7,000 | 7,400 |
| Ramsey | Maplewood | Urban Edge | 42,088 | 43,200 | 43,700 | 45,800 | 15,994 | 16,700 | 17,200 | 18,100 | 24,376 | 26,661 | 28,300 | 29,800 | 31,900 |
| Ramsey | Mounds View | Suburban | 13,249 | 13,200 | 13,700 | 14,800 | 5,207 | 5,300 | 5,600 | 6,100 | 6,736 | 6,950 | 7,200 | 7,500 | 8,200 |
| Ramsey | New Brighton | Urban Edge | 23,454 | 24,100 | 24,100 | 25,100 | 9,548 | 9,900 | 10,100 | 10,600 | 9,380 | 10,375 | 10,400 | 10,500 | 11,000 |
| Ramsey | North Oaks | Suburban Edge | 5,272 | 5,600 | 6,000 | 6,000 | 1,972 | 2,100 | 2,300 | 2,310 | 1,288 | 1,468 | 1,490 | 1,530 | 1,530 |
| Ramsey | North St. Paul | Urban Edge | 12,364 | 13,100 | 13,100 | 13,000 | 4,803 | 5,200 | 5,300 | 5,300 | 3,063 | 4,485 | 3,500 | 3,500 | 3,500 |
| Ramsey | Roseville | Urban Edge | 36,254 | 35,900 | 36,100 | 37,500 | 15,554 | 16,000 | 16,400 | 17,100 | 32,321 | 35,517 | 36,700 | 37,700 | 39,700 |
| Ramsey | Shoreview | Suburban | 26,921 | 28,400 | 29,100 | 29,600 | 11,171 | 12,200 | 12,700 | 13,000 | 9,545 | 12,126 | 12,200 | 12,500 | 13,100 |
| Ramsey | Spring Lake Park (Ramsey part) | Suburban | 205 | 203 | 202 | 224 | 79 | 81 | 83 | 93 | 30 | 40 | 51 | 52 | 53 |
| Ramsey | St. Anthony (Ramsey part) | Urban Edge | 3,645 | 4,200 | 4,400 | 4,800 | 1,844 | 2,120 | 2,240 | 2,470 | 1,196 | 1,262 | 1,430 | 1,450 | 1,500 |
| Ramsey | St. Paul | Urban | 311,527 | 313,900 | 324,600 | 338,200 | 120,572 | 125,400 | 131,700 | 137,700 | 161,222 | 173,317 | 185,200 | 188,900 | 199,500 |
| Ramsey | Vadnais Heights | Suburban | 12,912 | 13,000 | 14,200 | 14,100 | 5,407 | 5,700 | 6,300 | 6,300 | 8,050 | 8,922 | 9,200 | 9,700 | 10,500 |
| Ramsey | White Bear Lake (Ramsey part) | Urban Edge | 24,486 | 24,100 | 25,700 | 26,100 | 10,240 | 10,300 | 11,200 | 11,400 | 10,699 | 12,344 | 12,300 | 12,300 | 12,300 |
| Ramsey | White Bear Township | Suburban | 11,049 | 10,900 | 11,200 | 11,200 | 4,399 | 4,400 | 4,600 | 4,600 | 2,588 | 2,863 | 3,110 | 3,300 | 3,300 |
| Ramsey | Ramsey County Total | 552,352 | 560,493 | 577,882 | 600,664 | 218,077 | 227,621 | 238,693 | 249,183 | 292,367 | 318,711 | 336,581 | 345,962 | 366,403 | |
| Scott | Belle Plaine | Rural Center | 7,388 | 8,300 | 9,600 | 12,400 | 2,627 | 3,120 | 3,740 | 4,900 | 1,656 | 1,811 | 2,360 | 2,800 | 3,480 |
| Scott | Belle Plaine Township | Diversified Rural | 870 | 880 | 1,060 | 1,010 | 318 | 329 | 430 | 420 | 43 | 27 | 54 | 27 | 23 |
| Scott | Blakeley Township | Agricultural | 408 | 390 | 410 | 450 | 152 | 153 | 176 | 198 | 63 | 90 | 107 | 107 | 107 |
| Scott | Cedar Lake Township | Diversified Rural | 3,050 | 3,050 | 3,040 | 3,140 | 1,038 | 1,090 | 1,150 | 1,210 | 206 | 255 | 255 | 255 | 255 |
| Scott | Credit River | Suburban Edge | 5,493 | 5,700 | 5,700 | 5,900 | 1,815 | 1,970 | 2,090 | 2,200 | 421 | 550 | 570 | 580 | 580 |
| Scott | Elko New Market | Rural Center | 4,846 | 6,200 | 8,200 | 10,500 | 1,538 | 2,000 | 2,820 | 3,660 | 389 | 493 | 910 | 1,550 | 1,950 |
| Scott | Helena Township | Diversified Rural | 1,795 | 2,000 | 2,000 | 2,140 | 610 | 690 | 730 | 790 | 296 | 336 | 336 | 348 | 355 |
| Scott | Jackson Township** | Suburban Edge | 1,616 | 1,710 | 590 | 590 | 537 | 580 | 210 | 210 | 445 | 497 | 500 | 45 | 45 |
| Scott | Jordan | Rural Center | 6,656 | 7,700 | 8,600 | 9,600 | 2,279 | 2,760 | 3,230 | 3,680 | 1,919 | 2,187 | 2,280 | 2,590 | 3,020 |
| Scott | Louisville Township | Diversified Rural | 1,342 | 1,390 | 1,460 | 1,520 | 462 | 470 | 490 | 510 | 416 | 551 | 640 | 680 | 720 |
| Scott | New Market Township | Diversified Rural | 3,525 | 3,810 | 3,170 | 3,360 | 1,212 | 1,350 | 1,190 | 1,280 | 1,442 | 1,560 | 1,850 | 1,600 | 1,710 |
| Scott | New Prague (Scott part) | Non-Council Community | 4,706 | 5,000 | 5,300 | 5,900 | 1,802 | 1,940 | 2,180 | 2,450 | 1,723 | 2,064 | 2,480 | 2,680 | 2,940 |
| Scott | Prior Lake* | Suburban Edge | 26,838 | 28,100 | 30,300 | 33,800 | 10,146 | 10,800 | 12,200 | 13,800 | 4,038 | 3,222 | 4,100 | 4,600 | 5,700 |
| Scott | Sand Creek Township | Diversified Rural | 1,497 | 1,470 | 1,420 | 1,480 | 545 | 560 | 570 | 600 | 440 | 524 | 540 | 600 | 680 |
| Scott | Savage | Suburban | 32,465 | 33,900 | 34,800 | 37,700 | 11,181 | 12,300 | 13,500 | 14,900 | 7,427 | 8,943 | 9,500 | 10,100 | 11,000 |
| Scott | Shakopee Mdewakanton Sioux* | Suburban Edge | 779 | 1,220 | 1,210 | 1,270 | 204 | 373 | 386 | 410 | 2,000 | 2,500 | 3,010 | 3,230 | 3,630 |
| Scott | Shakopee* | Suburban Edge | 43,698 | 51,300 | 55,400 | 62,500 | 14,722 | 18,300 | 21,000 | 24,100 | 24,334 | 29,676 | 32,200 | 35,800 | 43,000 |
| Scott | Spring Lake Township | Diversified Rural | 3,464 | 3,450 | 3,210 | 3,280 | 1,278 | 1,320 | 1,270 | 1,310 | 449 | 558 | 570 | 341 | 344 |
| Scott | St. Lawrence Township | Diversified Rural | 492 | 470 | 450 | 490 | 179 | 177 | 183 | 204 | 196 | 242 | 242 | 245 | 253 |
| Scott | Scott County Total | 150,928 | 166,040 | 175,920 | 197,030 | 52,645 | 60,282 | 67,545 | 76,832 | 47,903 | 56,086 | 62,504 | 68,178 | 79,792 | |
| Washington | Afton | Diversified Rural | 2,955 | 3,040 | 3,060 | 3,090 | 1,091 | 1,160 | 1,200 | 1,220 | 373 | 479 | 490 | 560 | 620 |
| Washington | Bayport | Suburban | 4,024 | 4,100 | 4,000 | 4,000 | 1,038 | 1,110 | 1,120 | 1,130 | 4,226 | 4,882 | 5,000 | 5,200 | 5,200 |
| Washington | Baytown Township | Rural Residential | 2,088 | 2,270 | 2,310 | 2,420 | 726 | 810 | 850 | 900 | 132 | 188 | 144 | 183 | 249 |
| Washington | Birchwood Village | Suburban | 863 | 880 | 860 | 850 | 348 | 357 | 357 | 357 | 24 | 23 | 23 | 23 | 23 |
| Washington | Cottage Grove | Suburban Edge | 38,839 | 45,400 | 47,800 | 52,400 | 13,105 | 15,800 | 17,300 | 19,200 | 8,210 | 9,938 | 10,800 | 12,000 | 14,000 |
| Washington | Dellwood | Diversified Rural | 1,171 | 1,150 | 1,140 | 1,130 | 391 | 392 | 398 | 400 | 238 | 404 | 330 | 330 | 330 |
| Washington | Denmark Township | Diversified Rural | 1,801 | 2,020 | 2,040 | 2,130 | 664 | 760 | 790 | 830 | 486 | 606 | 640 | 700 | 790 |
| Washington | Forest Lake | Suburban Edge | 20,611 | 23,000 | 26,000 | 28,400 | 8,131 | 9,300 | 10,800 | 11,900 | 6,096 | 7,609 | 8,700 | 9,500 | 10,700 |
| Washington | Grant | Diversified Rural | 3,970 | 4,200 | 4,300 | 4,500 | 1,453 | 1,530 | 1,610 | 1,700 | 534 | 672 | 750 | 840 | 840 |
| Washington | Grey Cloud Island Township | Diversified Rural | 283 | 287 | 297 | 311 | 97 | 102 | 109 | 115 | 17 | 37 | 16 | 13 | 10 |
| Washington | Hastings (Washington part) | Suburban | 2 | 2 | 2 | 2 | 1 | 1 | 1 | 1 | 30 | 40 | 43 | 43 | 43 |
| Washington | Hugo | Suburban Edge | 15,766 | 18,500 | 20,500 | 23,500 | 5,939 | 7,200 | 8,200 | 9,500 | 2,668 | 3,021 | 3,280 | 3,910 | 4,000 |
| Washington | Lake Elmo | Suburban Edge | 11,335 | 15,200 | 16,900 | 18,900 | 4,004 | 5,700 | 6,500 | 7,300 | 2,509 | 3,075 | 3,760 | 4,240 | 5,000 |
| Washington | Lake St. Croix Beach | Rural Residential | 1,043 | 1,040 | 1,010 | 1,050 | 470 | 480 | 480 | 500 | 110 | 277 | 279 | 300 | 316 |
| Washington | Lakeland | Rural Residential | 1,710 | 1,680 | 1,720 | 1,750 | 695 | 710 | 750 | 770 | 197 | 498 | 500 | 510 | 550 |
| Washington | Lakeland Shores | Rural Residential | 339 | 322 | 318 | 316 | 120 | 118 | 120 | 120 | 98 | 96 | 96 | 103 | 111 |
| Washington | Landfall | Suburban | 843 | 800 | 780 | 780 | 304 | 305 | 307 | 309 | 8 | 10 | 24 | 26 | 30 |
| Washington | Mahtomedi | Suburban | 8,134 | 8,100 | 8,000 | 7,900 | 3,156 | 3,170 | 3,200 | 3,200 | 2,819 | 2,784 | 2,700 | 2,700 | 2,700 |
| Washington | Marine on St. Croix | Diversified Rural | 664 | 770 | 790 | 830 | 289 | 341 | 362 | 384 | 89 | 120 | 123 | 133 | 142 |
| Washington | May Township | Diversified Rural | 2,670 | 2,930 | 2,920 | 2,990 | 1,058 | 1,180 | 1,210 | 1,250 | 161 | 192 | 192 | 214 | 220 |
| Washington | Newport | Suburban | 3,797 | 4,300 | 5,400 | 6,000 | 1,473 | 1,750 | 2,290 | 2,550 | 1,635 | 1,618 | 1,820 | 2,020 | 2,430 |
| Washington | Oak Park Heights | Suburban | 4,849 | 5,000 | 5,400 | 5,500 | 2,258 | 2,320 | 2,580 | 2,650 | 4,432 | 4,856 | 5,100 | 5,400 | 5,800 |
| Washington | Oakdale | Suburban | 28,303 | 31,900 | 32,600 | 34,600 | 11,304 | 13,200 | 13,900 | 14,900 | 9,943 | 11,258 | 11,400 | 12,100 | 12,100 |
| Washington | Pine Springs | Diversified Rural | 377 | 382 | 384 | 400 | 137 | 139 | 143 | 150 | 68 | 76 | 80 | 80 | 80 |
| Washington | Scandia | Rural Center | 3,984 | 4,400 | 4,400 | 4,500 | 1,559 | 1,730 | 1,780 | 1,860 | 586 | 718 | 730 | 770 | 830 |
| Washington | St. Marys Point | Rural Residential | 353 | 365 | 382 | 381 | 143 | 148 | 159 | 160 | 11 | 19 | 14 | 14 | 19 |
| Washington | St. Paul Park | Suburban | 5,544 | 5,600 | 6,500 | 7,500 | 2,044 | 2,170 | 2,580 | 3,010 | 1,169 | 1,271 | 1,500 | 1,890 | 2,360 |
| Washington | Stillwater | Suburban | 19,394 | 19,500 | 20,500 | 22,200 | 7,750 | 8,100 | 8,800 | 9,600 | 7,974 | 10,309 | 10,400 | 11,200 | 11,900 |
| Washington | Stillwater Township | Diversified Rural | 1,866 | 1,930 | 1,920 | 1,960 | 718 | 760 | 780 | 800 | 145 | 164 | 222 | 222 | 222 |
| Washington | West Lakeland Township | Rural Residential | 3,976 | 3,930 | 3,980 | 4,100 | 1,324 | 1,350 | 1,410 | 1,470 | 302 | 392 | 392 | 440 | 480 |
| Washington | White Bear Lake (Washington part) | Urban Edge | 397 | 400 | 440 | 550 | 207 | 207 | 238 | 300 | 136 | 160 | 160 | 166 | 173 |
| Washington | Willernie | Suburban | 515 | 520 | 510 | 510 | 220 | 225 | 226 | 230 | 150 | 233 | 233 | 234 | 240 |
| Washington | Woodbury | Suburban Edge | 75,102 | 82,700 | 86,500 | 94,200 | 27,290 | 31,400 | 34,000 | 37,400 | 21,095 | 26,370 | 28,000 | 30,200 | 33,600 |
| Washington | Washington County Total | 267,568 | 296,618 | 313,663 | 339,650 | 99,507 | 114,025 | 124,550 | 136,166 | 76,671 | 92,395 | 97,941 | 106,264 | 116,108 | |
| Region | Seven-county region | 3,163,100 | 3,374,100 | 3,559,300 | 3,814,000 | 1,239,525 | 1,357,300 | 1,454,300 | 1,563,300 | 1,543,400 | 1,725,301 | 1,814,100 | 1,901,400 | 2,061,700 |
Adopted by the Metropolitan Council, February 12, 2025
Notes:
In cities and townships where future forecasts are greater than 400, forecasts are rounded numbers.
* Shakopee Mdewakanton Sioux Community is split from and separate from Prior Lake and Shakopee to avoid double counts.
Decennial Census counts - published elsewhere - may show higher counts for Prior Lake and Shakopee as those counts include the overlapping Tribal area.
** Errata correction in January 2025.
Appendix B: Analysis and Future Work, and Negative Health Outcomes
Environmental injustices data
Environmental justice recognizes that certain communities are disproportionately affected by risks due to climate change, and quantitative analyses of environmental factors can be a vital tool in making informed decisions to repair these injustices. It is important to understand which communities are impacted, what types of environmental burdens exist, and to what extent environmental burdens harm different communities. Existing datasets have addressed these concerns at national and state levels, but there is room to expand upon these analyses and related preliminary efforts with finer spatial granularity within the seven-county region.
This section will identify existing environmental justice disparities, provide a high-level overview of existing environmental justice analyses, and set directions for future comprehensive analysis in support of environmental justice-centered policymaking.
Existing analyses
Existing analyses of environmental burdens within overburdened areas present a stark picture of environmental injustice. Two of the most prominent federal data tools for identifying overburdened communities are EJScreen and Climate and Economic Screening Tool (CEJST), which combine factors such as race, class, and place, with quantitative data on exposure to environmental burdens to define environmental injustice in a nationally consistent way.
Some state and city governments have developed their own environmental justice screening tools that focus on locally specific definitions of what constitutes an overburdened community. These tools incorporate locally available data and connect their analyses to city- and state-based processes related to budgeting, permitting or regulatory authorities, and transparency and collaboration with overburdened communities.
The Met Council has taken preliminary steps to develop quantitative and spatial environmental justice analyses and is committed to expanding on these efforts to support regionally and locally contextualized, people-centered, and data-driven decision making, aligned the Met Council’s environmental justice framework.
In early 2024, the Met Council submitted its Priority Climate Action Plan to the EPA, completing phase one of the EPA’s Climate Pollution Reduction Grant program. The $5 billion program is part of the Justice40 initiative, which requires that 40% of federal grant benefits flow to disadvantaged communities that are “marginalized, underserved, and overburdened” by pollution. The Met Council conducted preliminary analyses to examine specific environmental risks that disproportionately impact certain communities in our region. The table below highlights some of the health, social, and economic burdens that we investigated during our initial analysis of environmental disparities.
| Environmental Burden | Context and Impact on Environmental Justice |
|---|---|
| Diesel Particulate Matter | Overburdened communities, often located near commercial trucking routes, face higher exposure to diesel particulates. This exposure is linked to serious health problems including respiratory issues, cardiovascular disease, and increased cancer risk. |
| Flooding, Impervious Surfaces and Extreme Heat | Urban areas with more extensive impervious surface, such as concrete and asphalt, absorb and retain heat, exacerbating urban heat islands. Historic underinvestment in green space and trees and the disproportionate siting of industrial and transportation infrastructure in overburdened communities yields higher rates of impervious surface in overburdened communities. This leads to higher cooling costs and more heat-related illnesses. |
| Energy Cost Burden | Residents of overburdened communities are more likely to spend a larger portion of their income on energy costs because of disproportionate exposure to impervious surface, extreme heat, aging housing stock, inefficient or outdated cooling and heating systems, and less access to weatherization and energy-efficient upgrades. These factors raise energy costs for both heating and cooling in overburdened communities. |
| PM 2.5 Air Pollution | PM 2.5 is a type of air pollution that typically comes from industrial combustion and vehicle emissions. It can cause increased risks of asthma, chronic obstructive pulmonary disease, lung cancer, and premature death. Overburdened communities are disproportionately exposed to sources of PM 2.5 and compounding health disparities. |
| Lead Paint | Overburdened communities are more likely to live in older houses with lead-based paint, which can deteriorate and create dust that leads to lead poisoning. Children in these communities are particularly at risk of developing neurological and developmental issues. |
| Air Toxics | Exposure to toxic air pollutants, or air toxins, is common in overburdened communities near industrial areas. These pollutants are linked to a range of serious health effects, including respiratory problems, developmental issues, and cancer. Higher industrial activity in economically marginalized areas increases exposure. |
| Superfund/Hazardous Chemical/Waste Sites | Disproportionate proximity to Superfund and other hazardous waste sites exposes overburdened communities to a plethora of dangerous chemicals. These sites can contaminate local soil, water, and air, leading to long-term health risks including cancer, reproductive issues, and endocrine disruption. Historically, placement of hazardous sites has disproportionately occurred in overburdened communities due to racial and income-based inequities in political power and decision-making. |
Future work
To confront these and other environmental justice issues, the Met Council will expand upon its spatial and quantitative understanding of disparate exposure to environmental burdens. It will work to advance environmental justice across the region through an increased capacity to visualize, understand and contend with compounding environmental burdens. The Met Council can draw upon existing datasets, such as localized flood risk, regional land surface temperature, tree canopy inventory, affordable housing production, and the Equity Considerations for Place-Based Advocacy and Decisions dataset to advance a more comprehensive analysis of regional environmental justice issues. The inclusion of locally specific datasets such as these, alongside prominent national environmental justice datasets, is critical to ensuring that analysis is contextualized to local conditions and addresses concerns that have long been raised by overburdened communities.
The Met Council is committed to advancing research, policy, data, and tools that holistically blend different streams of inquiry, ways of knowing, and methodologies. We are committed to building tools and analysis and using the results to inform all aspects of our work. Approaching regional work in this way helps us ensure alignment with our commitment to lead on climate and build a healthy and safe equitable, and prosperous region, and environmental justice in policymaking and program implementation throughout the region.
- The Decolonial Atlas. (2018). Minneapolis–St. Paul in Dakota and Ojibwe. https://decolonialatlas.wordpress.com/2018/01/20/minneapolis-st-paul-in-dakota-and-ojibwe/
- Metropolitan Council. (2024). 2023 population estimates. metrocouncil.org/population estimates
- Metropolitan Council. (2013). Metro residents survey, 2012. https://www.lrl.mn.gov/docs/2014/other/140719.pdf
- Trust for Public Land. ParkScore index, 2015-2024. https://www.tpl.org/park-data-downloads
- Metro Transit. (2023). Development trends along transit. https://www.metrotransit.org/Data/Sites/1/media/tod/2023devtrendsalongtransitreport.pdf
- Minnesota Department of Health. (2022). Minnesota health care markets chartbook section 9: Statewide quality reporting and measurement system. https://www.health.state.mn.us/data/economics/chartbook/docs/section9.pdf
- Minnesota Compass. (2024). Quality of life measures: Health. https://www.mncompass.org/topics/quality-of-life/health
- Minnesota Compass. (2024). Quality of life measures: Civic engagement. https://www.mncompass.org/topics/quality-of-life/health
- Metropolitan Council. (2015). MetroStats: The economic competitiveness of the Twin Cities region. https://metrocouncil.org/Data-and-Maps/Publications-And-Resources/MetroStats/Economy-and-Employment/The-Economic-Competitiveness-of-the-Twin-Cities-Re.aspx
- Metropolitan Council. (2013). MetroStats: The Twin Cities in 2012: An uneven recovery. https://metrocouncil.org/Data-and-Maps/Publications-And-Resources/MetroStats/Economy-and-Employment/An-Uneven-Recovery-(2012-ACS-analysis).aspx
- Ibid.
- Metropolitan Council. (2016). MetroStats: On the rise: New residential construction in the Twin Cities region. https://metrocouncil.org/getattachment/5e028a41-d82f-43dc-8c1c-e212a0a3b52d/.aspx
- Metropolitan Council. (2016). MetroStats: The Twin Cities region produces more affordable housing in 2015. https://metrocouncil.org/Data-and-Maps/Publications-And-Resources/MetroStats/Housing/The-Twin-Cities-Produces-More-Affordable-Housing-i.aspx
- Federal Reserve Bank of Minneapolis. (2023). Waning housing affordability imperils economic growth in Minnesota. https://www.minneapolisfed.org/article/2023/waning-housing-affordability-imperils-economic-growth-in-minnesota
- Metropolitan Council. Choice, place, and opportunity: An equity assessment of the Twin Cities region. https://metrocouncil.org/Planning/Thrive-2040/Choice-Place-and-Opportunity.aspx
- Metropolitan Council. (2022). Progress on equity commitments in Thrive MSP 2040. https://metrocouncil.org/Council-Meetings/Committees/Committee-of-the-Whole/2022/04-20-2022/Info-Item-Progress-on-Thrive-Equity-Commitments-Re.aspx
- World Health Organization. (2020). WHO Director-General’s opening remarks at the media briefing on COVID-19. https://www.who.int/director-general/speeches/detail/who-director-general-s-opening-remarks-at-the-media-briefing-on-covid-19---11-march-2020
- Minnesota Employment and Economic Development. (2022). CES recovery comparison – update. https://mn.gov/deed/data/current-econ-highlights/compare-recessions.jsp
- Star Tribune. (2020, April 22). As coronavirus spreads in Minnesota, it exposes racial inequalities. https://www.startribune.com/as-coronavirus-spreads-in-minnesota-it-exposes-racial-inequalities/569840602/
- Minnesota Compass. (2020). Minnesota’s workers of color and immigrants bear the brunt of COVID-19’s impact. https://www.mncompass.org/data-insights/articles/minnesotas-workers-color-and-immigrants-bear-brunt-covid-19s-impact
- Minnesota Compass. (2020). Minnesota’s workers of color and immigrants bear the brunt of COVID-19’s impact. https://www.mncompass.org/data-insights/articles/minnesotas-workers-color-and-immigrants-bear-brunt-covid-19s-impact
- Minnesota Department of Health. (2023). Health equity and COVID-19. https://www.health.state.mn.us/communities/equity/about/covid19.htmll
- Metropolitan Council. (2020). COVID-19 Economic impacts in the Twin Cities. (https://metrocouncil.org/data-and-maps/research-and-data/research-by-topic/covid-19-economic-impacts.aspx
- The Immigrant Learning Center. (2021). Immigrant essential workers during the COVID-19 pandemic. https://www.ilctr.org/wp-content/uploads/2021/12/Immigrant-Essential-Workers-Digital-2.pdf
- University of Minnesota. (2022). Disability, employment, and COVID. https://news.d.umn.edu/articles/disability-awareness-2022
- Metropolitan Council. (2017). Understanding disparities by ability status in the Twin Cities region. https://metrocouncil.org/Data-and-Maps/Publications-And-Resources/MetroStats/Census-and-Population/Understanding-Disabilities-by-Ability-Status-in-th.aspx
- Minnesota Department of Employment and Economic Development. (2023). The labor force experience of Minnesotans with disabilities. https://mn.gov/deed/newscenter/publications/trends/september-2023/disability.jsp
- National Center for Health Statistics. (2024). Anxiety and depression. https://www.cdc.gov/nchs/covid19/pulse/mental-health.htm
- University of Minnesota (2024). Ambiguous loss: when closure doesn’t exist. https://connect.cehd.umn.edu/ambiguous-loss
- Isma, M. C., Boelen, P. A., & Lenferink, L. I. M. (2020). Prolonged grief disorder following the coronavirus (COVID-19) pandemic. Psychiatry research, 288, 113031. https://doi.org/10.1016/j.psychres.2020.113031
- The Brookings Institution. (2022). Which metro areas have fared better in the COVID-19 rebound https://www.brookings.edu/articles/which-metro-areas-have-fared-better-in-the-covid-19-rebound/
- Metropolitan Council. (2023). Visits to the regional parks and trails system in 2023. https://metrocouncil.org/Parks/Publications-And-Resources/PARK-USE-REPORTS/Annual-Use-Estimates/2023-Visits-to-the-Regional-Parks-and-Trails-Syste.aspx
- Metropolitan Council. (2023). Transportation system performance evaluation. https://metrocouncil.org/METC/media/TSPE/03-02_increase_number_share_multimodal.html#travel-by-mode
- Ibid.
- Minnesota Department of Employment and Economic Development. (2023). Working from home is working. https://mn.gov/deed/newscenter/publications/trends/march-2023/work-home.jsp
- Federal Reserve Bank of Minneapolis. (2024). Hybrid or fully remote: How is working-from-home evolving in the Ninth District? https://www.minneapolisfed.org/article/2024/hybrid-or-fully-remote-how-is-work-from-home-evolving-in-the-ninth-district
- Metropolitan Council. (2023). Transportation system performance evaluation. https://metrocouncil.org/METC/media/TSPE/03-02_increase_number_share_multimodal.html#transit-ridership.
- Metro Transit. (2024). Metro Transit ridership. https://www.metrotransit.org/performance
- Metropolitan Council. (2023). Transportation system performance evaluation https://metrocouncil.org/METC/media/TSPE/02-02_reduce_fatalities_injuries.html#traffic-fatalities-and-injuries..
- Minnesota Housing Partnership. (2024, May 23). COVID 19 and housing. https://mhponline.org/covid-19-and-housing/
- Center for Urban and Regional Affairs (CURA). (2022, December 14). The impact of the COVID-19 eviction moratorium on landlord-initiated displacement actions in Minnesota. https://www.cura.umn.edu/research/impact-covid-19-eviction-moratorium-landlord-initiated-displacement-actions-minnesota
- Hepburn, P., Haas, J., Graetz, N., Louis, R., Rutan, D. Q., Alexander, A. K., Rangel, J., Jin, O., Benfer, E., & Desmond, M. (2023). Protecting the most vulnerable: Policy response and eviction filing patterns during the COVID-19 pandemic. RSF, 9(3), 186–207. https://doi.org/10.7758/rsf.2023.9.3.08
- Norton, G., & Glidden, E. (2023). Emergency rental assistance during the COVID-19 pandemic: findings and recommendations for preventing evictions and rental arrears. Minnesota Housing Partnership. https://mhponline.org/wp-content/uploads/ERA_Report_V6_06.15.23.pdf
- Center for Urban and Regional Affairs (CURA). (2022b, December 14). The impact of the COVID-19 eviction moratorium on landlord-initiated displacement actions in Minnesota. https://www.cura.umn.edu/research/impact-covid-19-eviction-moratorium-landlord-initiated-displacement-actions-minnesota
- Minneapolis Area Realtors. (2021). Annual housing market report - Twin Cities Metro. https://maar.stats.10kresearch.com/docs/ann/2021/x/report?src=page
- Brookings. (2023, May 15). COVID-19 metro recovery watch. https://www.brookings.edu/collection/metro-recovery-watch/
- Bureau of Criminal Apprehension. (2025). Minnesota crime statistics. Minnesota Department of Public Safety. https://dps.mn.gov/divisions/bca/data-and-reports/mn-crime-statistics
- City of Minneapolis. (2022). Gun violence overview. (2022). City of Minneapolis.
- Clary, A. (2021, October 20). Minnesotans’ experiences of discrimination. APM Research Lab. https://www.apmresearchlab.org/mdc-survey/discrimination#racial-slurs
- College of Food, Agricultural and Natural Resource Sciences. (2022, October 3). CFANS Insights survey shows that 76 percent of Minnesotans are concerned about climate change. University of Minnesota. https://cfans.umn.edu/news/climate-change-survey#:~:text=about%20climate%20change-,CFANS%20Insights%20survey%20shows%20that%2076%20percent,are%20concerned%20about%20climate%20change&text=Minnesota's%20new%20Climate%20Action%20Framework,people%20living%20in%20the%20state
- Minnesota Department of Natural Resources. (2024). Minneapolis/St. Paul climate data: Historical climate data listings. https://www.dnr.state.mn.us/climate/twin_cities/listings.html
- Metropolitan Council. (2023). Water and climate change: Impacts on water and water utilities in the Twin Cities Metropolitan Area. https://metrocouncil.org/Wastewater-Water/Planning/2050-Water-Policy-Plan/Research/Water-and-Climate-Change/Water-and-Climate-Change-Research-Paper.aspx
- Ceylan, H. (2022). Effects of warmer Minnesota winters on freeze-thaw cycles. Institute for Transportation, Iowa State University. https://www.researchgate.net/publication/372763895_Effect_of_Warmer_Minnesota_Winters_on_Freeze-Thaw_Cycles_-_Minnesota_Department_of_Transportation
- Minnesota Department of Natural Resources. (2023, August 31). A history of 100 degrees in the Twin Cities. https://www.dnr.state.mn.us/climate/journal/100degreesmsp.html
- Bradley, R., Karmalkar, A., Woods, K., & Climate System Research Center (CSRC). (2015). How will global warming of 2°C affect Minnesota? Observed and projected changes in climate and their impacts. In Climate and Health Assessment. University of Massachusetts Amherst. https://www.geo.umass.edu/climate/stateClimateReports/MN_ClimateReport_CSRC.pdf
- Minnesota Department of Natural Resources. (2024). Minneapolis/St. Paul climate data: Historical climate data listings. https://www.dnr.state.mn.us/climate/twin_cities/listings.html
- Minnesota Department of Natural Resources. (2024). Climate trends. https://www.dnr.state.mn.us/climate/climate_change_info/climate-trends.html#:~:text=Since%202000%2C%20Minnesota%20has%20seen,continue%20increasing%20into%20the%20future
- Metropolitan Council. (2023). Water and climate change: Impacts on water and water utilities in the Twin Cities metropolitan area. https://metrocouncil.org/Wastewater-Water/Planning/2050-Water-Policy-Plan/Research/Water-and-Climate-Change/Water-and-Climate-Change-Research-Paper.aspx
- Minnesota Humanities Center. (2023, July 11). Native Nations of Minnesota - Minnesota Humanities Center. https://www.mnhum.org/program/native-nations-of-minnesota/
- Minnesota Historical Society. (n.d.). The U.S.-Dakota war of 1862. https://www.usdakotawar.org/
- U.S. Census Bureau, 2020. Demographic and housing characteristic summary file 1. URL: data.census.gov. This number is rounded to the nearest 1,000 and reflects people who identified with this group regardless of whether they also identified with other groups, though knowledge within the American Indian community suggest this is an undercount.
- Homestead Act, et al.
- Ratsabout, Saengmany. (2022). Immigrants and refugees in Minnesota: Connecting past and present. MNopedia, Minnesota Historical Society. http://www.mnopedia.org/immigrants-and-refugees-minnesota-connecting-past-and-present
- Hanson, Krista. (2020) St. Paul resettlement committee. MNopedia, Minnesota Historical Society. http://www.mnopedia.org/group/st-paul-resettlement-committee
- Lee, Mai Na M. (2021). Hmong and Hmong Americans in Minnesota. MNopedia, Minnesota Historical Society. http://www.mnopedia.org/hmong-and-hmong-americans-minnesota
- Wilhide, Anduin. (2021). Somali and Somali American experiences in Minnesota. MNopedia, Minnesota Historical Society. http://www.mnopedia.org/somali-and-somali-american-experiences-minnesota
- Metropolitan Council. (2023). Population and employment in the Twin Cities region in 2050. https://metrocouncil.org/Data-and-Maps/Publications-And-Resources/MetroStats/Land-Use-and-Development/The-Regional-Forecast-Update-2023.aspx
- Metropolitan Council. (May 2024). 2023 population estimates (preliminary).
- Ibid.
- Ibid.
- Metropolitan Council. (2023). Forecast methodology. https://metrocouncil.org/Data-and-Maps/Publications-And-Resources/Files-and-reports/Forecast-Methodology-Report-(2023).aspx
- Metropolitan Council. (2024). Review 2050 local forecasts. https://metrocouncil.org/Forecasts
- Metropolitan Council. Discover census trends: Four decades of geographically aligned data for the Twin Cities Region. https://metrotransitmn.shinyapps.io/census-2020/
- Ibid.
- Metropolitan Council. (2023). Population and employment in the Twin Cities region in 2050. https://metrocouncil.org/Data-and-Maps/Publications-And-Resources/MetroStats/Land-Use-and-Development/The-Regional-Forecast-Update-2023.aspx
- O’Neill, T. (2023). Twin Cities metro area: 2023 regional profile. Minnesota Department of Employment and Economic Development. https://mn.gov/deed/assets/091323_TWINCITIES_tcm1045-133250.pdf
- Metropolitan Council. (2020). COVID-19 economic impacts in the Twin Cities. https://metrocouncil.org/Data-and-Maps/Research-and-Data/Research-by-topic/COVID-19-Economic-Impacts.aspx
- Wolter, E. (2020, September 15). Minnesota’s workers of color and immigrants bear the brunt of COVID-19’s impact. Minnesota Compass. https://www.mncompass.org/data-insights/articles/minnesotas-workers-color-and-immigrants-bear-brunt-covid-19s-impact
- Sajjanhar, A., Mohammed, D. (2021). Immigrant essential workers during the COVID-19 pandemic. The Immigrant Learning Center. https://www.ilctr.org/wp-content/uploads/2021/12/Immigrant-Essential-Workers-Digital-2.pdf
- Metropolitan Council. (2020). COVID-19 economic impacts in the Twin Cities. https://metrocouncil.org/Data-and-Maps/Research-and-Data/Research-by-topic/COVID-19-Economic-Impacts.aspx
- Sajjanhar, A., Mohammed, D. (2021). Immigrant essential workers during the COVID-19 pandemic. The Immigrant Learning Center. https://www.ilctr.org/wp-content/uploads/2021/12/Immigrant-Essential-Workers-Digital-2.pdf
- Metropolitan Council. (2017). Understanding disparities by ability status in the Twin Cities region. https://metrocouncil.org/Data-and-Maps/Publications-And-Resources/MetroStats/Census-and-Population/Understanding-Disabilities-by-Ability-Status-in-th.aspx
- Casale, O. (2023, September). The labor force experience of Minnesotans with disabilities. Minnesota Department of Employment and Economic Development. https://mn.gov/deed/newscenter/publications/trends/september-2023/disability.jsp
- Terakanambi, S. (2024, March 22). Barriers to employment: An overview. Minnesota Council on Disability. https://www.disability.state.mn.us/2024/05/22/barriers-to-employment-an-overview/
- Minnesota Department of Health. (2023b, December 4). Disabilities and unique health needs during the COVID-19 pandemic. https://www.health.state.mn.us/communities/equity/about/covid19_disabilities.html
- Casale, O. (2023, September).
- Hopkins, E. (2022, October 24). Disability, employment, and COVID. UMD News Center | University of Minnesota Duluth. https://news.d.umn.edu/articles/disability-awareness-2022
- Minnesota Department of Health. (2024, May 24). About long COVID. https://www.health.state.mn.us/communities/equity/about/covid19_disabilities.html
- U.S. Department of Health Human Services, Office for Civil Rights, & U.S. Department of Justice Civil Rights Division Disability Rights Section. (2021). Guidance on “long COVID” as a disability under the ADA, Section 504, and Section 1557 [Report]. https://archive.ada.gov/long_covid_joint_guidance.pdf
- Hopkins, E. (2022, October 24).
- Schaffhauser, A. (2022, September). Will a record-setting hot labor market bring labor force participation back to pre-pandemic levels? Minnesota Department of Employment and Economic Development. https://mn.gov/deed/newscenter/publications/trends/september-2022/labor-force.jsp
- Garcia Luna, E., & Chinander, H. (2022, July 15). The COVID retirement surge. Federal Reserve Bank of Minneapolis. https://www.minneapolisfed.org/article/2022/the-covid-retirement-surge
- Metropolitan Council (2021). Progress on equity commitments in Thrive MSP 2040. https://metrocouncil.org/Council-Meetings/Committees/Committee-of-the-Whole/2022/04-20-2022/Info-Item-Progress-on-Thrive-Equity-Commitments-Re.aspx
- Dionne J, Cooney M, Fernandez-Baca D. 30-year retrospective – Demographic trends, American Indian health status in Minnesota. St. Paul, MN: Minnesota Center for Health Statistics, Minnesota Department of Health, 2021. https://www.health.state.mn.us/communities/equity/reports/maihsr01demographics_report.pdf
- National Underground Railroad Freedom Center. (2024). Modern abolition. Retrieved July 24, 2024, from https://freedomcenter.org/learn/modern-day-abolition/
- Lehman, C. P. (2019). Slavery’s reach: Southern slaveholders in the North Star State. https://muse.jhu.edu/book/67136
- Banaji, M.R., Fiske, S.T., Massey, D.S. (2021). Systemic racism: individuals and interactions, institutions and society. Cogn Res Princ Implic. 6(1):82. doi: 10.1186/s41235-021-00349-3 https://www.ncbi.nlm.nih.gov/pmc/articles/PMC8688641/.
- Comrie, J. W., Landor, A. M., Riley, K. T., & Williamson, J. D. (2022). Anti-Blackness/colorism. In Moving toward antibigotry: Collected essays from the Center for Antiracist Research’s Antibigotry Convening. Boston University. https://www.bu.edu/antiracism-center/files/2022/06/Moving-Towards-Antibigotry.pdf
- Schwartz GL, Jahn JL (2020) Mapping fatal police violence across U.S. metropolitan areas: Overall rates and racial/ethnic inequities, 2013-2017. PLoS ONE 15(6): e0229686. https://doi.org/10.1371/journal.pone.0229686
- Davis, A.Y. From the prison of slavery to the slavery of prison: Frederick Douglass and the convict lease system. (1997). Papers of Angela Y. Davis, 1937-2017 (inclusive), 1968-2006 (bulk), MC 940, 21.4-21.5., Box: 21. Schlesinger Library, Radcliffe Institute. https://id.lib.harvard.edu/ead/c/sch01609c00361/catalog. Accessed July 24, 2024.
- National Association for the Advancement of Colored People. (n.d.). The Twin Cities economic inclusion plan. https://mn.gov/mdhr/assets/NAACP%20EconomicInclusionPlanTwinCities-3_tcm1061-528066.pdf
- Cole, C., Townsend, B., Mani, A., Roseler, J., Lynfield, R. (2022). Establishing a baseline measure for evaluating upstream, primary prevention efforts: Quantifying fatal events associated with law enforcement service calls and encounters in Minnesota – 2016-2021. Minnesota Department of Health. https://www.health.state.mn.us/communities/injury/documents/leafe2021.pdf
- Woods, T. (2021, March 6). Slavery and the U.S. prison system. Issues in Modern Slavery. https://www.globalpolicyjournal.com/blog/06/05/2021/slavery-and-us-prison-system
- Denvir, D. (2015, May 29). Minneapolis has major racial disparities in its policing. Bloomberg CityLab. https://www.bloomberg.com/news/articles/2015-05-29/minneapolis-has-major-racial-disparities-in-its-policing-according-to-a-new-aclu-report
- U.S. Department of Justice. (2019, December 2). Justice Department sues City of Hesperia, California and San Bernardino County Sheriff’s Department for discriminating against African American and Latino renters through the enactment and enforcement of a rental ordinance [Press release]. https://www.justice.gov/opa/pr/justice-department-sues-city-hesperia-california-and-san-bernardino-county-sheriff-s
- Housing Matters (2024, January 10). Legal challenges to crime-free housing ordinances bring effectiveness into question. https://housingmatters.urban.org/articles/legal-challenges-crime-free-housing-ordinances-bring-effectiveness-question
- U.S. Department of Justice. (2023, November 7). Justice Department finds Minnesota city’s “crime-free” housing program discriminates against tenants with mental health disabilities [Press release]. https://www.justice.gov/opa/pr/justice-department-finds-minnesota-citys-crime-free-housing-program-discriminates-against
- National Archives. (2021, June 28). The great migration (1910-1970). https://www.archives.gov/research/african-americans/migrations/great-migration#:~:text=The%20Great%20Migration%20was%20one,the%201910s%20until%20the%201970s
- University of Minnesota. (2022). Maps & data | Mapping prejudice. Retrieved January 11, 2024, from https://mappingprejudice.umn.edu/racial-covenants/maps-data
- National Geographic. (n.d.). MapMaker: Redlining in the United States. https://education.nationalgeographic.org/resource/mapmaker-redlining-united-states/
- Gibbons, A., Perry, A. M., Harshbarger, D., Ray, R., & Elizondo, S. (2021, September 1). Homeownership, racial segregation, and policy solutions to racial wealth equity. Brookings.
- Beer, T. (2019, November 12). Neighborhood resistance to I-94, 1953–1965. MNopedia, Minnesota Historical Society. Retrieved July 25, 2024, from https://www.mnopedia.org/event/neighborhood-resistance-i-94-1953-1965
- Kleven, S. (2021, November 18). The construction of the 35W freeway meant destruction for Black neighborhoods in Minneapolis. A new museum exhibit looks back at the damage. Sahan Journal. https://sahanjournal.com/culture-community/minneapolis-35w-construction-black-neighborhood-destruction-hennepin-history-museum/
- Minnesota Historical Society Library. (2023). LibGuides: African American civil rights movement: Overview. https://libguides.mnhs.org/civilrights
- U.S. Department of Housing and Urban Development. (n.d.). History of fair housing. https://www.hud.gov/program_offices/fair_housing_equal_opp/aboutfheo/history
- Kolnick, Jeff. (2016, March 7). Minnesotanos: Latino journeys in Minnesota. MNopedia, Minnesota Historical Society. www.mnopedia.org/minnesotanos-latino-journeys-minnesota#:~:text=Latinos%20moved%20to%20Minnesota%20haltingly,out%20of%20Texas%20and%20Mexico
- Saldivar, S. (2024, May 6). The Chicano movement of the 1960s and 1970s in Westside St. Paul. MinnPost. https://www.minnpost.com/mnopedia/2024/05/the-chicano-movement-of-the-1960s-and-1970s-in-westside-st-paul/#:~:text=Their%20political%20and%20social%20work,in%20Minnesota%20communities%20%E2%80%94%20particularly%20St
- Met Council. Community profile for Twin Cities region. Metrocouncil.org. https://stats.metc.state.mn.us/profile/detail.aspx?c=R11000#POPRACEETH”
- "Asian Minnesotans." MN Compass, www.mncompass.org/asian-minnesotans
- Liu, Yuqing. How did Minnesota become a hub for Hmong people. Star Tribune, 8 Sept. 2023, www.startribune.com/how-did-minnesota-become-a-hub-for-hmong-people/600302837/
- Chhith, Alex, and Susan Du. Activism on the rise in Minnesota's diverse Asian American communities. Star Tribune, 24 Mar. 2021, www.startribune.com/activism-on-the-rise-in-minnesota-s-diverse-asian-american-communities/600038174/
- Callaghan, Peter. Anti-Asian bias spurs renewed effort to update Minnesota's hate crime law. MinnPost, 6 Feb. 2023, www.minnpost.com/state-government/2023/02/anti-asian-bias-spurs-renewed-effort-to-update-minnesotas-hate-crime-law/
- Goff, Myah. One of St. Paul's oldest Hmong cultural centers celebrates expansion, looks to future. Sahan Journal, 2 Jul. 2024, sahanjournal.com/culture-community/st-paul-hmong-cultural-center-museum-expansion/.
- Chow, K. (2017, May 5). As Chinese Exclusion Act turns 135, experts point to parallels today. NPR. https://www.npr.org/sections/codeswitch/2017/05/05/527091890/the-135-year-bridge-between-the-chinese-exclusion-act-and-a-proposed-travel-ban
- Debs, E. (2024, February 25). How the legacy of 19th & 20th century Chinese exclusion continues to permeate immigration rhetoric and policy. Columbia Political Review. https://www.cpreview.org/articles/2022/12/how-the-legacy-of-19th-amp-20th-century-chinese-exclusion-continues-to-permeate-immigration-rhetoric-and-policy
- Human Rights First. (2023). Xenophobia & anti-immigrant extremism: From fringe to mainstream. https://humanrightsfirst.org/wp-content/uploads/2023/09/FINAL-Xenophobia-2023.pdf
- Misra, S., Kwon, S. C., Abraído-Lanza, A. F., Chebli, P., Trinh-Shevrin, C., & Yi, S. S. (2021). Structural racism and immigrant health in the United States. Health Education & Behavior, 48(3), 332–341. https://doi.org/10.1177/10901981211010676
- Warren, Peter. What are the top five immigrant groups in Minnesota. Star Tribune, 26 Mar. 2021, www2.startribune.com/minnesota-immigration-countries-top-five-mexico-somalia-india-laos-vietnam/600032203/.
- Williamson-Lee, Jayne. Is Minnesota home to the largest number of Somali Americans in the country? MinnPost, 11 Jul. 2023, www.minnpost.com/fact-briefs/2023/07/is-minnesota-home-to-the-largest-number-of-somali-americans-in-the-country/#:~:text=Minnesota%20Compass%20reports%20a%20total%20of%2086%2C610%20Somali,to%202021%20U.S.%20Census%20American%20Community%20Survey%20data.
- Rao, Maya. How did the Twin Cities become a hub for Somali immigrants? Star Tribune, 21 Jun. 2019, www2.startribune.com/how-did-the-twin-cities-and-minnesota-become-a-hub-for-somali-immigrants/510139341/.
- Minnesota Department of Health. (n.d.) Refugee health statistics. https://www.health.state.mn.us/communities/rih/stats/index.html#NaN
- Sanctuary cities in Minnesota – USCIS guide. (n.d.). https://www.uscisguide.com/state-regulations-and-laws/sanctuary-cities-in-minnesota/
- Crann, T. & Felegy, A. (2023, February 1). Refugee resettlement in Minnesota: How everyday citizens can help. Sahan Journal. https://sahanjournal.com/news-partners/minnesota-refugee-resettlement-citizen-sponsors-welcome-corps/
- Narragon, M., Wiley, D., McManus, D., Li, V., Li, K., Wu, X., & Karamon, K. (2021). Racial and ethnic valuation gaps in home purchase appraisals. FreddieMac. https://www.freddiemac.com/fmac-resources/research/pdf/202109-Note-Appraisal-Gap.pdf
- Khoshkhoo, N. A., Geiger Schwarz, A., Godinez Puig, L., Glass, C., Holtzman, G. S., Nsoesie, E. O., & Gonzalez Rose, J. B. (2022). Toward evidence-based antiracist policymaking: Problems and proposals for better racial data collection and reporting. Boston University Center for Antiracist Research. https://www.bu.edu/antiracism-center/files/2022/06/Toward-Evidence-Based-Antiracist-Policymaking.pdf
- Government Alliance on Race and Equity. (2024). Why race & government. https://www.racialequityalliance.org/who-we-are/our-approach
- U.S. EPA. (2024, July 10). What is the definition of “overburdened community” that is relevant for EPA Actions and Promising Practices? https://www.epa.gov/caa-permitting/what-definition-overburdened-community-relevant-epa-actions-and-promising-practices#:~:text=The%20term%20is%20used%20to%20describe%20the%20minority%2C,cumulative%20impacts%20or%20greater%20vulnerability%20to%20environmental%20hazards
- U.S. EPA. 2021. Climate change and social vulnerability in the United States: A focus on six impacts. U.S. Environmental Protection Agency, EPA 430-R-21-003. www.epa.gov/cira/social-vulnerability-report
- National Geographic. (n.d.). MapMaker: Redlining in the United States. https://education.nationalgeographic.org/resource/mapmaker-redlining-united-states/
- Mubarak, A., & Zhan, Y. (2021, December 21). Mapping block-level segregation: The Twin Cities’ Black population, 1980-2010. Minnesota Population Center Blog. https://blog.popdata.org/mapping-segregation/
- Hanson-Agwatu, A., & Damirg, A. (2022, April 1). Environmental racism in the twin cities. https://storymaps.arcgis.com/stories/4b4f5905fd494a2dac8cb5d52c1fb92a
- Plumer, B., Popovich, N., & Palmer, B. (2022, March 9). How decades of racist housing policy left neighborhoods sweltering. The New York Times. https://www.nytimes.com/interactive/2020/08/24/climate/racism-redlining-cities-global-warming.html
- State of Minnesota. (n.d.). Disproportionate heat risks for communities of color. Our Minnesota Climate. https://climate.state.mn.us/disproportionate-heat-risks
- Minnesota Department of Health and Minnesota Pollution Control Agency. (2022). Life and breath: Twin Cities metro area. https://data.web.health.state.mn.us/documents/20147/0/LIFE+and+BREATH+III+METRO+BRIEF-FINAL.pdf/708c1326-4d48-d2a0-64e6-6ae7f6e2995f
- Minnesota Department of Health. (2024, January 22). ACEs and social determinants of health. https://www.health.state.mn.us/communities/ace/sdoh.html
- Minnesota Department of Health and Minnesota Pollution Control Agency. (2022). Life and breath: Twin Cities metro area. https://data.web.health.state.mn.us/documents/20147/0/LIFE+and+BREATH+III+METRO+BRIEF-FINAL.pdf/708c1326-4d48-d2a0-64e6-6ae7f6e2995f
- Nega, T. H., Chihara, L., Smith, K., & Jayaraman, M. (2013). Traffic noise and inequality in the Twin Cities, Minnesota. Human and Ecological Risk Assessment: An International Journal, 19(3), 601–619. https://doi.org/10.1080/10807039.2012.691409
- Weir, K. (2020). Nurtured by nature: Psychological research is advancing our understanding of how time in nature can improve our mental health and sharpen our cognition. Monitor on Psychology, 51(4), 50. https://www.apa.org/monitor/2020/04/nurtured-nature
- Nesbitt, L., Meitner, M. J., Girling, C., Sheppard, S. R., & Lu, Y. (2019). Who has access to urban vegetation? A spatial analysis of distributional green equity in 10 US cities. Landscape and Urban Planning, 181, 51–79. https://doi.org/10.1016/j.landurbplan.2018.08.007
- Dai, D. (2011). Racial/ethnic and socioeconomic disparities in urban green space accessibility: Where to intervene? Landscape and Urban Planning, 102(4), 234–244. https://doi.org/10.1016/j.landurbplan.2011.05.002
- Wolch, J. R., Byrne, J., & Newell, J. P. (2014). Urban green space, public health, and environmental justice: The challenge of making cities ‘just green enough.’ Landscape and Urban Planning, 125, 234–244. https://doi.org/10.1016/j.landurbplan.2014.01.017
- State of Minnesota. (n.d.). Minnesota is getting warmer and wetter. Our Minnesota Climate. https://climate.state.mn.us/minnesota-getting-warmer-and-wetter
- Minnesota Department of Health & Minnesota Pollution Control Agency. (2022). Life and breath: Twin Cities metro area. https://data.web.health.state.mn.us/documents/20147/0/LIFE+and+BREATH+III+METRO+BRIEF-FINAL.pdf/708c1326-4d48-d2a0-64e6-6ae7f6e2995f
- State of Minnesota. (n.d.). Disproportionate heat risks for communities of color. Our Minnesota Climate. https://climate.state.mn.us/disproportionate-heat-risks
- Minnesota Pollution Control Agency. (2024, July 23). To counter climate change-related flooding, communities across Minnesota get creative. https://www.pca.state.mn.us/news-and-stories/how-climate-resilience-grants-prevent-flooding#:~:text=According%20to%20an%20MPCA%20survey,have%20seen%20more%20frequent%20flooding
- Minnesota Department of Health. (2023, June). Childhood lead exposure: risk factors. Minnesota Public Health Data Access. https://data.web.health.state.mn.us/lead_risk
- Delegates to the First National People of Color Environmental Leadership Summit. (1991). Principles of environmental justice. https://www.ejnet.org/ej/principles.pdf
- Minnesota Pollution Control Agency. (n.d.). Understanding environmental justice in Minnesota. https://mpca.maps.arcgis.com/apps/MapSeries/index.html?appid=f5bf57c8dac24404b7f8ef1717f57d00#map
- United States Environmental Protection Agency & Office of Air and Radiation. (2023). Climate pollution reduction grants program: Technical reference document for states, municipalities and air pollution control agencies benefits analyses: Low-income and disadvantaged communities. https://www.epa.gov/system/files/documents/2023-05/LIDAC%20Technical%20Guidance%20-%20Final_2.pdf
- Metropolitan Council. (n.d.). Discrimination and Title VI. https://metrocouncil.org/About-Us/What-We-Do/Office-of-Equity-and-Equal-Opportunity/Discrimination-Complaints/Public-Service-Discrimination/Discrimination-and-Title-VI.aspx
- The White House. (2024, February 28). Justice40 Initiative | Environmental Justice. https://www.whitehouse.gov/environmentaljustice/justice40/
- U.S. Census Bureau, 2020. Demographic and Housing Characteristic Summary File 1. URL: data.census.gov. This number is rounded to the nearest 1,000 and reflects people who identified with this group regardless of whether if they also identified with other groups, though knowledge within the American Indian community suggest this is an undercount.
- O’Neill, T. (2024). Twin cities metro regional disparities by race and origin. Minnesota Department of Employment and Economic Development. https://mn.gov/deed/assets/24-02TC_tcm1045-341196.pdf
- Minnesota Department of Health. (2024). The health of American Indian Families in Minnesota: a data book. https://www.health.state.mn.us/people/womeninfants/womenshealth/amerindianreport.pdf
- Grunewald, R. and Nath, A. (2019). A statewide crisis: Minnesota’s education achievement gaps. Federal Bank Reserve of Minneapolis. achievement-gaps-mn-report.pdf (minneapolisfed.org)
- Nelson-Dusek, S., Decker Gerrard, M., & Sales, R. (2024). Homelessness in the Twin Cities and Greater Minnesota. Wilder Research. https://www.wilder.org/sites/default/files/2023Homeless_TwinCities-GreaterMN_Brief1_6-24.pdf
- American Heart Association. (2020, May 20). How happiness affects health. https://www.heart.org/en/university-hospitals-harrington-heart-and-vascular/how-happiness-affects-health
- Blavin, F., & Gangopadhyaya, A. (2022). How the minimum wage affects the health insurance coverage, safety net program participation, and health of low-wage workers and their families. Urban Institute.
- Gee, G.C., Ford, C.L. (2011). Structural racism and health inequities: Old issues, new directions. Du Bois Rev.; 8(1):115-132. https://doi.org/10.1017/S1742058X11000130
- American Public Health Association. (2021) Healing through policy: Creating pathways to racial justice. https://www.apha.org/Topics-and-Issues/Racial-Equity/Healing-Through-Policy
- Ohio Department of Health. (2019). Land use and health: Best practices report. https://odh.ohio.gov/know-our-programs/health-promotion/resources/land-use-and-health-best-practices-report
- Ramsey County Public Health. Healthy food access. (2018). https://www.ramseycounty.us/sites/default/files/Departments/Public%20Health/CHA/Healthy%20Food%20Access_final.pdf
- Ohio Department of Health, (2019).
- Robert Wood Johnson Foundation. Understanding the social determinants of health. https://www.rwjf.org/en/our-vision/focus-areas/healthy-communities-social-determinants-of-health.html
- LaVeist TA, Pérez-Stable EJ, Richard P, et al. The economic burden of racial, ethnic, and educational health inequities in the US. JAMA. 2023;329(19):1682–1692. doi:10.1001/jama.2023.5965. For details on how the estimated cost burdens were calculated, please contact the Met Council Community Development - Research team.
- U.S. Department of Health and Human Services, Office of Disease Prevention and Health Promotion. (2020). Neighborhood and built environment - healthy people 2030. https://odphp.health.gov/healthypeople/objectives-and-data/browse-objectives/neighborhood-and-built-environment
- Some of the burden to residents estimated for race/ethnicity are again part of the calculated education-based education burden because of the substantial race-based inequities in educational opportunity. The $4 billion economic burden for the region is a conservative estimate.
- Centers for Disease Control and Prevention, National Center for Chronic Disease Prevention and Health Promotion, Division of Population Health. (2015). BRFSS prevalence & trends data. https://nccd.cdc.gov/BRFSSPrevalence/rdPage.aspx?rdReport=DPH_BRFSS.ExploreByTopic&irbLocationType=StatesAndMMSA&islClass=CLASS08&islTopic=TOPIC41&islYear=2022&rdRnd=60015
- Ibid.
- U.S. Department of Health and Human Services, Office of Disease Prevention and Health Promotion. (2020)
- County Health Rankings & Roadmaps. Zoning regulation and land use policy reforms. https://www.countyhealthrankings.org/strategies-and-solutions/what-works-for-health/strategies/zoning-regulation-and-land-use-policy-reforms; Langlois, M., A. Wasfi, R., A. Ross, N., & M. El-Geneidy, A. (2016). Can transit-oriented developments help achieve the recommended weekly level of physical activity? Journal of Transport & Health, 3(2), 181–190. https://doi.org/10.1016/j.jth.2016.02.006
- Center for Disease Control. (April 2021). Loneliness and social isolation linked to serious health conditions.
- U.S. Department of Health and Human Services. Protecting youth mental health: The U.S. Surgeon General’s advisory. (2021). https://www.hhs.gov/sites/default/files/surgeon-general-youth-mental-health-advisory.pdf
- Gómez-Baggethun, E. & Gren, A. Urban ecosystem services. (2013). In T. Elmquist et al. (eds.), Urbanization, biodiversity and ecosystem services: Challenges and opportunities: A global assessment, pp. 175-251.
- Metropolitan Council. 2021 Parks and trails visitor study. 2022. https://metrocouncil.org/Parks/Research/Visitor-Study.aspx#Report
- County Health Rankings & Roadmaps. Air and water quality. 2022. https://www.countyhealthrankings.org/health-data/health-factors/physical-environment/air-and-water-quality
- Intranasal, M, & Searcey, D. (September 3, 2023). Big farms and flawless fries are gulping water in the land of 10,000 lakes. New York Times. https://www.nytimes.com/interactive/2023/09/03/climate/minnesota-drought-potatoes.html?unlocked_article_code=1.0k0.Ur_k.8TmT5cIFMdK_&smid=url-share
- American Lung Association. (2020). Health impact of air pollution. lung.org
- Hammer, M.S., Swinburn, T.K., Neitzel, R.L. (2014, February). Environmental noise pollution in the United States: Developing an effective public health response. Environ Health Perspectives. 122(2):115-9. nih.gov
- U.S. Global Change Research Program. Chapter 2: Temperature-related death and illness. The impacts of climate change on human health in the United States: A scientific assessment. globalchange.gov
- Miles-Novelo, A., Anderson, C. A. (2022). Climate change and human behavior: Impacts of a rapidly changing climate on human aggression and violence. Cambridge: Cambridge University Press.
- Bergeron, E. (2019). Adequate housing is a human right. Human Rights Magazine. Vol 44, No. 2: Housing. americanbar.org
- National Health Care for the Homeless Council. (2019). Homelessness & health: What’s the connection? nhchc.org
- Wilder Research. (2023). Minnesota homeless study: Single night count of people experiencing homelessness: Minnesota homeless study counts fact sheet. Wilder.org
- Riva A., et. al. (2022, November 30). Can homes affect well-being? A scoping review among housing conditions, indoor environmental quality, and mental health outcomes. International Journal of Environmental Research in Public Health. 19(23). www.ncbi.nlm.nih.gov
- Chapple, K., Loukaitou-Sideris, A., Miller, A., & Zeger, C. (2023). The role of local housing policies in preventing displacement: A literature review. Journal of Planning Literature. 38(2), 200-214.
- Minneapolis Federal Reserve. 2024. Twin Cities region meets ambitious housing goals for a second year but has much work left to do. Minneapolisfed.org
- Penninx, B.W.J.H., Benros, M.E., Klein, R.S. et al. (2022). How COVID-19 shaped mental health: from infection to pandemic effects. Nature Medicine 28. nature.com
- Leyden, Kevin M., Michael J. Hogan, Lorraine D’Arcy, Brendan Bunting, and Sebastiaan Bierema. (2024). Walkable neighborhoods: Linkages between place, health, and happiness in younger and older adults. Journal of the American Planning Association 90, no. 1 (2024): 101-114. tandfonline.com
- Barkley Brown, Raj. (2021, July 6). Despite recent gains, Minnesota’s entrepreneurs of color face persistent barriers. Federal Reserve Bank of Minneapolis. www.minneapolisfed.org/article/2021/despite-recent-gains-minnesotas-entrepreneurs-of-color-face-persistent-barriers.
- Ibid.
- Metropolitan Council. The regional forecast: Population and employment in the Twin Cities region in 2050. 2023 Update.
- U.S. Bureau of Labor Statistics, Current Employment Statistics. Peer regions include 15 metros with over 1.5 million jobs.
- O’Neill, T. (June 2023). The Twin Cities’ Labor Market in 2023. Minnesota Department of Employment and Economic Development. https://mn.gov/deed/newscenter/publications/trends/june-2023/metro.jsp
- Cates, L. (2024, July 30). Understanding America’s labor shortage: The most impacted states. U.S. Chamber of Commerce. https://www.uschamber.com/workforce/the-states-suffering-most-from-the-labor-shortage?%20state=mnhttps://www.uschamber.com/workforce/the-states-suffering-most-from-the-labor-shortage? state=mn
- The net migration of the population aged 25-34 hovered around zero between 2019 and 2023. https://www.minneapolisfed.org/article/2024/twin-cities-metro-migration-dashboard
- O’Neill, T. (2024). Twin Cities metro regional disparities by race and origin. Minnesota Department of Employment and Economic Development. https://mn.gov/deed/assets/24-02TC_tcm1045-341196.pdf
- Minnesota DEED. (n.d.). Job vacancy survey, 2022. https://apps.deed.state.mn.us/lmi/jvs/Results.aspx
- Metropolitan Council staff analysis of Census Bureau, ACS PUMS, 2022 data.
- O’Neil, T. (2023). The importance of immigration in the Twin Cities metro area. Minnesota Department of Employment and Economic Development. https://mn.gov/deed/assets/082223_immigration_TC_tcm1045-324882.pdf
- O’Neil, T. (2023). Spotlight: A changing workforce in the metro area. Minnesota Department of Employment and Economic Development. https://mn.gov/deed/newscenter/publications/review/december-2023/spotlight.jsp
- O’Neill, T. (June 2023). The Twin Cities’ labor market in 2023. Together these three industries accounted for over half of the region’s total job vacancies. https://mn.gov/deed/newscenter/publications/trends/june-2023/metro.jsp
- Ibid. For the minimum educational requirements of these occupations, see Employment Outlook Projections. https://mn.gov/deed/data/data-tools/employment-outlook/
- O’Neill, T. (2023). The Twin Cities’ labor market in 2023. Minnesota Department of Employment and Economic Development; Center for Economic Inclusion. (2024).
- Center for Economic Inclusion. (2024). Standing in the gap: The case for family sustaining wages in Minnesota. https://www.mcknight.org/wp-content/uploads/Family-Sustaining-Wages-Center-for-Economic-Inclusion-Report-2.pdf
- Metropolitan Council. Housing policy plan dashboard. https://metrocouncil.org/Housing/Planning/Housing-Policy-Plan-Dashboard/Housing-Dashboard-Cost-Burden-(1).aspx
- Metropolitan Council analysis of median home values, median rents, and median incomes between 2010 and 2022.
- O’Neill, T. (2024). Twin Cities metro regional disparities by race and origin. Minnesota Department of Employment and Economic Development. https://mn.gov/deed/assets/24-02TC_tcm1045-341196.pdf
- Metropolitan Council staff analysis of Census Bureau, Quarterly Workforce Indicators data.
- Minnesota Chamber of Commerce. (n.d.) 2024 state of business retention and expansion in Minnesota. Grow expansion report 2024.pdf
- The region ranked 19th among the top 50 metropolitan areas. Between 2020 and 2023, venture capital flow into the region declined by 48%. Guide: Dealroom. Retrieved July 2, 2024. https://dealroom.co/guides/usa
- Minnesota Chamber of Commerce. (n.d.) 2024 State of business retention and expansion in Minnesota. Grow expansion report 2024.pdf
- Ibid.
- Metropolitan Council analysis of Census Bureau, LEHD Quarterly Workforce Indicators.
- Metropolitan Council analysis of Minnesota Secretary of State, Business Snapshot database.
- Federal Reserve Bank of Minneapolis. (2021). Despite recent gains, Minnesota’s entrepreneurs of color face persistent barriers. https://www.minneapolisfed.org/article/2021/despite-recent-gains-minnesotas-entrepreneurs-of-color-face-persistent-barriers
- Ibid.
- Ibid. White-owned firms tend to be concentrated in high-revenue industries such as Construction, Finance and Insurance, and the Professional, Scientific and Technical Services. In contrast, BIPOC-owned firms are most heavily represented in lower-revenue industries such as Transportation and Warehousing, Retail Trade, and Health Care and Social Assistance.
- Metropolitan Council analysis of Minnesota DEED, Current Employment Statistics. June 2024.
- O’Neill, T. (2023). The importance of immigration in the Twin Cities metro. Minnesota Department of Employment and Economic Development. https://mn.gov/deed/assets/082223_immigration_TC_tcm1045-324882.pdf
- According to a 2024 Milken Institute study, the region ranked 51 among 200 large metros on the number of industries the market share of which exceeded the national average. Milken Institute. (2024, February). Best-Performing Cities: Focus on Sustainable Growth and Resilience. p. 31.
- Metropolitan Council, Travel Behavior Inventory data.
- Xu, K., Chan, G., Kannan, S. (2023, December). Sharing the sun community solar project data. NREL Data Catalog. Golden, CO: National Renewable Energy Laboratory.
- Clean Energy Economy Minnesota. (2024, May 2). 2024 Minnesota energy factsheet. https://www.cleanenergyeconomymn.org/factsheet
- Fishbane, L. and Tomer, A. (2020, February). Neighborhood broadband data makes it clear: We need and agenda to fight digital poverty. Brookings Institute. https://www.brookings.edu/articles/neighborhood-broadband-data-makes-it-clear-we-need-an-agenda-to-fight-digital-poverty/
- The Office of Broadband Development, Digital opportunity plan. https://mn.gov/deed/programs-services/broadband/adoption/
- Minnesota Department of Transportation, Minnesota broadband initiative. https://www.dot.state.mn.us/broadband/
- Schauberger, B., Archontoulis, S., Arneth, A., Balkovic, J., Ciais, P., Deryng, D., ... & Frieler, K. (2017). Consistent negative response of US crops to high temperatures in observations and crop models. Nature communications, 8(1), 13931.
- State of Minnesota. Minnesota’s climate action framework. Retrieved July 26, 2024, from https://climate.state.mn.us/sites/climate-action/files/Climate%20Action%20Framework.pdf
- Metropolitan Council. Climate pollution reduction grant. https://metrocouncil.org/Planning/Climate/Climate-Pollution-Reduction-Grant.aspx
- Metropolitan Council. (2022). Climate action work plan. https://metrocouncil.org/Planning/Climate/Climate-Action-Work-Plan/Climate-Action-Work-Plan.aspx
- SolSmart Program: https://solsmart.org/
- American Council for an Energy-Efficient Economy. (2019). Energy burdens in Minneapolis. https://www.aceee.org/sites/default/files/pdfs/aceee-01_energy_burden_-_minneapolis.pdf
- Metropolitan Council. (2024, March). Climate tools - Greenhouse gas emissions inventory. https://metrocouncil.org/Data-and-Maps/Research-and-Data/Climate-tools.aspx
- Minnesota Department of Commerce & Minnesota Pollution Control Agency. (2023). Greenhouse gas emissions in Minnesota 2005-2020. https://www.pca.state.mn.us/sites/default/files/lraq-2sy23.pdf
- Minnesota Pollution Control Agency. (2024). Metropolitan solid waste management policy plan 2022-2042. https://www.pca.state.mn.us/sites/default/files/w-sw7-22.pdf
- Minnesota Department of Natural Resources. (n.d.) Minnesota keeps getting warmer and wetter. https://www.dnr.state.mn.us/climate/climate_change_info/climate-trends.html
- Fitzpatrick, M.C., Dunn, R.R. Contemporary climatic analogs for 540 North American urban areas in the late 21st century. Nature Communications 10, 614 (2019). https://doi.org/10.1038/s41467-019-08540-3
- Minnesota Department of Natural Resources. (2024b). Minneapolis/St. Paul climate data: Historical climate data listings. https://www.dnr.state.mn.us/climate/twin_cities/listings.html
- Liess, S. Roop, H.A., Twine, T.E., Noe, R., Meyer, N., Fernandez, A., Dolma, D., Gorman, J., Clark, S., Mosel, J., Farris, A., Hoppe, B., Neff, P. 2023. Fine-scale climate projections over Minnesota for the 21st century. Prepared for the University of Minnesota Climate Adaptation Partnership. October 2023.
- Borunda, A. (2020). Racist housing policies have created some oppressively hot neighborhoods. National Geographic, 9(2).
- Mackey, E. & Earth Economics. (2023). The economic benefits of natural climate solutions in Minnesota. The Nature Conservancy. https://www.nature.org/content/dam/tnc/nature/en/documents/EarthEconomics_2023EconomicBenefitsofNaturalClimateSolutions.pdf
- The Mississippi River National River and Recreational Area (MNRRA) was established by Congress as a unit of the National Park Service in 1988
- City of Woodbury, Minnesota. (2022). Woodbury urban forest management plan 2022. https://www.woodburymn.gov/DocumentCenter/View/1845/Woodbury-Urban-Forest-Management-Plan-Executive-Summary-PDF?bidId=
- Minnesota Pollution Control Agency. (2024, February 22). Minnesota air quality index. Retrieved May 8, 2024, from https://public.tableau.com/app/profile/mpca.data.services/viz/MinnesotaAirQualityIndex_0/AQIExternal
- Analysis of Council on Environmental Quality Climate and Economic Justice Screen Tool and Environmental Protection Agency EJScreen data: Metropolitan Council. (2024). Priority climate action plan: Twin Cities metropolitan statistical raea. https://metrocouncil.org/Planning/Climate/Climate-Pollution-Reduction-Grant/Twin-Cities-Priority-Climate-Action-Plan.aspx
- Graphic courtesy of Minnesota Pollution Control Agency. (2021). The air we breathe: The state of Minnesota’s air quality in 2021. https://www.pca.state.mn.us/sites/default/files/lraq-2sy21.pdf
- Niall McCarthy. (2020, February 18). This is the global economic cost of air pollution. World Economic Forum. https://www.weforum.org/agenda/2020/02/the-economic-burden-of-air-pollution/
- J. Nowak, D., Hirabayashi, S., Bodine, A., & Greenfield, E. (2014). Tree and forest effects on air quality and human health in the United States. Environmental Pollution, 193, 119–129. https://doi.org/10.1016/j.envpol.2014.05.028
- Metropolitan Council. (2007). 100+ years of water quality improvements in the Twin Cities.
- Metropolitan Council. (2020). Lake water quality summary. https://metrocouncil.org/Wastewater-Water/Services/Water-Quality-Management/Water-Monitoring-Pubs/Lake-Water-Quality-Summary-Report-with-Grade-Map.aspx
- Metropolitan Council. (2018). Regional assessment of river water quality in the Twin Cities Metropolitan Area: Minnesota, Mississippi, St. Croix Rivers, 1976-2015. https://metrocouncil.org/Wastewater-Water/Publications-And-Resources/WATER-QUALITY-MONITOR-ASSESS/Technical-Summary-of-Regional-Assessment.aspx
- U.S. EPA. (2024, January 31). Climate adaptation and sstormwater runoff. https://www.epa.gov/arc-x/climate-adaptation-and-stormwater-runoff
- National Oceanic and Atmospheric Administration. (n.d.). Minnesota historical conditions. National Integrated Drought Information System. Retrieved May 6, 2024, from https://www.drought.gov/states/minnesota#historical-conditions
- Charles, D. (2021, February 24). New evidence shows fertile soil gone from midwestern farms. National Public Radio. https://www.npr.org/2021/02/24/967376880/new-evidence-shows-fertile-soil-gone-from-midwestern-farms
- Metropolitan Council analysis of Minnesota DNR's Regionally Significant Ecological Area loss based on observed land development from the Metropolitan Council's Generalized Land Use Inventories, 2005-2020
- Weir, K. (2020). Nurtured by nature: Psychological research is advancing our understanding of how time in nature can improve our mental health and sharpen our cognition. Monitor on Psychology, 51(4), 50. https://www.apa.org/monitor/2020/04/nurtured-nature
- Metropolitan Council. (2021) Parks & trails visitor study. https://metrocouncil.org/Parks/Research/Visitor-Study.aspx#Report
