Highway Investment Plan
Table of Contents
Introduction
Residents and businesses depend on safe and efficient roads, including a well-functioning highway system, as part of our region’s transportation system. Each day, 86% of all trips in our region are taken in an automobile.72 Transit, walking, biking, and rolling trips depend on roads. 75% of freight, weighted by value, beginning or ending in MnDOT’s metro district is carried on trucks and 18% use multiple modes, which often includes trucks.73
The term roads is used here to refer all public roads, and the term highways is used to refer to those roads that carry the greatest number of people and goods the greatest distances.
Although trips by personal vehicle may be faster and more convenient for most people, trips taken by transit, walking, biking, and rolling are more affordable for many trips, and better for the climate and public health. With about 660,000 more people expected in the region by 2050, this plan further develops a flexible transportation system to give travelers more viable choices for how they travel. Even with substantial investment in other modes, including transitways, and regional work to reduce vehicle miles traveled and shift people away from driving alone, trends indicate and this plan forecasts that automobiles will remain the primary way people will travel in the region in 2050.
Furthermore, more rural parts of our region are only well served by personal vehicle travel and many residents rely on roadways to meet their travel needs. Rural areas are especially difficult to serve with modes such as transit, biking, walking, and rolling. As such, our roadways must be maintained, modernized, and improved to support all modes of travel, including walking, biking, rolling, transit, personal vehicle, and freight.
Roadways play a vital current and future role in providing residents and businesses with flexible and efficient access to opportunities that can improve economic and social well-being, and overall quality of life. Improved roads that serve all modes of travel will increase the number of people moving per vehicle and without vehicles. This will lead to increased mobility beyond the direct investments in highway capacity presented here.
This section presents our region’s approach to maintaining and improving highways, primarily the principal and minor arterial highways that make up the regional highway system. The introductory section of this chapter describes the regional highway system, presents how this chapter relates to plan goals, and introduces various processes and approaches to highway planning. In the existing highway system section, we present the most important needs and funding categories. In the highway investment plan, we present investment principles, specific investments within categories, and direction for funding that has not yet been allocated.
This section highlights infrastructure investment in the highway system. Additional context identifying the importance of highway infrastructure for other modes is included in the pedestrian, bicycle, transit, and freight sections.
The regional highway system
The functional classification system identifies the role a roadway plays in the transportation system and includes principal arterials, minor arterials, collectors, and local streets. The functional classification system is applied nationwide and guided by the Federal Highway Administration. For the purposes of regional transportation planning, this section focuses on the two highest-level roadways – principal and minor arterial highways – that form the regional highway system (Figure 4.1). Together the principal and minor arterials, comprise only 3,000 of the region’s 18,300 roadway centerline miles (16%), but carry 80% of the region’s motor vehicle traffic. Principal arterials like I-94 carry about 8% of bus service and minor arterials such as University Avenue carry about 51% of bus service.
Figure 4.1: Bus service by road functional classification

Table 4.1: Regional highway system mileage and usage74
| Measure | Center line miles | % of center line miles | Vehicle miles traveled (VMT) (in billions) | % of VMT | VMT per center line mile (in millions) |
|---|---|---|---|---|---|
| Regional highway system | 3,000 | 16% | 22 | 80% | 7.3 |
| Principal arterials | 700 | 4% | 14.7 | 54% | 21.1 |
| Minor arterials | 2,300 | 13% | 7.3 | 26% | 3.2 |
| Collector roads and local streets | 15,300 | 84% | 5.4 | 20% | 0.36 |
| Total | 18,300 | 100% | 27.4 | 100% | 1.5 |
Figure 4.2: Principal and minor arterial highways

Principal arterial highways
The federally designated National Highway System forms the highest-level functional classification within the regional highway system, called principal arterial highways. Collectively, the system is also known in Minnesota statute as the Metropolitan Highway System. This roadway classification includes interstates (for example, Interstate 94), other freeways and expressways (for example, Minnesota State Highway 62), and other principal arterials (for example, Cedar Avenue in Lakeville). The principal arterial classification represents roadways that prioritize mobility, serving the longest trips at the fastest travel times while providing the least direct access to specific locations. This mobility-access tradeoff is presented in Figure 4.2. MnDOT owns and operates 92% of the principal arterials, while various counties and the City of Saint Paul own the remaining seven roadways with this classification (Table 4.2).
Figure 4.3: Roadway access and mobility

Table 4.2: Regional highway system and ownership mileage73
| - | Principal arterials miles | Principal arterials % | Minor arterial miles | Minor arterials % | Regional highway system miles total | Regional highway system % |
|---|---|---|---|---|---|---|
| State | 658 | 92% | 365 | 16% | 1,023 | 33% |
| County | 58 | 8% | 1,692 | 72% | 1,749 | 57% |
| Municipal | 2 | < 1% | 284 | 12% | 286 | 9% |
| Total | 718 | 100% | 2,341 | 100% | 3,058 | 100% |
Minor arterials
Designed to support and supplement principal arterials, minor arterials provide a high degree of mobility, but balance that mobility against needs for direct access to other roads and destinations (for example, employers, shopping, and schools). Minor arterials generally begin to balance needs of nonmotorized users as well. Due to their direct connections to major destinations, minor arterials often act as key transit routes and serve bicycling and walking trips with sidewalks and pedestrian crossings, multi-use trails, or on-street bicycle facilities in the roadway right-of-way.
Minor arterials also form the first-last mile freight connections between freight-generating businesses and the principal arterial system, and minor arterials provide network redundancy to the principal arterials when an incident or construction closes a highway or bridge. Examples of minor arterials include Minnesota Highway 51/Snelling Avenue in Ramsey County and Minnesota Highway 95 in Washington County.
This region has established four sub-types of minor arterials (augmentors, connectors, expanders, and relievers) that are based largely on the land use context of the roadway and its location within the metro area. These sub-types are used for allocating funding through the Regional Solicitation.
Other roads in our region are classified as major collectors, minor collectors, and local streets. These provide for shorter trips but connect people from the higher classified roads that make up the regional highway system to the places people and businesses need and want to go. Collector and local streets total approximately 15,300 centerline miles. They make up 84% of road mileage in the region and are the responsibility of local governments.
The Functional Classification section of the Imagine 2050 Transportation Policy Plan includes definitions and a further discussion of roadway functional classification and the process to request a change to this designation.
Relationship to transportation plan goals
Planning for the regional highway system supports each of the five goals in this plan and their related objectives. Each goal’s relationship to transportation is covered in more detail in the Imagine 2050 Transportation Overview chapter; however, a summary of how highways relate to each goal is presented here.
At times, highway construction has harmed the people and communities whether through disconnection, displacement, excessive noise, poor air quality, or visual impacts. Members of underserved communities – including people who identify as Black, Indigenous, and people of color; people experiencing low incomes and low wealth; and people otherwise impacted by persistent poverty and inequity – are disproportionately affected. Construction of I-94 between 1956 and 1968 in Saint Paul disproportionately affected the city’s African American community in the Rondo neighborhood. According to the Minnesota Historical Society, “One in every eight African Americans in Saint Paul lost a home to I-94.”76 In Minneapolis in 1960, more than 80% of the city’s African American residents lived where highways were planned to be built, including I-35W.77 The city’s comprehensive plan notes that in 1960, the locations where I-35W, I-94, and State Highway 55 “were built were home to approximately 27% of the city’s white population, but 82% of its Black population.”78 The city’s plan also provides the context that beginning in 1910, African Americans were restricted to portions of the city by racial covenants on property, and these areas were later subject to disinvestment by discrimination in lending.
Communities near highways bear the impacts and consequences from both the original construction and the continued operation and presence of these facilities. As a result, the Met Council will conduct a study to identify the long-term and continuing harms and impacts of the regional highway system on adjacent communities and populations and propose mitigation investments to help resolve them.
Black, American Indian, and Alaskan Native people are at least 50% more likely to live near principal arterial highways than their overall proportion in the Twin Cities region would indicate. Income is a less determinant factor, but any relationship may be hidden in the analysis done here due to large census block groups in more rural parts of the region.
This plan includes objectives to promote equity and inclusivity related to highways and to minimize negative impacts. It includes policies, programs, and plans to ensure community impacts and benefits are distributed equitably, better connecting historically underserved and under-resourced communities to jobs, education, and other opportunities. The plan also includes policies and programs to repair and eliminate disparate and unjust impacts and harms to Black people, Indigenous people, and people of color, and mitigate and minimize impacts and displacement of long-term residents and communities caused by transportation infrastructure and use.
This plan also elevates investments that support investments in transportation choices as part of highway projects that improve safety, access, and mobility for people using all modes.
This plan works to minimize the negative impacts of highways to health and safety while encouraging their potential for benefits.
Crashes on highways can cause death and life-altering injuries for those within and outside of motor vehicles. Highways can also act as barriers for people who are walking, rolling, and biking, which also impacts health. Air and noise pollution caused by highway use also impact public health, especially for burdened communities who live near highways.
This plan includes policies and programs to minimize these impacts through more targeted investments and planning. These policies and programs also support highway investments that improve safety for all users, with an emphasis on reducing crashes that result in deaths or serious injuries using a Safe System Approach. More information about this approach is included in the Imagine 2050 Transportation Overview chapter. Highways provide foundational access to destinations including places of employment, health care, education, recreation, and opportunities for active travel.
The regional highway system supports this goal by supporting transportation options, addressing excessive highway delay, improving travel time reliability, and building resilience into the transportation system.
Highway projects should include safe and comfortable facilities for walking, biking, rolling, and for transit vehicles, and efficient connections between modes. Highway improvements address excessive delay and improve travel-time reliability (especially important for freight), and safe crossings for all modes. Highways serve a flexible and fundamental role in moving freight into and out of the region to support our businesses and jobs. Highway improvements include managed lanes that provide efficient and reliable travel for transit, high-occupancy vehicles, and for those willing to pay.
People and businesses need to trust that transportation infrastructure and services will withstand and recover quickly from natural- and human-caused disruptions. This plan invests to mitigate the most significant current and anticipated climate- and weather-related impacts (for example, roadway flooding), and to minimize the impacts of nonrecurring delay and disruption (for example, special events and traffic incidents).
Highway travel, especially using a vehicle with an internal combustion engine, contributes to global climate change. This plan works to ensure the availability, visibility, and accessibility of electric vehicle charging infrastructure; to enhance transportation options (walking, biking, rolling, transit, travel demand management strategies) that reduce climate impacts compared to those of driving alone using an internal combustion engine; and evaluates and mitigates climate impacts of transportation plans and projects. This plan recognizes that not all congestion can be addressed and that larger-scale highway mobility investments should focus on corridors with excessive delay or that are high regional priorities in the Intersection Mobility and Safety Study (2024). The region’s highway mobility improvement hierarchy begins with consideration of the least costly but most impactful investments before considering more expensive investments. In addition, this plan prioritizes managed lanes over general purpose lanes for the advantages they provide to transit and high-occupancy vehicles.
MnDOT, Met Council, and local partners are working to implement state legislation to evaluate the impacts larger projects and portfolios of projects have on greenhouse gases and vehicle miles traveled. The specific processes for assessment and mitigation of greenhouse gas emissions and VMT are being developed by MnDOT with advice from the State Transportation Impact Assessment Technical Committee. When those methods and processes are complete, the plan may need to be amended to incorporate them (Transportation Greenhouse Gas Emissions Impact Assessment).
The Met Council will assess major projects for greenhouse gas and vehicle-miles-traveled impacts before adding them to the Transportation Improvement Program consistent with state law beginning on February 1, 2025. The impact to highway projects and the amount of mitigation that may be required is unclear.
Electric vehicles and their role in decarbonizing auto travel is discussed in the Imagine 2050 Transportation Overview.
Changes to highway planning due to the region’s new climate goal
To recognize the induced-demand effects of highway mobility investments (in other words, as improvements make travel easier, people do more of it) and potential increases in greenhouse gases, this plan makes only limited investments in highway mobility. This limited amount of investment does not keep pace with population and employment growth and focuses on targeted needs (in other words, where current congestion exists for at least two hours per day instead of one hour per day as shown in the 2040 Transportation Policy Plan).
Highway mobility investments, in addition to past investments in transit travel time advantages, now also emphasize transit supportive investments such as roadway reconstruction that will support improvements for multiple modes, including the METRO F Line arterial bus rapid transit route planned Minnesota Highways 65 and 47 in 2028. Other climate mitigation activities of this plan are described in the climate, transit, bike, pedestrian, and travel demand management investment plans, which have all received substantial increases in funding.
The regional highway system fragments natural habitats, which can increase vehicle-animal conflicts. Transportation pollution — including oil, debris, and other pollutants in stormwater — reduces air and water quality. In addition, falling leaves that collect on impervious surfaces can concentrate phosphorus in stormwater discharge if not swept, and salt and de-icing solutions raise chloride levels in natural systems. This plan uses existing rights-of-way to protect and restore natural systems and reduces total impervious surface coverage where practical.
Highway planning
This plan sets transportation policy in the Twin Cities metro area and identifies regionally significant projects (described below). This plan establishes the review and approval process for regionally significant highway projects by the metropolitan planning organization and provides guidance to MnDOT and other agencies on how to invest in highways across the region. This plan addresses highways, their multimodal users, and each of the goals described above. Transit, bicyclists, pedestrians, travel demand management, and freight are important aspects of highways but are more thoroughly addressed in those specific plans.
The Transportation Policy Plan is influenced by a series of other highway planning efforts such as MnDOT’s Statewide Multimodal Transportation Plan and State Highway Investment Plan (MnSHIP). The Statewide Multimodal Transportation Plan is the state’s policy plan for transportation, while MnSHIP directs MnDOT capital resources into general investment areas. This plan builds on the state’s work, tailors it to serve the Twin Cities metro area, and identifies specific investments that the region can expect and plan for by 2050. Upon completion of the Imagine 2050 Transportation Policy Plan, local agencies in the seven-county metro area will be asked to update their own transportation plans to reflect changes in this plan that will impact their communities. Local transportation planning will then generate additional data, needs, and potential project lists for consideration in future updates of this plan and potentially pursue funding in the Regional Solicitation.
Highway system studies and project prioritization
Met Council staff regularly undertake studies to inform difficult issues the region faces and to aid in the prioritization of investments within a project type. These studies inform this plan. Past results and active work are described here and throughout this plan within the relevant sections. Planned future studies are included in the Imagine 2050 Transportation Policy Plan Work Program.
Regionally significant highway projects
The Federal Highway Administration requires that prior to construction, regionally significant projects must be approved in the Imagine 2050 Transportation Policy Plan and then subsequently approved for inclusion in the Transportation Improvement Program. The type of funding (for example, local, regional, state, or federal) being used on the project does not impact whether a project is regionally significant (in other words, locally funded projects may still be determined to be regionally significant). The Federal Highway Administration defines regionally significant projects as those that serve regional transportation needs that would normally be included in the modeling of a metropolitan area’s transportation network, including at a minimum all principal arterial highways and all fixed guideway transit facilities that offer an alternative to regional highway travel. This region has added further specificity to this definition by focusing on the following project types on principal arterials:
- Adding and removing a lane (for example, general-purpose lane, managed lane, an entirely new roadway, or continuous auxiliary lane that extends more than one interchange/intersection).
- Constructing a new interchange on an existing or developing freeway, adding or removing a new ramp movement at an existing interchange.
The Met Council is also responsible for approving major projects on freeways within the seven-county Twin Cities metro area. The Metro Freeway Approvals study implements Minnesota Statute 473.166 so that freeways in the metro area are developed consistently with this plan. The formal approval process occurs toward the end of the project development process when a final environmental document is available.
Congestion management process
The Congestion Management Process is a federally required process developed by the Met Council, MnDOT, counties, and cities within the metro area. It is an integral part of the highway planning process. The Congestion Management Process outlines the regional objectives, network, and key performance metrics to identify and implement strategies that assist in mitigating congestion. Congestion management strategies consider travel demand management, lower cost and spot mobility investments, and operational improvements before larger-scale investment.
The Congestion Management Process is an ongoing process that is regularly updated to reflect the goals and needs of the region. It serves as a guide to transportation investments and strategies for the Met Council and its partners. The Congestion Management Process Policy and Procedures Handbook, initially developed in 2020, is available here. The Congestion Management Process section of the Imagine 2050 Transportation Policy Plan of this plan includes an overview of the process and its role in regional transportation planning and programming processes.
Highway interchange approval process
This process is defined in the Imagine 2050 Transportation Policy Plan’s Preliminary Interchange Approval Process section. This process describes interchange project types that must be approved and evaluation standards that must be met before a project sponsor applies for Regional Solicitation funds and several other competitive MnDOT funding programs. This is an initial planning-level review by MnDOT and Met Council staff of a proposal’s consistency with local and regional plans, the transportation need being addressed, functional class of connecting roads, supporting local roadway network and access management, and interchange spacing along a freeway.
This process does not evaluate if an interchange is the best solution at a location; only that an interchange is suitable, based on the evaluation criteria above, to be considered further. This approval does not promise other future approvals, funding, or inclusion in this plan or the list of Metro Freeway Approvals (described above). This initial, high-level approval is the first of many that are needed in the project development process.
Highway planning coordination
Staff from the Met Council regularly serve on corridor study advisory committees. Their role is to bring the regional perspective to these projects and work toward implementation of the goals, objectives, policies, and actions of this plan on each corridor and each project. Through this role, they also bring back the local perspective and issues to be considered in regional transportation planning. Another goal is to ensure that regional prioritization study results are incorporated into the study documentation.
This plan also helps inform local comprehensive planning efforts in the seven-county metro area. With an update or amendment to this plan, system statements are sent to impacted communities and they are required to include major projects in their local plans along with other required elements.
Right of Way Acquisition Loan Fund
The Met Council is responsible for implementing the Right of Way Acquisition Loan Fund. This program is described in Minnesota Statute 473.167, subd. 2 and generally provides local agencies with loaned funds to purchase property that is needed for future highway improvements and may otherwise be improved or appreciate over time.
Existing Highway System
Highways provide important travel options for the residents and businesses of our region. Maintaining and modernizing the regional highway system is important for the safety of people and goods in reliably meeting daily needs. Given the size and age of our highways, it is important to pair preservation investments with improvements that address all the goals of this plan and serve all modes of travel. It is also important to consider tradeoffs across travel modes, advantaged and negatively impacted populations, and even a balancing of goals (for example, a highway mobility project can enhance safety and create a more dynamic and resilient region, but may induce more vehicle travel leading to added climate and public health impacts).
Preservation of a large and aging system
The regional highway system covers 3,000 centerline miles of roadways and has developed significantly since the 1950s. Many of these highways are between 50 and 70 years old and are well beyond their functional life. Our highways require significant ongoing maintenance and reconstruction. However, the region maintains and replaces aging infrastructure to not only preserve what is there, but to modernize the system for current needs, achieve regional goals, and improve the user experience. A well maintained, high-quality system offers many benefits to people in the region, including:
- Smooth pavement on high- and medium-speed highways protects people, goods, and vehicles.
- Smooth pavement on low-speed highways provides a more comfortable ride and improves safety for drivers, passengers, and bicyclists.
- Well-maintained roads and bridges can minimize lifecycle costs and provide reliable infrastructure that people and businesses all depend on throughout the year.
- Updated and upgraded transportation assets are more aesthetically pleasing for residents and visitors.
- Preservation work enables the adoption of modern design treatments to improve traveler safety, mobility, ADA accessibility, bicycle and pedestrian facilities, stormwater management, and comfort of all travelers.
- Well-maintained water treatment and drainage infrastructure protects our natural systems.
- Mobility improvements paired with preservation work can be accomplished with less cost and fewer construction impacts to travelers.
In 2015, pavement and bridge replacement work was coordinated with the addition of managed lanes to address multiple goals in Saint Paul, Maplewood, and Little Canada with less overall cost and impacts than would have occurred had these needs been addressed separately.
New techniques and technologies are key to extending the life of highways and decreasing both costs and environmental impacts. For example, MnDOT often places a new concrete road on top of the old road using it as a new base (unbonded concrete overlays) with similar or better results than reconstruction at a fraction of its cost. In addition, local agencies often recycle old road materials onsite, using techniques such as cold in-place recycling, to reduce costs and impacts.
Preservation work is an opportunity to achieve regional goals, but it comes with substantial financial costs. Given the general age and size of the system, the region has entered a phase of highway development where more highways will require significant investments to preserve assets while improving functionality and comfort for all users. The 20-year Minnesota State Highway Investment Plan (2023-2042) anticipates that pavement condition, bridge condition, roadside infrastructure, and rest areas will continue to degrade in the metro area and statewide compared to current conditions as construction costs grow faster than available revenue. While new state revenue will improve the anticipated preservation condition outcomes, even more revenue is still needed to maintain current conditions.
Safety
The region and the state share goals of eliminating deaths and serious injuries on the transportation system. However, deaths and serious injuries from traffic crashes have increased in the region since 2020. Highway investment, planning, and design are instrumental in reducing deaths and serious injuries from crashes on the system. Highway planning must include design for many modes and choices to protect people walking, biking, and rolling. The Imagine 2050 Transportation Chapter discusses the Safe System Approach, crash data, and other safety developments. Crash risks are addressed through the five elements of the Safe System Approach. This approach, promoted by the U.S. Department of Transportation, is an important shift in safety planning and implementation. It provides a more holistic approach to addressing safety in systems rather than as individual problems or solutions.
The U.S. Department of Transportation describes the Safe System Approach as “building and reinforcing multiple layers of protection to both prevent crashes from happening in the first place and minimize the harm caused to those involved when crashes do occur.” Roadway design and operations help reduce potential consequences of human mistakes to eliminate fatalities and serious injuries.
Figure 4.4: Safe System Approach principles and elements

The Met Council is working on a Regional Safety Action Plan focused on vehicle crashes and bicycle-vehicle crashes that will be released in 2024. It includes crash data trend analysis, identifies high-injury streets in the region, and offers systemic analysis. The high-injury streets identification includes pedestrian crashes and builds on work done in the Regional Pedestrian Safety Action Plan that was completed in 2022.
The potential for connected and autonomous vehicles to impact safety is discussed in the Imagine 2050 Transportation Overview chapter and a discussion of the uncertainty with respect to congestion is included below.
Supporting transportation mode choices along and across highways
The regional highway system must serve people walking, biking, rolling, and using transit in addition to those driving or carrying freight. The most vulnerable road users — those walking, biking, and rolling — often face the most dangers from drivers of vehicles. An efficient transportation system that serves people and provides more sustainable options must prioritize the mode choice needs that exist along and across highways to sufficiently serve people and deliver more sustainable travel options.
Through its scoring process, the Regional Solicitation prioritizes safety and elements for multiple modes within roadway projects (points are awarded for pedestrian safety, as well as included mode-choice elements). As such, nearly all strategic capacity, spot mobility and safety, and roadway reconstruction projects include a trail, sidewalk, or a pedestrian underpass or overpass as part of the design. These Regional Solicitation roadway projects have also been instrumental in building out missing sections of the Regional Bicycle Transportation Network.
Modern design treatments also must improve intersections for people outside of vehicles to cross roads safely. Because most pedestrian fatalities and serious injuries in the region happen when a person is trying to cross a street, rather than walking along a street, roadway designs need to prioritize safety for people outside of vehicles to help the region reduce the numbers of people who are seriously injured or killed while walking or rolling. Roadway projects must also meet Americans with Disabilities Act (ADA) requirements removing barriers for people with disabilities.
Applicants must have ADA self-evaluations and, if applicable, transition plans to be eligible to apply for the Regional Solicitation. This requirement applies to all sponsoring agencies for projects entering the Transportation Improvement Program. Projects selected through the Regional Solicitation are required to construct their project to be ADA compliant. Agencies are encouraged to address the full needs of people with disabilities in their projects rather than just meeting the minimum of ADA requirements. More information about the needs of people with disabilities is included in the Pedestrian Investment Plan.
Recurring congestion and reliability
Compared to other modes of travel, highways provide the largest range of access to destinations such as jobs and medical facilities within 30 minutes. Eighty-five percent of trips within the region use automobiles daily. The Imagine 2050 Transportation Policy Plan Evaluation Performance Measures section tracks job accessibility both by automobile and other modes. Highways also serve freight and people on transit. Congestion causes delays and difficulty for users planning trips on the regional highway system. Excessive delays caused by recurring congestion and unpredictable travel times compromise people’s ability to access important destinations and reduce quality of life, negatively affect business costs, and hamper competitiveness in regional and global markets.
Another of the established performance measures in the Imagine 2050 Transportation Policy Plan and MnDOT’s Statewide Multimodal Transportation Plan (2022) is annual hours of delay per person. The purpose of this target is not to try to eliminate congestion, but to limit the amount of delay people experience to a reasonable level.
During the height of the COVID-19 pandemic, our region saw a precipitous fall in all travel including highway travel. In 2020, the region experienced an 18% drop in total vehicle miles as compared to 2019, and congestion did not regularly occur, except on a few corridors such as I-494 in Bloomington and I-35W in New Brighton. Since then, vehicle miles traveled have returned to pre-pandemic levels; 2022 total vehicle miles traveled in our region were only 7% below 2019 levels. Data collected in October 2023 shows congestion levels very nearly those in 2019 before the COVID-19 pandemic.79
This plan estimates that the region’s population will grow by 20% from 2025 to 2050, which represents approximately 660,000 new people using the transportation system, as shown in Table 4.3. This population growth is an input to the transportation model that then estimates future results absent changes in the transportation system (2050 No Build Scenario) and another scenario that additionally reflects the investments in this plan (2050 Build Scenario). The increase in regional population is estimated to result in a 16% increase in trips and 15% increase in total vehicle miles traveled.
This plan invests in numerous strategies to shift trips away from driving alone highlighted in the travel demand management, pedestrian, bicycle, and transit investment plans. Highways support this mode shift by creating safe and efficient space for all modes, and through transit advantages and managed lanes described below in the highway investment plan. Land use is also an important driver of vehicle miles traveled per capita and is addressed elsewhere in Imagine 2050. However, vehicle miles traveled per capita is anticipated to decrease 5% in the No Build Scenario and increase from that in the Build Scenario by 0.3%.
Table 4.3: Population, daily vehicle trips, miles traveled, and delay in 2025 and 2050 scenarios80
| - | 2025 existing conditions | 2050 No Build Scenario | 2050 Build Scenario | Percent change 2025 to No Build | Percent change No Build to Build |
|---|---|---|---|---|---|
| Population | 3,280,000 | 3,940,000 | 3,940,000 | 20% | NA |
| Daily vehicle trips | 10,690,000 | 12,360,000 | 12,380,000 | 16% | 0.2% |
| Daily vehicle trips per capita | 3.3 | 3.1 | 3.1 | -4% | 0.2% |
| Daily vehicle miles traveled | 72,670,000 | 84,590,000 | 84,900,000 | 14% | 0.4% |
| Daily vehicle miles traveled per capita81 | 22.6 | 21.9 | 22.0 | -3% | 0.4% |
| Modeled lane miles | 28,127 | 28,127 | 28,241 | 0% | 0.4% |
| Total delay (in hours) | 452,000 | 600,000 | 580,000 | 33% | -3% |
| Daily delay per traveler (in minutes) | 9:43 | 10:51 | 10:34 | 6% | -1% |
Excessive delay
Recurring congestion (in other words, regularly occurring congestion) can be impactful on travelers. Not all congestion can or should be addressed due to capital costs, ongoing maintenance costs, and negative environmental, social, and economic impacts. This plan uses a two-hour threshold of recurring congestion to show excessive delay. Figure 4.5 shows principal and minor arterials where excessive delay is estimated to have occurred from June 2022 to May 2023 using StreetLight data. The measurement of congestion uses the travel time index, a ratio of the 50th percentile travel times during daytime hours, to an estimate of travel time during overnights (average from midnight to 6:00 a.m.), representing a time with no congestion. Excessive delay is shown where the travel time index exceeds 1.25 over at least two total hours in sum during the morning (6:00 a.m. to 10:00 a.m.) and evening peak periods (3:00 p.m. to 7:00 p.m.). A travel time index of 1.25 are conditions where you can expect your typical travel time to be 125% of what it would be overnight.
Figure 4.5: Excessive highway delay

Figure 4.6: Examples of excessive delay

StreetLight data is a sample of trips with known bias including that the data primarily come from new vehicles. Segments and times with lower traffic volumes have a greater margin of error and the data processing may product incorrect trips.
Nonrecurring congestion
Nonrecurring (unanticipated) delays cause great uncertainty for individuals and those moving freight. Due to its variability, this congestion cannot be fully planned for in decision making. Even with some degree of accounting for extra travel time due to uncertainty, disruptions to planned personal and business activities do occur. The buffer time index is a measure of the 95th percentile travel time minus the median travel time, all divided by the median travel time. This results in the ratio of the additional travel time you need to plan for to be on time 19 of 20 weekdays in a month to the typical travel times. A value of zero represents conditions that may be congested, but if so, they are consistently congested. A value of one says that to be on time 19 of 20 days, a driver must plan for double the time of their normal trip. Figure 4.7 is a map of principal and minor arterials where the buffer time index exceeds 0.5 and 1. This map also utilizes StreetLight data.
Figure 4.7: Highway reliability

Figure 4.8: Nonrecurring congestion

Funding
Highway funding is a complex topic and is detailed in the Imagine 2050 Transportation Policy Plan Regional Transportation Finance section. Revenue generally includes the gas tax (state and federal), motor vehicles sales tax, vehicle registration fees, and local taxes and fees. Inflation in construction costs have long outstripped increases in funding; however, recent federal legislation and Minnesota’s 2023 legislative session did provide significant additional funding for transportation, including highways.
MnDOT receives substantial federal funds to support highways. The 2021 Infrastructure Investment and Jobs Act (IIJA), also known as the Bipartisan Infrastructure Law (BIL), increased these investments. Although the bill ends in 2026, MnDOT anticipates most federal formula program funding for highways will continue and makes this assumption in MnSHIP.
In both near-term and long-term contexts, electric vehicles will reduce state and federal revenue generated by the gas tax, an important source of highway funding. This is a result of less gasoline and diesel being purchased and more energy for vehicles coming from the electric grid. This must be planned for, but it is not a near-term concern while the total number of electric vehicles is limited. The combination of the annual fee electric vehicle owners pay, along with the purchase cost premium leading to additional motor vehicle sales taxes, currently offsets reductions in fuel tax revenue generally.82
State highways
The Statewide Multimodal Transportation Plan sets the overall vision and objectives for our state’s transportation system. Last updated in 2022, the state transportation plan establishes six transportation system objectives including transportation system stewardship, safety, healthy equitable communities, critical connections, climate action, and open decision-making. The Minnesota State Highway Investment Plan (MnSHIP) then sets and communicates the capital investment priorities for the state highway system aligned with the state transportation plan objectives and within expected funding over the 20-year period of the plan 2023-2043.
The 20-year investment direction in MnSHIP focuses the expected highway capital investments as follows:
- System stewardship strategically builds, maintains, operates, and adapts the transportation system based on data, performance, and community needs. MnSHIP’s primary investment emphasis is on maintaining the existing system, and this is where 61% of the state’s highway funding will be spent. The largest investments in this category are in pavement and bridge condition. It also includes smaller investments in roadside infrastructure and rest areas. MnDOT strives to achieve multiple objectives through coordinating its stewardship investments with the other investment categories.
- Transportation safety will allow MnDOT to continue its comprehensive approach to improving safety on state highways for all users. Because traffic fatalities and serious injuries have spiked in recent years, investment in traffic safety improvements have increased substantially.
- Healthy and equitable communities identifies two categories for collaboration with local agencies to help meet local needs: local partnerships and main streets/urban pavements. These categories aim to reduce disparities, enhance livability, and emphasize partnership with local communities. The local partnerships investments support local priorities on the state highway system. Investment in main streets/urban pavements provides a new funding category for projects in cities and townships to deliver more improvements along state highways. This includes segments of the state highway system that are not freeways and function both as a state highway and as a city street in an urban context. The main streets/urban pavements funding covers additional pavement costs related to adding a project in an urban area or changing the scope of a planned pavement resurfacing project to allow more substantial work in conjunction with the project.
- Critical connections identifies mobility investments for many types of highway users, including those driving motor vehicles, freight carriers, bicyclists, and pedestrians, recognizing the importance of choices and connections. MnDOT’s critical connections investment strategies seek to increase options, improve travel time reliability, and reduce excessive delay, while reducing the average amount of driving Minnesotans need to access the goods, services, and opportunities important to their quality of life. Investment categories in the critical connections objective area received substantial increases in investment from the previous plan to allow MnDOT to improve mobility for state highway users, particularly people walking, biking, and rolling. Funding for bicycling and pedestrian improvements doubled in size compared to the last plan.
- Climate action includes capital investments in climate resilience. These are categorized as flood mitigation projects, proactive resilient infrastructures, snow fence projects, and planting and implementing green assets. Reducing transportation’s contribution to climate change shows up in other MnDOT programs outside of MnSHIP. Climate mitigation and resiliency are described in the Imagine 2050 Transportation Overview chapter.
- Other investment priorities include project delivery and small programs. Project delivery includes components of projects that are critical to ensure the timely and efficient completion of highway projects. These components include right-of-way costs, consultant services, supplemental agreements, and construction incentives. These costs are higher in the Twin Cities metro area. Historically, MnDOT has spent an average of 20% of total capital revenues on project delivery. Small programs projects fund short-term, unforeseen issues and one-time priorities or needs as they arise. Small programs in MnSHIP include funds for historic properties, flood and slope slide repair, and cleaning up contaminated materials.
Over the next 20 years, MnDOT estimates there will be $36.7 billion in available revenues statewide to address $52 billion to $57 billion in identified state highway needs, resulting in an estimated funding gap of between $15 billion and $20 billion. While the recent increases in state revenues were substantial, they only covered about 20% of the unmet highway improvement needs identified in MnSHIP.
Greater Minnesota has most of the state’s highway miles, and preserving pavement condition and bridges throughout the state needs to be a high investment priority. However, the metro area has most of the state’s population, jobs, economic activity, congestion, truck freight movements, mode choice needs, highway technologies (traffic signals, ramp meters, overhead signs), and urban stormwater needs. The metro area is forecasted to receive the vast majority of the state’s population and job growth through 2050.
MnDOT shares its available capital and operating funding with its eight districts through a distribution formula that considers these factors. Over the past decade, due to a shift of funding more heavily towards system preservation, the metro district’s share of statewide capital funding has been decreasing. The metro district share has varied from a high of about 42% of available statewide revenues to more recent lower shares of statewide funding in the 35% range. The metro district typically receives about 26% of the revenues for state highway operations and maintenance purposes.
Each district is somewhat unique in its transportation needs, which do not necessarily consistently align with the average statewide highway investment direction provided by MnSHIP. In particular, the metro district has greater needs related to addressing excessive delay and mobility for multiple modes, noise walls, and stormwater management. The metro district also has the majority of the state’s underserved and overburdened populations and must both engage these populations and include community and livability concerns within project planning and design.
During 2023, MnDOT reviewed its district distribution formula and agreed that the metro district should receive a higher share. The new distribution formula targets no less than 43.5% of the state’s capital transportation investment revenues to the metro district starting in 2028. Table 4 summarizes the expected MnDOT statewide revenue, planned allocations across highway investment categories, and planned spending in the metro district during 2029-2034 in its draft Capital Highway Investment Program. This is a general indication of how needs are different in the metro district but note that highway mobility funding is concentrated in the earlier years of MnSHIP and therefore exaggerated in the capital investment program years presented here. As indicated in the Imagine 2050 Transportation Policy Plan Regional Transportation Finance section, the metro district can expect almost $33 billion over the time period of this plan, about $25 billion of which will be available for construction and project implementation purposes and more than $8 billion for operations and maintenance purposes.
Table 4.4: MnDOT highway investment summary (year of expenditure dollars)83
| MnSHIP objective | MnSHIP investment categories | Statewide allocation (in billions) | % | Metro 2029-2034 draft capital plan (in millions) | % |
|---|---|---|---|---|---|
| System stewardship | Pavement condition | 20.6 | 36.7% | 1,254.6 | 33.3% |
| System stewardship | Bridge condition | 9.2 | 16.3% | 538.0 | 14.3% |
| System stewardship | Roadside infrastructure | 4.4 | 7.9% | 275.0 | 7.3% |
| System stewardship | Program delivery | 11.3 | 20.1% | 800.6 | 21.3% |
| Transportation safety | Advancing technology | 0.2 | 0.3% | 0.0 | 0.0% |
| Transportation safety | Transportation safety | 2.0 | 3.5% | 175.8 | 4.7% |
| Healthy equitable communities | Local partnerships | 1.5 | 2.7% | 37.3 | 1.0% |
| Healthy equitable communities | Main streets/urban pavements | 1.4 | 2.4% | 102.5 | 2.7% |
| Critical connections | Freight | 1.1 | 1.9% | 0.0 | 0.0% |
| Critical connections | Highway mobility | 1.8 | 3.3% | 449.0 | 11.9% |
| Critical connections | Bike and pedestrian | 1.8 | 3.3% | 120.6 | 3.2% |
| Climate action | Climate resilience | 0.9 | 1.6% | 13.8 | 0.4% |
| Total | 56 billion | 100.0% | 3.767 billion | 100.0% |
Regional allocated revenues
Federal transportation funds can be used on a variety of roadway types, which includes the highest functional class of roadways (principal arterials), down to the minor collector functional classification level in urban areas and major collector level in rural areas. The Transportation Advisory Board (TAB) has chosen to focus the federal funds that come to the metropolitan planning organization through the Regional Solicitation on specific roadway types, with only minor arterials and nonfreeway principal arterial classifications being eligible for roadway funding through the Regional Solicitation. These funds are invested in projects that help the region achieve its transportation goals and objectives as identified in this plan.
In the past decade, approximately 56% of the Regional Solicitation funds available to the metropolitan planning organization were awarded to roadway projects. On an annual basis this equates to approximately $70 million and potentially $1.7 billion over the period of this plan. Roadway project applicants are typically counties and cities, with very limited applications from MnDOT metro district. This is partially due to MnDOT’s freeway principal arterials being ineligible for solicitation funds and also to longstanding tradition that because MnDOT has a range of funding sources available, Regional Solicitation funds are dedicated primarily to local government roadway priorities.
In recent years, as MnDOT’s funding has become limited – with fewer funds spent on the nonfreeway principal arterials and MnDOT-owned minor arterials – counties have been increasingly applying for solicitation funds for projects on MnDOT’s state highway system that are priorities for the local entity. The Regional Solicitation funding is often the first funds in on larger, regional projects, so this early, partial funding is critical for local partners to secure other competitive funding sources and deliver larger projects with multiple funding sources. Current Regional Solicitation roadways application categories include traffic management technologies, spot mobility and safety, strategic capacity, roadway reconstruction and/or modernization, and bridge replacement and/or rehabilitation. The locally led trunk highway applications are typically for projects in the strategic capacity and roadway reconstruction and/or modernization categories.
Local investments
This plan acknowledges that a large percentage of MnDOT metro district’s funds go toward preservation and project delivery (76%), and that cities and counties have made, and expect to continue to make, significant mobility investments in the state-owned highways. The region supports local units of government investing in state-owned highways. Furthermore, many of the strategic capacity (primarily new interchanges) and roadway reconstruction and/or modernization projects (either urban reconstruction projects or interchange modernization projects) selected in recent Regional Solicitations were for projects led by counties or cities but located on MnDOT’s system within the local jurisdiction.
A portion of the new Regional Transportation Sales Tax and Transportation Advancement Account revenues allocated to metro region counties (41.5%), along with the existing county transportation sales tax and wheelage tax, are anticipated to be used on county-owned minor arterials. With limited funds and a focus on the National Highway System (in other words, principal arterial highways), MnDOT minor arterials do not receive the necessary investment of such an important part of the regional highway system. MnDOT programs for local partnerships and main streets/urban pavement support cooperation with local agencies where priorities overlap.
It should be noted that cities saw only small increases in the amount of funding available to them, but more of their revenue will be needed to cover cost participation on anticipated county or state highway projects in their cities.
Counties and cities also own and operate a small part of the principal arterial system and most of the minor arterial system. Most of these projects, particularly on the minor arterial system, are identified in city and county comprehensive and transportation plans. These projects are informed by regional goals and regional prioritization studies.
Competitive opportunities
More and more federal and state funds are provided to agencies through various competitive solicitation processes that require applications, scoring, and a commitment of nonfederal matching funds. Each competitive solicitation has a different approach and set of evaluation criteria. The selection of these projects is unknown through the time frame of this plan, but announced awards are reflected in this plan.
The Infrastructure Investment and Jobs Act includes an unprecedented amount of competitive grant funding (more than $100 billion) to states that strive to improve outcomes in areas of safety, asset preservation, carbon reduction, climate resiliency, restorative justice, technology, and more. Minnesota is well positioned to add new programs, plans, and funding for carbon reduction, climate resiliency, restorative justice, broadband, and electric vehicle infrastructure into the transportation system. It is likely that MnDOT and local agencies will receive grants from these federal discretionary programs for state highway and local road projects, as well as funding from community project funding requests.
The Corridors of Commerce program was created in 2013 when the Minnesota Legislature passed Minnesota Statute 161.088. The goal of the Corridors of Commerce program was to focus additional transportation investments in state highway projects that directly and indirectly foster economic growth for the state through construction jobs, efficient goods transport, and additional mobility options to its residents. The program is not part of MnDOT’s regular state road construction program and has specific requirements regarding eligibility, scoring, and prioritization of the projects that are contained within the statute.
Established in 2010, the Transportation Economic Development Program provides competitive grants to construction projects on state highways that provide measurable economic benefits. The Minnesota Department of Transportation, in partnership with the Minnesota Department of Employment and Economic Development, administers the program. The Minnesota Department of Employment and Economic Development administers a parallel Transportation Economic Development Infrastructure program that funds projects on local roads and for other types of transportation. Projects may combine funding from both programs.
The Minnesota Highway Freight Program is responsible for allocating approximately $20 million per year that the State of Minnesota receives from federal funding sources through the National Highway Freight Program, of which approximately 60% or $12 million per year comes to the metro area. Up to $300 million is available to the metro region in competitive freight funding through 2050. The Minnesota Highway Freight Program includes selection criteria such as crash-rate reduction, equity, heavy commercial annual average daily traffic, cost-effectiveness, and truck travel time reliability. Freight projects were selected out of one of three primary application categories: freight safety, freight congestion/freight efficiency improvement, and first-last mile connections. Being located on one of the regionally defined truck highway corridors was a qualifying requirement for projects within the metro area to pursue the funds. More discussion about this Metropolitan Council-led study that produced these truck highway corridors is in the Freight Investment Plan.
Highway Investment Plan
Principles
This highway investment plan works toward the five goals in Imagine 2050 (equitable and inclusive, health and safety, dynamic and resilient, addressing climate change, and protect and restore natural systems), and the objectives, policies, and actions in this plan.
Federal law requires that this long-range transportation plan be fiscally constrained, where estimated revenues and proposed investments are balanced. This plan is fiscally constrained and, while new revenues have recently become available, there are insufficient funds to meet all needs. Prioritizing investments is necessary. The Minnesota Department of Transportation (MnDOT), in cooperation with the Met Council, identified and estimated the revenues and costs for the state highway operations and maintenance and capital investments in this plan.
To be good stewards of public investments, the region must invest in highways strategically, focusing on affordable, effective, multimodal, and flexible solutions. Implementing these solutions requires strong collaboration among the region's transportation partners.
The following highway investment principles address the forecasted increased highway travel demand with past and future population and job growth, reduced transportation purchasing power resulting from inflation, and increased preservation needs. This plan continues its support of highway mobility projects that follow the investment principles laid out below. The investment principles include the following:
- Safety is the first principle and a part of all investment categories with an emphasis on reducing fatal and serious injury crashes rather than all crashes. Highway safety considers all users including drivers and riders in vehicles, freight, and transit, as well as those walking, biking, and rolling.
- Highways serve multiple modes along and across the facilities. Driving, transit, freight, biking, walking, and rolling needs must always be considered, including actions that build out current network gaps.
- Funding should focus on addressing today’s congestion issues, as opposed to forecasted congestion issues, given the limited funding and the backlog of existing, unresolved transportation needs. Future highway demand must be anticipated, but projects should be prioritized to address existing problems before problems that are forecasted to occur.
- The largest percentage of the highway investments in the region are to maintain and preserve the existing system. These preservation projects are used as the catalyst to achieve multiple plan objectives. This minimizes cost and reduces inconvenience to the traveling public by coordinating separate objectives into one construction project.
- Given the projected population and job growth of the region, mobility projects must also be planned and constructed to ensure that people and freight can efficiently move throughout the region without excess delay, and be able to anticipate delay when it does occur (in other words, reliability). This work requires coordination of many agencies including highway authorities, transit operators, and regulators. This work should emphasize the Congestion Management Process and follow the mobility hierarchy:
- Where mobility needs are identified, agencies should first explore lower-cost solutions such as travel demand management and increased transit service in the corridor.
- Traffic management systems (for example, technology that supports coordinated signal timing) should be considered as another low-cost strategy that does not have much potential for negative impacts.
- Next, agencies should explore the lowest-cost roadway improvements even if these projects do not completely resolve the existing problem (for example, spot mobility improvements such as turn lanes, alternative intersection designs, auxiliary lanes, frontage roads, or better managing access).
- If at-grade spot mobility projects are not viable solutions, then grade-separated interchanges should be explored to help deliver the safety and mobility benefits that accompany this project type.
- If none of these options are sufficient for the level of the problem, then managed lanes on the corridor or increasing capacity on the adjacent local system should be evaluated.
- If these cannot sufficiently address the problem, then other types of targeted regional capacity additions should be considered (for example, larger general-purpose capacity projects or larger freeway system-to-system interchange projects). Targeted regional capacity enhancements should not eliminate existing or planned transit advantages or managed lanes.
- The existing infrastructure (for example, pavement surface and bridge clearances) and right-of-way should be used to the maximum extent possible when projects are designed and implemented. Significant right-of-way purchases for transportation projects are costly and can negatively affect local businesses and residents and should therefore be minimized.
- The timing of regional projects should be coordinated with local projects (including utility projects and private sector developments when possible) to combine multiple projects where appropriate, and in other cases to avoid having multiple projects along nearby parallel corridors at the same time.
Figure 4.9: Mobility hierarchy

This approach recognizes the diminishing returns to higher levels of investments. Cost savings can then be used to address other needs on the system, thereby stretching the region’s transportation funds further and allowing for greater return on investment and a regional balance of investments.
Investments
While the investment direction in this plan applies to all the regional highway system, the Highway Investment Plan most directly reflects investments on the state highway system, those principal and minor arterials owned and operated by the Minnesota Department of Transportation, which is made up of the interstate, U.S., and state trunk highways. It also includes competitively selected Regional Solicitation highway projects, Highway Safety improvement Program projects, and Minnesota Highway Freight Program projects. Regionally significant projects on city and county roads are also listed in this plan and shown on several maps in this plan. These are primarily minor arterial lane expansion projects or those that use federal funds.
The Highway Investments section is divided into four primary highway investment categories:
- Operations and maintenance
- Preservation of existing highway assets
- Safety
- Regional mobility
Regional mobility is described in six categories:
- Travel demand management
- Traffic management systems
- Spot mobility
- Interchanges
- Managed lanes
- Targeted regional capacity
The state highway investments planned for between 2025 and 2050 are described in this section for each of the four investment categories. Safety and regional mobility projects are mapped here and include local projects that use federal funds or meet the threshold for being regionally significant. These and other major state and local highway projects are listed in Appendices B and C.
The Long-range Highway and Transit Capital Project lists cover known regionally significant projects from 2025-2050. MnDOT’s planning for preservation is documented in its 10-year Capital Highway Investment Plan and, in addition to projects in the region’s Transportation Improvement Program, identifies projects from 2028-2033. The specific characteristics of projects identified in these later years are less certain and will be refined as project development progresses. This also includes announced projects from competitive opportunities (described previously) that are not yet included in the region’s Transportation Improvement Program.
The region is committed to providing facilities for all people to safely walk, bike, and roll. Bicycle and accessible pedestrian highway investments will often be made in conjunction with pavement and bridge projects, or as part of larger mobility projects, but specific projects are not identified here.
The following pages detail the investments in the four primary highway investment categories. After operations and maintenance, the three capital areas include project delivery funding, which accounts for approximately 20% of total capital costs. Project delivery activities include planning, technical, and project management staff; right-of-way (land) acquisition; consultant services to supplement agency staff and provide special expertise; supplemental agreements to address unanticipated construction-related issues; and construction incentives to encourage early completion. These are all included within MnDOT’s capital investment categories.
Specific capital investments are mapped in safety and regional mobility. These investments are described as funded when specific funding has been identified and planned, and where the investments will fit within the anticipated revenues over the life of this plan, however specific funds have not yet been identified. In a few cases groups of projects beyond this fiscally constrained plan have been identified and are described as part of this plan’s vision.
Operations and maintenance
Highway operations and maintenance is a high investment priority for the principal and minor arterial system. Primary operation and maintenance activities include:
- Freeway and arterial traffic management
- Freeway incident response
- Pavement patching and restriping
- Traffic signal, sign, management system, and lighting maintenance
- Guardrail and cable median barrier repair
- Snow and debris removal and roadway salting
- Drainage system maintenance (culverts, inlets, and underground pipes)
- Bridge inspection and maintenance
- Maintenance vehicle fleet management
Operations and maintenance costs have increased as traffic management systems have become more sophisticated, the highway infrastructure has aged, and the system has become more complex (for example, new intersection and interchange designs, as well as new safety treatments such as cable median barriers). MnDOT metro district anticipates spending approximately $8.2 billion on state highway operations and maintenance during this planning time frame.
Preservation of existing highway assets
A high capital investment priority is to rebuild or replace the existing principal and minor arterial system. Like operations and maintenance, these investments are essential for highway safety, access, and mobility for the traveling public and freight. These kinds of activities are often called preservation, resurfacing, asset management, or modernization investments. Primary highway asset management activities include:
- Pavement rehabilitation and replacement
- Bridge rehabilitation and replacement
- Roadside infrastructure rehabilitation and replacement
Rebuilding and replacement projects are also needed to preserve components beyond pavement and bridges, known as roadside infrastructure, and include drainage systems, signs, lighting, and traffic signals. Highway preservation efforts also create opportunities to include safety, multimodal, and congestion mitigation improvements in a cost-effective manner. MnDOT metro district is anticipated to invest up to $15 billion towards rebuilding and replacing pavement, bridge, and roadside infrastructure between 2025 and 2050. This is approximately 76% of the capital highway funding anticipated to be available during the time frame of this plan.
Figure 4.10: Example of roadway lifespan

Through 2033, pavement conditions on interstate, national highway, and non-national highway systems will decline but through 2042 conditions on the highways are anticipated to see more mixed results. Bridge deck area in poor condition is also expected to improve in overall condition toward 2033 with more mixed results through 2042. Some decline is inevitable because conditions are currently very good, particularly for pavements. The system also continues to age, and construction costs continue to grow faster than MnDOT’s revenue. Some of these outcomes are improved from past plans due to recent additional funding.
Preservation projects include many needed ADA improvements, and those costs are included within preservation of existing highway assets.
Table 4.5: MnDOT pavements and bridges in poor condition 2022 actual and projected toward 204284
| Measure | 2022 | 2027 | 2033 | 2042 | MnDOT targets |
|---|---|---|---|---|---|
| % of pavements in poor condition - interstate | 1.5 | 4.1 | 5.0 | 2 | <2% |
| % of pavements in poor condition – national highway system | 0.3 | 0.9 | 4.8 | 6 | <4% |
| % of pavements in poor condition – non-national highway system | 5.8 | 9.9 | 13.2 | 10 | <8% |
| % of bridge deck area in poor condition – national highway system | 5.2 | 3.9 | 6.5 | 5.0 | <5% |
| % of bridge deck area in poor condition – non-national highway system | 4.1 | 7.3 | 13.8 | 10 | <8% |
 Safety
Highway safety is a high priority for all improvements made to the highway system. All highway projects should identify and integrate cost-effective safety improvements. Minnesota has adopted highway safety plans and implemented collaborative interagency strategies for public education, enforcement, improved emergency medical and trauma services, and engineering solutions to reduce statewide traffic fatalities. Significant safety work remains, including building a culture of traffic safety and implementing a Safe System Approach, and because limited dedicated funding is available, all funding and projects should be identifying ways to implement strategies to reduce fatalities and serious injuries. In the metropolitan area, specific highway safety investments will include proactive and reactive strategies. Examples of highway safety investments include:
- Constructing roundabouts
- Reconfiguring roadways when possible, such as converting existing four-lane undivided roadways to three-lane roadways with two through lanes and a center two-way left-turn lane
- Installing cable median barriers
- Incorporating speed control, including setting appropriate speed limits, especially on roads where pedestrians and bicyclists are expected
- Managing access on nonfreeways
- Constructing reduced conflict intersections (restricting to and from minor streets)
- Providing separated bicycle facilities and treatments for pedestrians beyond just sidewalks that address crossing risks, such as crosswalk visibility enhancements and medians, and pedestrian refuge islands in urban and suburban areas
- Installing edge-line rumble strips
The Federal Highway Administration has identified a collection of countermeasures and strategies that are proven safety countermeasures that should be implemented as broadly as possible throughout the region to assist with reducing fatalities and serious injuries on the system.85
The Met Council has adopted, in accordance with federal regulation and consistent with the safety goal of this plan, safety performance measures and specific short-term targets for the metro area. These measures and the most recently adopted targets are included in the Imagine 2050 TPP Evaluation and Performance section.
MnDOT metro district is anticipated to invest approximately $900 million in specific highway safety investments between 2025 and 2050. These funds will be supplemented by other safety investments funded through competitive programs like the federal Highway Safety Improvement Program and through safety improvements that are included in many pavement and bridge preservation and mobility improvement projects.
The Highway Safety Improvement program is a core federal-aid program with the purpose to achieve a significant reduction in traffic fatalities and serious injuries on all public roads, including nonstate-owned roads and roads on Tribal land. The safety improvement program requires a data-driven, strategic approach to improving highway safety with a focus on performance. Most of the projects are roadway improvements, while others target other modes such as the installation of pedestrian countdown timers.
The location of the projects selected for competitive Highway Safety Investment Program funding from 2025-2027 are shown in Figure 4.11. Some of these mapped, federally funded safety program projects are located on MnDOT’s system, while others are on the local system. It should be noted that there are likely many more locally funded safety projects that are being planned and programmed in the region. Given the importance of safety to the region, the Regional Solicitation criteria for selecting projects includes a measure of crashes reduced by the project, as well as one specific to pedestrian safety. Collectively, safety was given the highest weight of all measures in the categories of spot mobility and safety, strategic capacity, roadway reconstruction/modernization, and traffic management technologies application for the 2024 Regional Solicitation. Figure 4.11 also shows MnDOT’s planned standalone safety projects.
Figure 4.11: Funded safety projects

Regional mobility
This region can improve our access to destinations through shorter travel times by any travel mode, and by development patterns that generally result in those destinations being closer to people. Travel time and land use patterns are captured in the concept of accessibility, the number of places a traveler can reach within a given period of time, using a given mode of transportation. Excessive travel delay and unreliable travel times on highways can have significant costs on people and business. Therefore, this plan continues its support of highway mobility projects for their quality of life and regional economic importance benefits, as well as their ability to provide critical safety improvements at the same time. As the region makes highway mobility investments following the investment principles, it also needs to understand the tradeoffs created with induced demand.
Induced demand
The concept of highway mobility improvements encouraging more travel is often referred to as induced demand. Induced demand needs to be considered differently based on the size of the investment, location in the region, and a range of other factors.
Induced demand can have both positive and negative consequences. While vehicle miles traveled per person has been stagnant since 2010, there is not an unending desire for people to travel more and more miles. In addition, most mobility projects in the Twin Cities are smaller in scale than those constructed in other states or comparable metropolitan areas. Finally, the largest recent mobility projects in our region have been managed-lane projects (for example, I-35W northbound MnPASS and I-35W downtown to the crosstown) where one managed lane is added in each direction and where there is still congestion in the rest of the general purpose lanes after construction (as opposed to adding two or three or more lanes in each direction to try to eliminate congestion). The combination of these factors likely dampens any impact of induced demand compared to past decades. However, induced demand still should be considered for its potential negative consequences, especially for large, general-purpose lane expansion projects on the freeway system.
Induced demand has several different components. Improved highway travel times can draw new trips to that corridor, especially in peak periods. Trips that come from different routes and times do not represent additional vehicle miles traveled and can be beneficial if those other routes better serve people walking, biking, rolling, and using transit. While limited in occurrence (especially given the reduced demand for express transit service to the two downtowns with increased telework post-COVID-19), trips that shift to driving from more sustainable travel modes represent benefits to individuals, as demonstrated by their new personal choices. However, they may result in other negative consequences in terms of climate and the public health impacts of pollution.
New and longer trips that are chosen after highway improvements also represent these personal benefits (for example, ability for someone to get to better health care, reach a new employment location, go to different store with a better selection, or a business able to reach a wider market area) and some disadvantages. Significant investments to reduce highway travel times can also make places at a greater distance more accessible and encourage lower development densities further from other destinations, causing added vehicle miles traveled.
The conclusion that added vehicle miles traveled will increase pollution must be tempered with how improvements in vehicle fuel efficiency and growing electrification are reducing criteria air pollutants and greenhouse gas emissions at a much faster rate than highways are being improved or that travel is growing.
While this plan works to reduce greenhouse gases by shifting the relative advantage of travel options toward the most sustainable and affordable modes, a growing region requires targeted investments in highway mobility. This plan includes the addition of approximately 27 lane miles (all part of managed-lane projects) and 14 intersection-to-interchange conversions on the principal arterial highways (a system of 700 center line miles). Overall, the addition of approximately 0.4% to the lane miles of the region’s modeled network (all principal and minor arterials, most collector roads and the most significant local streets) does not keep up with the anticipated 20% population growth during this plan. Additional projects are expected to be planned during this time frame and amended into this plan but are not expected to keep pace with population growth.
The regional mobility investment approach includes six sub-areas in the form of an ordered hierarchy that starts with the least costly and impactful project types and when necessary, moves to consideration of more expensive and impactful project types.
As outlined in the Highway Investment Plan Principles, these categories of investment are included in the sections below.
Travel demand management and transit advantages
The region’s first consideration when addressing mobility issues is travel demand management. Travel demand management strategies include a wide variety of approaches to reducing single-occupant vehicle travel and shifting trips outside of peak periods, such as implementing carpools and vanpools, staggered work hours, telework, compressed work weeks; and transit, bicycle and pedestrian investments, and land use changes.
Transit, bicycle, and pedestrian investments – including new transitways, expanded and enhanced transit service, park-and-rides, and enhanced bicycle facilities – are not always included in specific definitions of travel demand management, but for the purpose of this hierarchy of mobility investments, they are included with travel demand management. Other sections of the Imagine 2050 Transportation Policy Plan specifically address travel demand management, transit, walking, biking, and rolling.
Transit advantages are facilities or equipment that allow transit to travel faster than general traffic or bypass it in some cases. These advantages include but are not limited to transit-only street segments, bus-only shoulders and lanes, high-occupancy vehicle lanes and managed lanes, ramp-meter bypasses, traffic signal queue jumps, transit signal priority, and curb extensions at transit stops.
These features help transit be a more competitive and attractive option than driving alone, especially on roads with congestion or many traffic lights. Speed and reliability are consistently cited as top priorities for transit riders in the region. In addition to providing benefits to riders, transit advantages also make transit service more efficient to operate. In some cases, improvements to travel time on a route can reduce the number of buses and drivers needed to operate it, meaning the same service can be provided with fewer resources. These savings can then be allocated to other routes or used to increase frequency on the improved route. Transit advantages can also help manage vehicle demand on roadways by making transit flow smoother and attracting additional riders, which also improves its people-moving efficiency.
Traffic management systems
The region’s next consideration to address mobility issues is an evaluation of potential traffic management systems. Examples of traffic management systems include traffic signals and coordination (including advanced walk signal, countdown timers, and queue warning), traveler information systems, incident response programs, dynamic signing and re-routing, and ramp meters with high-occupancy-vehicle bypass lanes. On freeways, traffic management systems may be done in conjunction with other corridor-wide improvements such as the construction of a new or extended managed lane. In some cases, however, more limited traffic management system strategies can be implemented in an effective manner, on a case-by-case basis, to improve freeway and nonfreeway highways. Past investments in this area have increased the capacity, reliability, and safety of the existing highway system. Before pursuing larger cost capital projects, an agency should be assured that traffic management systems have been implemented to the most cost-effective extent possible.
Spot mobility
The third category to be considered for mobility investment is to implement lower-cost spot mobility improvements at targeted locations designed to maximize the return on investment. These improvements are smaller in scope than traditional highway investments with the intent to allow quicker and simpler delivery and recognize the diminishing returns of many larger projects. The region’s goals and highway investment principles are put into practice through the technical criteria used in regional studies. The region will continue to identify these spot mobility projects through a variety of investment studies. The study results are used to help make informed investment decisions. Three such investment prioritization studies have influenced the projects included in this plan within spot mobility and each is described here.
MnDOT metro district, whose borders generally align with the Twin Cities metro area covered by this plan, last completed a Congestion Mitigation Safety Plan study in 2018. This was the fourth iteration of the congestion plan that our region has used to evaluate safety and mobility deficiencies on MnDOT’s highways, including freeways and arterials. This study focused on developing smaller, more targeted solutions that might be implemented on a wider basis than large, traditional, expansion projects. These improvements are either spot improvements, such as at an intersection, or short auxiliary lanes. Study results are used to select projects for MnDOT’s approximately $15 million per year spot mobility set-aside, which continues through 2050. The Regional Solicitation also includes an application category called spot mobility and safety to fund these types of projects, primarily on the county-owned systems.
The spot mobility projects presented in Figure 4.12 are shown as opportunity areas. The funded projects are those programmed by MnDOT for near-term construction and those funded by the Regional Solicitation. The planned Congestion Mitigation Safety Plan opportunity areas were evaluated in the most recent Congestion Management Safety Plan and determined to result in a return on investment of less than 10 years. These planned opportunity areas appear promising upon initial evaluation but require additional project development work with local partners and more detailed evaluation. A project to update this work will begin in 2025 or 2026 and results will be considered in future updates to this plan.
The Freeway System Interchange Study was a joint study of MnDOT and the Met Council, completed in 2020, and was a thorough mobility and safety review of system interchanges (where at least two freeways meet) in the Twin Cities metro area. It used measures of congestion, reliability, crashes, freight, and transit to screen locations. At most locations with the greatest need, a range of potential solutions were developed. This study documented, at a planning level, the anticipated costs and return periods of improvements, and overlapping preservation plans to inform future investment decisions. The freeway interchange study reported several possible lower-cost, quick-return-on-investment projects that are opportunities included in spot mobility. These projects do not include grade-separated solutions, are narrowly targeted, cost less than $10 million, and have return-on-investment periods of less than four years. These projects are mapped in Figure 4.13.
The Intersection Mobility and Safety Study was completed in 2024. The Met Council and MnDOT jointly led the study and worked with local agencies to analyze and prioritize at-grade intersections on the principal arterial system within the Twin Cities metro area. This study serves as an update of the 2017 Principal Arterial Intersection Conversion Study. The study results included a before-and-after analysis of recently completed interchange and intersection projects that showed they were highly effective in improving mobility and safety, as well as provided co-benefits in building out roadway facilities that support mode choice and meeting ADA compliance. It identified approximately 80 intersections as high regional need locations based on the analysis. Four of these locations are planned for grade-separated solutions and shown within this regional mobility section under interchanges; the rest are shown here as opportunities for spot mobility improvements.
Figure 4.12: Regional mobility investments: spot mobility

Interchanges
When at-grade solutions are evaluated to be insufficiently effective, then grade separation should be explored at an intersection. This project type is more expensive than an at-grade option and care must be taken in evaluations that interchange benefits justify this higher cost.
An evaluation of completed interchange projects in the metro area indicates that many positive co-benefits have been documented including reduced delay, increased safety, better travel time reliability, improved stormwater management, as well as addressing gaps in the bicycle and pedestrian networks and improved ADA-accessibility in the project areas. Given the larger scale of the projects, deliberate effort should be made to minimize any potential negative impacts. In many cases, locations desired for interchanges have critical safety issues and this can be the primary rationale for the project. The interchange solution dramatically reduces the crash risk for serious injury and fatal crashes by limiting right-angle crashes through grade-separating the directions of travel.
The 2024 Intersection Mobility and Safety Study (described above) resulted in four high priority areas for grade separation that are listed in the plan. Out of more than 500 intersections studied in this effort, only these locations demonstrated a high regional priority through the study results, a high local priority as identified by local partners, and completion of a corridor study or other planning effort that pointed to a grade-separated solution. These are included in Figure 4.12.
During 2019 and through the first half of 2020, Scott County led the construction of an interchange at U.S. Highway 169 and Minnesota Highway 41 to replace an at-grade intersection west of Shakopee. This project services as an important north-south connection for the region and a Minnesota River Crossing to the west. North and southbound reliability deficiencies were reduced by 33% and 27%, respectively. In the 10 years before the project, one fatal and one serious injury crash occurred, rates of 1.28 per 100 million entering vehicles for each. In almost three years since the project, no fatal or serious injury crashes have occurred here.
In addition to the potential benefits of converting existing at-grade intersections to grade-separated interchanges, many existing interchanges are aging and can benefit from improvements for safety, vehicle mobility, pedestrians, and bicyclists. This topic will be subject of a future prioritization effort that is detailed in the Imagine 2050 TPP Work Program.
Two of the funded interchanges shown in Figure 4.13 exist today but include only partial access. Projects at I-35E at Ramsey/Anoka County Road J and MN Highway 610 at East River Road will construct the missing access ramps at these existing interchange locations.
Interchange projects are often led by local cities and counties in partnership with MnDOT and require multiple funding sources. Some of these sources include the Regional Solicitation, Corridors of Commerce, and other competitive state and federal grants.
Figure 4.13: Regional mobility investments: interchanges

Managed lanes
If previous categories of investment within this mobility hierarchy will not adequately solve the mobility problem, then the fifth priority of investment is managed lanes. Priced managed lanes manage demand to provide a less-congested, more reliable travel option during peak travel periods for transit riders, carpools, and those willing and able to pay. Managed lanes can improve highway efficiency and effectiveness by prioritizing the number of people moving through the corridor over the number of vehicles moving through and providing long-term travel time reliability that is not possible with general purpose lanes. A system of managed lanes can improve highway efficiency by moving more people through congested highway corridors during peak time periods.
In this plan and in most large project environmental processes, a variety of managed lanes are considered. The region has built several priced managed lanes that are high-occupancy toll lanes. These are part of the national E-ZPass network that currently provides toll facility interoperability throughout the eastern half of the United States and soon throughout the entire country. During peak periods, E-ZPass lanes in the Twin Cities are free to transit and high-occupancy vehicles but charge a price that varies with usage to single-occupant vehicles, including trucks weighing less than 26,000 pounds. The variable price allows these lanes to be managed toward a less congested and more reliable travel option. Any vehicle can use the E-ZPass lanes during nonpeak time periods. Figure 4.14 shows existing E-ZPass lanes and one new corridor under construction on I-494.
MnPASS is the historical name for the Twin Cities system of priced managed lanes. The ones currently in operation are part of the nationally interoperable E-ZPass network.
Completed in 2017, the MnPASS System Study 3 was conducted to assist in updating the vision for managed lanes in the Twin Cities and prioritize corridors. Since previous studies of managed lanes were completed, many changes had occurred to corridors, as well as to other regional highways. This study revisited the managed lane corridor priorities and considered new corridors for prioritization.
The MnPASS System Study 3 utilized several criteria to evaluate potential managed-lane corridors against prioritization factors representing the goals in the region’s transportation policy plan at the time. These criteria included proximity to employment centers, severity of congestion, connections to other managed-lane corridors or major destinations, express commuter bus demand and a ratio of 2040 mobility benefits to estimated construction costs. Study results were used to develop the managed-lane vision in the 2040 Transportation Policy Plan and that vision generally carries over into this plan. A study to update this work and reevaluate potential managed-lane corridors based on the goals in this plan is listed in the Imagine 2050 TPP Work Program.
The region has three planned managed-lane corridors shown on Figure 4.14. In each corridor, a preferred alternative will be selected based on the solution that best meets the project’s stated purpose and need. Adequate funds are either available now or are anticipated to be made available to allow construction. It is anticipated that some of the projects will receive other outside competitive funding. This will free up future funds where future projects could either be amended into the plan or allow a great level of investment to be made in these corridors.
On I-494, phase I of the planned managed-lanes project is under construction between East Bush Lake Road and I-35W. The planned improvements here will extend these lanes at either end to cover the segment of I-494 from west of U.S. Highway 169 to east of Minnesota Highway 77/24th Ave.
Along Minnesota Highway 252 and I-94 from Minnesota Highway 610 to 4th Street, an environmental impact statement is underway considering a range of mobility alternatives and other investments. Although a managed lane is included in this plan, the region remains committed to the outcome of a fair and transparent process in the ongoing environmental process. The Minnesota Highway 252 and I-94 corridor has in the past been awarded competitive funding for improvements, including $10 million from the Minnesota Highway Freight Program, $26 million from the Regional Solicitation, and $119 million from the Corridors of Commerce program to grade separate Minnesota Highway 252 and construct managed lanes from Minnesota Highway 610 to Dowling Avenue.
The third managed lane that is planned in this fiscally constrained plan is along I-35W between Ramsey County Road C and downtown Minneapolis. A detailed study of the corridor was underway when COVID-19 disrupted travel patterns and left the mobility needs here uncertain. Large pavement and bridge preservation investments anticipated for the corridor in the early 2030s will lead to further evaluation of managed lanes as part of a future environmental process.
Although managed lanes have often been implemented as additional lanes, conversion of a general-purpose lane may be considered in some corridors. This conversion was completed for a short segment of I-35E E-ZPass at I-694. Conversion was also examined as part of a recent I-35W gateway study for northbound I-35W between Ramsey County Road C and downtown Minneapolis. Given the region’s goal of reducing greenhouse gases, conversion of general-purpose lanes to managed lanes should be studied as part of all future managed lane projects.
Outside of the three corridors discussed above, other parts of the managed-lane vision for our region are beyond the anticipated revenues in this plan. No funds have been allocated to these projects and as such they are shown in Figure 4.14 as managed-lane vision (these projects are not in the plan and will need to be amended into the plan when funding is identified). If additional funds become available or if long-term preservation work is planned for these corridors, managed lanes should be considered. All these corridors have been recently studied except I-694 in the north metro. This corridor should be prioritized for future study efforts.
Figure 4.14: Regional mobility investments: managed lanes

The MnPASS System Study 3 also identified supporting investments and strategies that may be necessary to continue to assure a less congested, more reliable trip. The first strategies considered will generally include lower cost options such as pricing algorithm adjustments, access modifications, increased enforcement, and lower-cost/high-benefit improvements included in this plan.
If the above strategies have been exhausted or will be ineffective, or if other operational challenges emerge, other strategies will need to be considered:
- Raising the maximum rate
- Changing the high-occupancy vehicle policy to only allow vehicles with three or more occupants to use the lanes for free
- Requiring high-occupancy vehicle users to have E-ZPass accounts and tags
- Implementing camera-based license plate tolling
- Adding E-ZPass lanes
These strategies will be reevaluated in the next system study identified above and in the Imagine 2050 TPP Work Program. Two areas of the E-ZPass system are at risk of failing to meet travel time reliability goals and may need physical capacity improvements. These improvements are included in this plan:
- I-394 eastbound exit lane addition at 12th Street into downtown Minneapolis
- I-394 slip ramp from the collector-distributor road for northbound U.S. Highway 169 traffic merging onto westbound I-394
Targeted regional capacity
In some cases, travel demand management, traffic management systems, spot mobility improvements, interchanges, or managed lanes do not sufficiently resolve the specific highway deficiencies necessary to alleviate excessive delay for people and freight. The sixth priority of mobility investments, targeted regional capacity, may be implemented when other previously described investments cannot adequately improve travel conditions for people and freight.
These types of improvements are described below and the specific projects to be implemented within this plan are then identified. The region has established principles (described above) that these improvements must be consistent with this highway investment plan.
Examples of targeted regional capacity enhancements on freeways include:
- Freeway system-to-system interchange improvements including new grade-separated movements and added through lanes
- Truck climbing lanes
- New general-purpose lanes or continuous auxiliary lanes that extend beyond one interchange
Examples of targeted regional capacity enhancements on other principal arterials include:
- Projects developed with the Congestion Management System Plan study that are too large to fit into the spot mobility category
- New general-purpose lanes
The region will only have revenue to complete a limited number of targeted regional capacity projects as illustrated in Figure 4.15 and listed in the Long-Range Highway and Transit Capital Project Lists. Programmed projects include two short lane expansions in Brooklyn Park partially funded through the Regional Solicitation. Special funding programs, such as the state's Corridors of Commerce program, may fund future targeted regional capacity enhancements. The Freeway System Interchange Study resulted in ideas for improvements that may be cost effective, and while they are beyond the fiscal constraints of this plan they are included here as part of the vision to be considered in the future.
Direction for unallocated funding and competitive opportunities
The investments identified in this plan above can be funded through anticipated revenue and are the region's highest highway investment priorities. These, however, do not represent all the highway investments needed to achieve the goals and objectives in Imagine 2050, this plan, Minnesota’s Statewide Multimodal Transportation Plan, or the Minnesota State Highway Investment Plan. This section identifies a higher level of spending for highway investments that will come closer to advancing the visions set forth in these planning documents.
During the 20-year Minnesota State Highway Investment Plan (MnSHIP), MnDOT estimates there will be $36.7 billion in available revenues to address between $52 billion and $57 billion in identified transportation needs. Recent increases in revenue have reduced 20% of the unmet need for MnSHIP, but a funding gap of approximately $15 billion to $20 billion remains. Revenues are not expected to keep pace with forecasted inflation for the construction-related sector over the planning period. Additional capital improvements are needed to maintain aging infrastructure and meet Minnesotans’ growing transportation needs. MnSHIP recognizes unmet needs in all six investment categories: system stewardship, transportation safety, healthy equitable communities, critical connections, climate action, and other areas.
Most of the existing funding is going to operations, maintenance, and preservation activities in this plan, and this level of funding allows the region to largely meet performance targets for asset preservation in the near future. Therefore, new revenues coming to the region should first be considered for other identified needs before going back to these core functions. All new capital investments will also need to include an additional 20% for program delivery and may require increased operations funds depending on the type of investment.
Figure 4.15: Regional mobility investments: targeted regional capacity

Unallocated revenues should be considered first for three primary areas before being used to better meet identified needs in other investment areas:
- Safety – Identified in this plan as the region’s highest priority and incorporated into all investment categories, this category of funding represents stand-alone, targeted safety improvements. MnSHIP identifies a statewide unfunded safety need of approximately $1.2 billion over 20 years.
- Main streets/urban pavement – A new category in MnSHIP, this presents an opportunity to address a variety of unmet needs on state highways that serve people where many transportation and other needs meet.
- Regional mobility – Identified in MnSHIP as the largest unfunded investment need. In addition, funds allocated to highway mobility in this plan will be greatly reduced starting in 2034. New revenues should be used on the mobility priorities identified in this plan and to relieve local cities and counties from leading projects on the state system. Some of this unmet need may be realized through competitive funding sources such as Corridors of Commerce and the Nationally Significant Multimodal Freight and Highway Projects program, which are geared toward regional mobility improvements. As regionally significant projects become fully funded, the specific projects will need to be amended into the plan.
- Multimodal – Construct missing links in bicycle and pedestrian systems, with a focus on safety for the nonmotorized modes. In addition, move up planned ADA improvements (for example sidewalks, curb ramps, and intersection crossing improvements) to earlier years so that MnDOT can be fully ADA compliant sooner than 2037 as detailed in MnSHIP. This type of investment ties directly back to the equitable and inclusive, and healthy and safe goals of Imagine 2050.
The Intersection Mobility and Safety Study, Congestion Mitigation Safety Plan, and the Freeway System Interchange Study (described previously) resulted in many promising highway improvements. Some of these study priorities are in the plan, while others are beyond the fiscal constraints of this plan and require further project development and evaluation. These opportunity areas should be considered when major preservation projects are being developed in overlapping locations.
There are now, and will continue to be, highway needs in the region that are not addressed under this fiscally constrained plan. Regional transportation partners have identified many potential long-term highway improvement projects, often through the local comprehensive planning and capital improvement planning processes. When conducting studies of these potential improvements, regional transportation partners must use the population, household, and employment forecasts, and corresponding urban and rural land use plans adopted by the Met Council and local communities, so all potential projects can be comparably prioritized for investment. To increase the likelihood of being able to fund these projects, studies should work to develop innovative and affordable projects that address reasonably anticipated needs based on these forecasts and plans.
Figure 4.16: Estimated Minnesota state highway funding gap 2023 to 2042
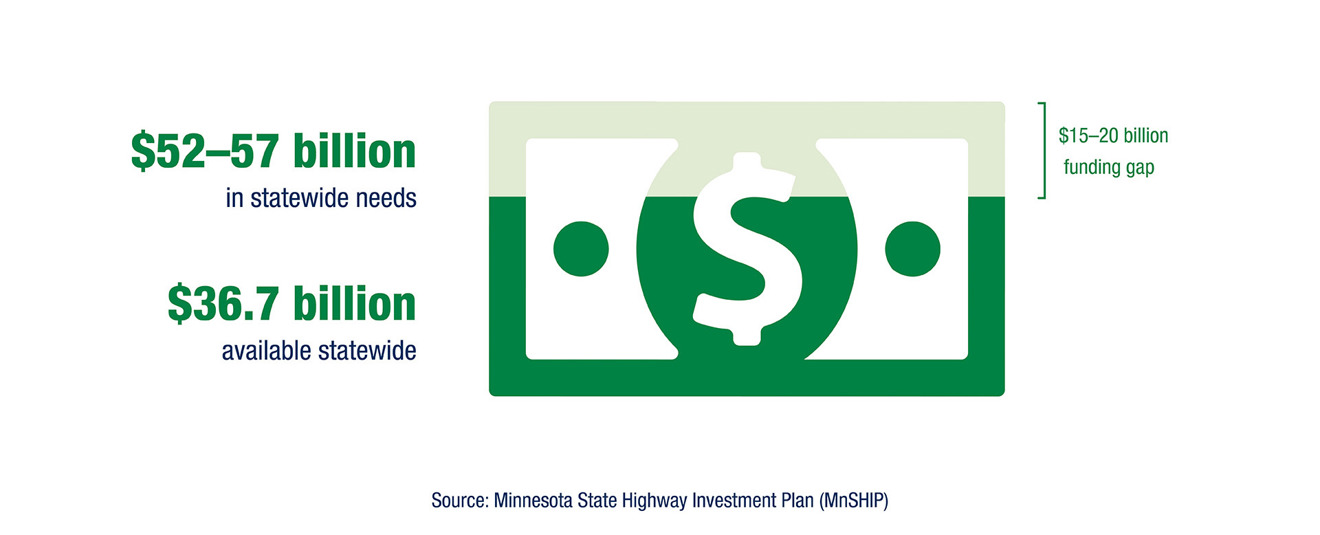
Rethinking I-94
Interstate 94 between the central business districts of Minneapolis and Saint Paul is one of the most utilized highways in Minnesota and serves many interstate, regional, and local trips for our region. It also connects many major regional destinations including the Minneapolis and Saint Paul downtowns, the University of Minnesota, Minnesota State Capitol, along with other educational institutions and several major sporting facilities. While serving many important regional travel purposes, this corridor also has inflicted significant past and ongoing harms to the adjacent communities including disconnection, displacement, and negative noise, air quality, and visual impacts, among other harms. This history of past and ongoing harms must be considered, prioritized, and addressed, and as a future vision for the corridor must be done in partnership with the impacted communities.
Today the highway is showing its age with significant deferred maintenance needs, especially in terms of road pavement and bridges. It is anticipated that in the coming years these assets will need to be significantly maintained and replaced, offering an opportunity to explore and determine a long-term vision for the Interstate 94 corridor between the downtowns.
In 2016, MnDOT undertook the Rethinking I-94 process to develop a corridor vision and a program of projects to address the various corridor needs. I-94 between I-35W/Hiawatha Avenue in Minneapolis and Marion Street in Saint Paul is currently in a Tier I environmental impact assessment under the National Environmental Policy Act (NEPA). The project team is developing a range of corridor alternatives, receiving community input and feedback on the alternatives, and will identify a preferred alternative and program of projects for the corridor. While identified as a strong candidate for a future managed high-occupancy toll lane in the MnPASS System Study 3 (2017), this system study focused primarily on regional mobility needs and did not address the other needs within the corridor, which are now being considered as part of the Rethinking I-94 process. No specific corridor projects are identified in this plan as these will be identified as an outcome to Rethinking I-94.
Once Rethinking I-94 has a selected alternative, an amendment to this plan will be required to specifically identify the selected corridor alternative, projects, and sources of funding to complete the projects. Like the 2040 Transportation Policy Plan, $100 million of regional mobility funding is currently unallocated in the plan and is set aside for this project. This is likely only be a small portion and one category of what will be required to fulfill the preferred alternative that will be selected in the coming years.
System planning for additional principal arterials
Population is anticipated to grow by 660,000 people through 2050, and parts of that growth and land development are anticipated in future suburban edge and emerging suburban edge areas where the arterial grid is not adequately developed. Therefore, there will be needs for new principal and minor arterials. Often new principal arterials will be highways that are upgraded from existing minor arterials. There is active planning for future principal arterials and the needs are described (see functional classification criteria and characteristics in the Functional Classification section of the Imagine 2050 Transportation Policy Plan):
- Anoka County has identified Anoka County Highway 22/Viking Boulevard from Sherburne to Chisago counties as the anticipated location for its potential future east-west principal arterial.
- Scott County has identified Scott County Highway 17/Minnesota Highway 13 from U.S. Highway 169 to Minnesota Highway 19 as the route for its potential future north-south principal arterial. Scott County has also expressed interest in the long-term development of Scott County Highway 76 and Scott County Highway 8 from U.S. Highway 169 to I-35. In addition, Scott County Highway 78 from U.S. Highway 169 to Scott County Highway 17 is another future principal arterial connection that is being actively planned for upgrade.
- Dakota County undertook a principal arterial study in 2017-2018 to evaluate its system. The study recommended several segments be further considered in the next several years for principal arterial designation. These include Dakota County Highway 63 between Minnesota Highway 55 and I-494, which includes a new, planned interchange at I-494 and Argenta Trail; the southerly extension of the existing principal arterial designation of Dakota County Highway 23 from Dakota County Highway 42 to Dakota County Highway 70; and Dakota County Highway 70 from I-35 east to Dakota County Highway 23.
- Scott and Dakota counties have jointly identified an east-west route across the south metro for a potential principal arterial from U.S. Highway 169 to Minnesota Highway 52 that follows Minnesota Highway 19, Scott County Road 86, and Dakota County Road 86.
- Carver County has identified Carver County Highway 33 from the southern to northern boundary of the county as a long-term future principal arterial. It has also expressed interest in converting Minnesota Highway 5 into a principal arterial from U.S. Highway 212 east and extending into Hennepin County to the connection with I-494.
Since principal arterials should end with a connection to another principal arterial, actual endpoints can be finalized in the future.
New and upgraded river crossings to improve resiliency and quality of life
Regional transportation partners should continue to work together on studying the need for and feasibility of new or upgraded major river crossings.
Scott County is pursuing planning funds to study the Minnesota River crossings in the county to improve the resiliency of the system given the long distances between crossings. The Minnesota Highway 101 Bridge connecting downtown Shakopee and Chanhassen was recently improved, but the Minnesota Highway 41 bridge and its approaches over the Minnesota River remain vulnerable during major flood events. In 2019, the Minnesota Highway 41 bridge was closed for nearly six weeks. When this happens, people and goods are forced into long detours and additional pressure is put on the remaining crossings including the U.S. Highway 169 river bridge. Extended bridge closures negatively impact quality of life, the movement of goods, and the entire regional highway system. Given the high cost of a new river bridge in this general area, upgrades to existing bridges, including U.S. Highway 169, should also be explored.
Studies also are occurring for potential new Mississippi River bridges in the northwest metro. MnDOT recently studied a new minor arterial bridge over the Mississippi River potentially connecting the cities of Dayton and Ramsey. Local partners are also studying improvements to the existing Minnesota Highway 25 bridge or a new crossing over the Mississippi River near Monticello. While just outside of the planning area for the region, any potential improvements will also benefit the resiliency of the regional transportation system within the metro area.
