Transit Investment Plan
Table of Contents
Connection to regional transportation goals
Met Council and Transportation Policy Plan roles in regional transit planning
MnDOT roles in passenger travel beyond the region
Transit service providers
Types of transit service
Transitways
Transit advantages
Transit infrastructure and assets
Other transportation system assets and transit service
Transit system trends and uncertainties
Regional Transit System Policies and Procedures
New sales and use tax form 2023 legislature
Fares
Federal performance targets
Competitively procured services
Transit investment planning and decision-making tools
Regular-route bus services
Transitways
Non-regular route services
Transit fleet
Transit support facilities
Customer facilities
Transit advantages
Fare equipment and supporting systems
Safety and security
Regional Transportation Sales and Use Tax and other legislation
Additional funding opportunities
Introduction
The Transit Investment Plan lays out the types of transit investments the region will make to achieve its transportation policy goals over the coming decade, including specific projects that are funded within plan assumptions in the near future. To be good stewards of public funds and trust, the Met Council and its partners must invest in transit solutions that efficiently support the region’s strategic goals and objectives. Transit providers86 and the Met Council must also collaborate with cities and counties to integrate transit with development and land use planning, other transportation systems such as roadways, and other public services.
Transit is an essential means of travel for many residents in the region. On a typical weekday in 2023, people in the Twin Cities region took more than 135,000 rides on public transit services. The Met Council’s 2021-2022 Travel Behavior Inventory, which tracks changes in regional travel patterns, found that roughly 26% of respondents said they use transit. When applied to the region’s population, this translates to nearly 800,000 people who use transit at any point throughout the year. Of that, the study estimated that roughly 160,000 people, or about 5.1% of the region’s population, use transit two days a week or more. An additional 24,000 (0.8%) use transit weekly, another 85,000 (2.7%) use it a few times a month, and over 524,000 (16.9%) use it a few times a year.
The purposes of riders’ trips include the full range of needs from commuting to work or school, to running errands, to accessing medical care, to visiting friends and family, or going out to eat or see entertainment. Riders using transit for these different purposes need service at various times of day and have different things that make transit a useful option for them. The region’s transit providers work diligently to put services and facilities where people are most likely to use transit. In 2022, roughly 55% of the region’s residents lived within a 10-minute walk (about a half mile) of any transit service and 19% lived within that distance of frequent transit service (departing every 15 minutes or better).
Public transit is an essential part of our regional transportation system. It helps provide equitable access to mobility and opportunities. Transit is one of the only options that supports travel across the region for those who cannot drive for any number of reasons. According to data from the 2021 American Community Survey, roughly 57,000 residents of the region lived in a household without a private vehicle. This figure does not include households with fewer vehicles than drivers, which also often rely on transit for mobility.
The transit system also reduces greenhouse gas emissions and pollutants by moving more people where they need to go with fewer vehicle miles traveled. This also helps reduce wear on the region’s roads and helps manage congestion, particularly where demand is highest. In this way, transit benefits residents throughout the entire region, including places with limited or no transit service, and helps make the region an attractive place to live, visit, and do business.
Connection to regional transportation goals
Investing in and implementing a robust public transit system will play a key role in achieving the region’s five strategic planning goals and their supporting transportation objectives:
Our region is equitable and inclusive
Transit can be used to improve how equitable and inclusive the region’s transportation system is, particularly for those who cannot afford their own car, who cannot drive, or who wish to live without owning their own vehicle. Furthermore, thoughtful implementation of transit services and projects can contribute to addressing past harms to various communities in our region such as Black people, Indigenous people, and other people of color. However, the reverse can also be true with major infrastructure investments, raising concerns about displacement of residents and businesses. The Met Council is committed to working together with communities to ensure those who already live near a project benefit from it along with the rest of the region.
To that end, this plan incorporates findings from recently completed studies on equity into policy and investments such as its Transit Service Allocation Study, which investigated how well bus service is matched to different communities’ needs. This plan will incorporate findings from other ongoing studies as they are completed. This plan also details how transit projects and planning in the region will implement equity and inclusion policies and actions identified in the overall transportation plan.
Our communities are healthy and safe
Public transit is one of the safest modes of transportation to use in terms of risk of injury or death,87 particularly when compared to driving a private vehicle. Getting more people to ride transit is a key strategy to reduce transportation-related injuries and deaths and supporting the region’s Toward Zero Deaths goals. Having a well-used system can also aid in transit feeling more secure and welcoming for all users. The region is making investments in rider security like the new Transit Rider Investment Program (TRIP)88 personnel, who check fares and assist riders, and recruiting additional transit police officers to support the region’s objective of making people feel safe and welcome when using any mode of transportation.
Using transit also generally encourages more walking, rolling, and biking, which contributes to better individual health outcomes. Furthermore, harmful pollution from the transportation sector is reduced as more people use transit instead of driving their own vehicles. The transit system can also contribute to a sense of community by being a place where people regularly interact with other members of their community, much like a public library or park.
Our region is dynamic and resilient
Transit provides an affordable and convenient option that helps people in the region meet their daily needs and connects them to opportunities, whether economic, social, or cultural. Implementing the region’s vision of fast, frequent, and reliable transit service on key regional corridors will make transit more convenient, accessible, and reliable for more of the region. Providing this expanded system will also improve transit’s competitiveness with cars, helping reduce the region’s overreliance on personal vehicles and contributing to a more balanced and resilient transportation system that provides freedom of movement for all residents.
We lead on addressing climate change
Investing in transit supports all the region’s objectives for leading on climate change. Shifting more trips to transit reduces both greenhouse gas emissions and pollutants, as well as vehicle-miles-traveled per person in the region. A robust transit system provides people more options, like choosing public transit instead of car ownership. Other investments such as transitioning the transit fleet to zero-emissions vehicles reduce emissions and tailpipe pollutants from transit vehicles themselves.
We protect and restore natural systems
While transit does not often impact natural systems as directly as other transportation infrastructure like roads, it is key to supporting strategies to protect natural systems like the region’s land use goals. For example, one regional land use objective in the Imagine 2050 plan is to minimize the amount of land used to accommodate growth in order to keep more land in conservation or agricultural uses. This will mean denser development in the region’s urbanized area and transit service will be key to maintaining people’s mobility, access to opportunities, and quality of life while managing congestion and emissions. Furthermore, transit projects can and should incorporate green infrastructure to provide benefits to natural systems such as by improving water quality.
Met Council and Transportation Policy Plan roles in regional transit planning
As the metropolitan planning organization for the Twin Cities region, the Metropolitan Council is responsible for coordinating transportation planning and policy - including for public transit - in a continuous, cooperative, and comprehensive process. The Met Council works with cities, counties, transit providers, and other partners like Tribal governments and the state of Minnesota to plan and implement projects, strategies, and services. The Met Council takes on multiple roles to fulfill this responsibility based on requirements in state and federal laws.
Long-range transportation plan
The Met Council is the lead agency for preparing the Transportation Policy Plan, which serves as the region’s long-range transportation plan for all modes including transit. The plan provides an overarching direction of how the region will manage and improve its transit services and infrastructure. This plan is required by federal law and ensures access to federal transportation funding and the ability to compete for federal discretionary grants.
Metro Transit governance and operation
Metro Transit, the region’s largest transit provider, is a service of the Met Council and is governed by it. Met Council members vote to approve Metro Transit contracts, agreements, and plans, and generally set policy for the agency.
Regional Solicitation
The Regional Solicitation is the region’s competitive process to award federal transportation funds that come to the metropolitan planning organization to projects that meet regional transportation needs and goals. Between 2014 and 2024, approximately $321 million, or about 22% of the total funds awarded through the Regional Solicitation, were awarded to 54 transit projects. Of that funding, roughly 41% was awarded to projects in urban areas, 27% to projects in suburban areas, and 32% to projects that served both urban and suburban areas. With regards to project type, of the Regional Solicitation transit funding about 44% went to transit expansion, 33% to transit modernization, and 23% to arterial bus rapid transit.
From 2018 to 2022, the Transportation Advisory Board focused these federal funds on modernizing parts of the transit system, expanding new services like microtransit and high-frequency services like bus rapid transit, and expanding existing routes of all types. The region has historically had a limited amount of local funds for transit modernization and expansion. As such, Regional Solicitation funding has historically covered 80% of regional transit project costs.
In 2020, the Regional Solicitation created a special category to provide a stable funding source to build out the arterial bus rapid transit system discussed later in the Transit Investment Plan. However, this special category also allowed other transit projects to be more competitive for transit funding in the solicitation. Furthermore, a guarantee that a portion of transit funding in the Regional Solicitation would go to "new markets" in Transit Market Areas 3, 4, or 5 was implemented at the same time.
Figure 8.1: Regional Solicitation funding to transit, by geography
![]()
Regionally significant transit projects
A regionally significant transportation project is on a facility which serves regional transportation needs like access to and from the area outside of the region, major activity centers in the region, or major transportation terminals. This includes, at a minimum, all principal arterial highways and all fixed guideway transit facilities that offer an alternative to regional highway travel.
Prior to construction, regionally significant projects must be approved in the 2050 Transportation Policy Plan and then approved for inclusion in the Transportation Improvement Program (TIP). The type of funding (for example, local, state, or federal) being used on the project does not impact whether a project is regionally significant (in other words, locally funded projects may still be determined to be regionally significant). For transit projects, regionally significant projects include the following:
- The addition of a new transitway, including arterial bus rapid transit, highway bus rapid transit, dedicated bus rapid transit, light rail, commuter rail, and modern streetcar
- The addition or removal of a transit station or stations on a transitway, including extensions of existing transitways (does not include minor station relocations that are part of the normal planning and engineering process)
- The addition of a permanent park-and-ride facility (for example, not leased) with a capacity of 250 or more stalls
Studies and prioritizing projects
Met Council staff regularly undertake studies to inform decision making on difficult issues the region faces and to aid in the prioritization of investments within a project type. An example of a recently completed study is the Bus Service Allocation Study, which was finalized in January 2021. Past results and active work are described in the relevant sections of this chapter. Planned future studies are in the Work Program chapter. The 2050 Transportation Policy Plan’s Work Program includes the following transit studies:
- Regional Microtransit Policy Framework
- Metro Transit Service Improvement Planning
- Arterial BRT System Update
Additional information on these planned future studies is in the Work Program chapter.
Coordinating regional transit service and policy development
The Met Council promotes transit service coordination by developing and maintaining regional transit policies and procedures. The intent of this work is to create a high-quality, seamless regional transit system while respecting local transit provider autonomy. Examples include fleet management, procurement, and facilities management policies and procedures. This work includes coordinating with services that connect to areas outside the seven-county region. The Met Council also facilitates communication and coordination among transit providers to ensure well-coordinated services and project delivery.
Transit Service Design and Performance Guidelines help steer investment decisions
The Met Council developed guidelines for designing transit service and route performance for service productivity and efficiency that provide a baseline for all transit providers in the region. These guidelines are in the Transit Service Design and Performance Guidelines document of the Transportation Policy Plan. Topics covered include transit market areas, transit planning basics, service design (stop spacing, minimum frequency, customer facilities, etc.), and route performance.
The Met Council reports transit route performance each year to the Minnesota Legislature
The Met Council prepares an annual Regional Route Performance Analysis that reports the performance of each route as compared to the performance standards defined in this plan.
Coordinating federal formula transit funding distribution
The Urbanized Area Formula Funding program (49 U.S.C. 5307) makes federal resources available for transit capital and operating assistance in urbanized areas and for transportation-related planning. An urbanized area is an incorporated area with a population of 50,000 or more that is designated as such by the U.S. Census Bureau. The Met Council adopted principles to distribute Federal Transit Administration (FTA) urbanized area formula funds in March 2001 through Business Item 2001-49. Those principles remain in use today.
MnDOT roles in passenger travel beyond the region
The Twin Cities region is also served by Amtrak passenger rail service and several intercity bus companies. MnDOT is responsible for planning intercity passenger rail and coordinating with local agencies such as Ramsey County Regional Rail Authority, which owns Union Depot in Saint Paul. MnDOT also coordinates with intercity bus companies in Minnesota. MnDOT maintains a Comprehensive Statewide Freight and Passenger Rail Plan and typically leads or partners as a lead on corridor studies for passenger rail. Amtrak is the likely operator of intercity passenger rail, though this is not a requirement. The following projects are currently in place or under consideration:
- Amtrak’s Empire Builder provides passenger rail service to Seattle, Portland, and Chicago. Trains arrive and depart once a day in each direction at Union Depot in downtown Saint Paul.
- MnDOT partnered with Wisconsin to add a second daily trip between Saint Paul and Milwaukee/Chicago. The Borealis Line officially announced began service in May 2024. Capital improvements and operating costs will be partially funded through two federal grants, state funds from Minnesota, Wisconsin, and Illinois, plus Amtrak funding.
- MnDOT is also leading a corridor development process for a higher speed passenger rail service called Northern Lights Express between Minneapolis and Duluth. The project received an appropriation from the Minnesota Legislature in 2023 for $194.7 million to provide the match for an anticipated federal grant that would cover 80% of the project capital costs. Project development is ongoing.
- MnDOT is collaborating with Met Council to study scenarios for the Northstar Commuter Rail corridor after the COVID-19 pandemic, as required by the 2023 Minnesota Legislature. This includes looking at extension to St. Cloud and communities in northwestern Minnesota.
Intercity bus service connects the Twin Cities with many destinations in the Upper Midwest, including Minneapolis-Saint Paul International Airport and intermodal stations in downtown Minneapolis and Saint Paul. Intercity bus service in Minnesota is operated by private companies like Megabus, Greyhound, Jefferson Lines, and Land-to-Air Express.
Existing Transit System
A total of 53.3 million rides were taken on public transit in the Twin Cities region in 2023, or about 16.2 trips per capita. This is a 16% increase in total ridership from 2022, showing encouraging signs of ridership recovery from the impacts of the COVID-19 pandemic. This includes roughly 2.1 million rides on special transportation service (Metro Mobility), within 13% of 2019 ridership of 2.4 million, and 186,000 on general public dial-a-ride, which was roughly 109% of pre-pandemic levels. To serve these riders, six regional transit providers ran 3.7 million hours of transit service in 2023, or about 1.2 hours per capita. The number of rides per in-service hour in 2023, called productivity, was 14.3 across all types of service regionwide, up 19% from 2022.
The total area served by transit (within a half mile of a transit stop) in the region was 492 square miles. About 55% of the region’s population lived within a half mile of regular-route transit services, and 19% lived within that same distance of high-frequency transit (meaning a transit vehicle departs at least every 15 minutes from a stop). Roughly 50% of the region’s jobs were located within a half mile of a transit stop.
Figure 8.2: Annual transit ridership in the Twin Cities region
![]()
Transit service providers
Six main transit providers operate transit service in the region. Their fleet size, geographic service area, and service types vary, but the Met Council works with each of them to ensure transit service is integrated and cohesive in addressing the region’s needs. Providers include:
- Metropolitan Council has two transit service providers within its organization:
- Metro Transit is the largest transit provider in the region and operates most of the region’s regular-route bus service, and all light rail and commuter rail lines.
- Metropolitan Transportation Services manages a variety of contracted services including regular-route bus, Metro Mobility paratransit service, Transit Link general public dial-a-ride, the Metro Vanpool service, and micro, its pilot microtransit service.
- Minnesota Valley Transit Authority (MVTA) serves seven communities south of the Minnesota River including Eagan, Apple Valley, Burnsville, Prior Lake, Shakopee, Rosemount, and Savage with regular-route bus, including express service, providing transit connections within their service area and to major regional destinations like the Mall of America, MSP International Airport, the VA Medical Center, downtown Minneapolis and Saint Paul, and the University of Minnesota. It also operates a microtransit service called MVTA Connect in Eagan, Apple Valley, Burnsville, Savage, and Rosemount.
- SouthWest Transit serves Chaska, Eden Prairie, and Chanhassen primarily with its microtransit service, Prime, and also operates regular-route bus service including express connections between those communities and downtown Minneapolis, MSP International Airport, and the University of Minnesota.
- Maple Grove Transit is operated by the City of Maple Grove and provides express regular-route service to major regional destinations like downtown Minneapolis and the University of Minnesota and My Ride, a microtransit service.
- Plymouth MetroLink is a service of the City of Plymouth and provides express regular-route service to major regional destinations like downtown Minneapolis and the University of Minnesota, and microtransit service.
- University of Minnesota provides regular-route bus service and paratransit service around and between its Minneapolis and Saint Paul campuses.
There are also transit services in the Twin Cities urbanized portions of Wright and Sherburne counties. Tri-CAP currently provides weekday dial-a-ride and deviated rural-route service within the City of Elk River, and Trailblazer provides similar services within St. Michael and Albertville. More information on these services can be found in MnDOT’s Annual Transit Report. Small transit services or individual routes are occasionally operated by other local communities as unique or demonstration services.
Transit capital levy communities and provider service areas
Minnesota state law created the transit capital levy communities in 2001 to fund regular-route transit services in the region. These are the communities within the seven-county region where a property tax is levied to pay for transit capital needs (see Figure 8.4). The original boundaries, established in state law, have expanded over time as communities have joined the levy district in response to the growing region. The most recent cities to join the levy district passed resolutions to do so around 2010 including Lakeville (2009), Forest Lake (2010), Columbus (2010), Maple Plain (2011), and Ramsey (2013).
The Met Council provides dial-a-ride for the general public in areas of Anoka, Carver, Dakota, Hennepin, Ramsey, Scott, and Washington counties where demand cannot be served on regular-route transit. Dial-a-ride service is also available in the contiguous urbanized portions of Sherburne and Wright counties.
Figure 8.3: Map of Transit Capital Levy District
![]()
The Americans with Disabilities Act paratransit service area
The Americans with Disabilities Act (ADA) requires complementary service for certified riders who travel where regular-route transit service is available but are unable to use it due to a disability. The state has established additional service areas beyond that through law.
Types of transit service
The primary type of transit operated in the region is regular-route bus, of which there were 130 individual routes operating as of December 2023 – 77 local and 53 express. Metro Transit also operates two light rail lines (METRO Blue Line and METRO Green Line), five bus rapid transit lines (METRO A, C, and D, Orange, and Red lines), and one commuter rail line (Northstar Line). In 2023, transit providers operated six different modes of transit service in the Twin Cities region including:
- Regular-route bus service is provided on a fixed, published schedule along specific routes, with riders getting on and off at designated bus stops. Regular-route service is provided using a variety of bus types that operate local services like core local routes, or suburb-to-suburb local routes, and commuter and express service. Some providers also operate a deviated regular-route, or flex service. Regular-route bus carried 67.1% of transit ridership in 2023 while using 53.6% of total service hours. The 14 bus routes in the high-frequency network,89 which provide 15-minute or better service throughout the day on weekdays and Saturdays, carried about 39.6% of transit rides in 2023 (Figure 8.6 shows high-frequency routes).
- Bus rapid transit (BRT) service has similar characteristics to regular-route bus but is provided at high frequencies with stops spaced farther apart to provide a faster trip. It also uses unique buses and specially designed facilities and amenities similar to light rail. The region sorts BRT services into three categories based on the kind of roadway it primarily operates on. Arterial BRT operates on arterial streets, highway BRT runs on highways for most of their length, and dedicated BRT has its own runningway, such as a bus-only roadway or separated lanes.
- Light rail transit service is provided on electric-powered trains with frequent trips and runs primarily on an exclusive right-of-way. Light rail uses specially designed transit stations and amenities. The region’s two light rail lines carried about 28% of rides taken on transit in the region in 2023 while using 8% of the region’s total service hours.
- Commuter rail service is typically provided on diesel-powered trains that operate on traditional railroad tracks with limited stops. Commuter rail typically serves commute trips at peak times. The region’s one commuter rail line, Northstar, provided 0.1% of regional ridership while using 0.1% of total service hours.
- Demand response transit provides shared-ride service that allows customers to schedule pickup. These services fulfill different roles based on the size of their service area, how far in advance rides must be reserved, and who is eligible to use the service. Demand response modes provided 4.7% of rides in 2023 while using 39.4% of service hours. This is due to the types of trips demand response serves, which cannot benefit as much from economies of scale like fixed-route services. There are three types of demand response service in the region:
-
- General public dial-a-ride provides access to transit services where regular route transit is not available. The Met Council’s dial-a-ride service is Transit Link.90
- Special transportation service is public transportation for certified riders who are unable to use the regular fixed-route bus due to a disability or health condition and is mandated by state and federal law. Met Council provides ADA paratransit service via Metro Mobility. The Met Council also rolled out a new service called Metro Move starting May 2024. Metro Move serves people who have a disability and are served by a brain injury waiver, Community Access for Disability Inclusion waiver, or a developmental disability waiver. The service links waiver participants to day support programs, work, and other community destinations.
- Microtransit is on-demand, shared-ride transit service provided within a defined service zone. The zone is usually small enough to keep wait times for a pickup under a set number of minutes. All the regional transit providers currently operate some type of microtransit service ranging from small pilots (Metro Transit micro) to service zones encompassing their whole operating area (SouthWest Transit Prime). The Met Council will be working with its partners to develop regional guidance for designing, implementing, and operating microtransit services.
- Public vanpools are made up of five to 15 people, including a volunteer driver, commuting to and from work destinations throughout the region on a regular basis in a subsidized van. Vanpools typically serve origins and destinations not served by regular-route bus service. Vanpools provided 0.2% of rides in 2023 while using 0.5% of service hours.
-
Figure 8.4: Transit ridership by mode
![]()
Figure 8.5: Service hours by mode

Figure 8.6: Map of current transit system, by mode
![]()
Transitways
The region uses the term transitway91 as a general designation for transit lines that meet one of the following criteria:
- Providing frequent all-day service, high-capacity or uniquely branded vehicles, and high amenity stations that include off-board fare payment
- High-capacity service operating on a fixed-guideway such as rail or a bus-only facility
Transitways are built on high-demand corridors where the most riders will benefit from enhanced services and amenities. Transitways also make the transit system more useful for riders by providing faster trips that allow them to reach more destinations and/or allowing easier connections from local routes resulting from higher frequency of service. The Met Council, through Metro Transit, currently operates all eight of the existing transitways in the region including:
- METRO Blue Line light rail
- METRO Green Line light rail
- Northstar commuter rail
- METRO Orange Line highway bus rapid transit (BRT)
- METRO Red Line highway BRT
- METRO A Line arterial BRT
- METRO C Line arterial BRT
- METRO D Line arterial BRT
All of these routes, except Northstar commuter rail, are also part of the METRO system and designated with a color for light rail and highway or dedicated BRT, or a letter for arterial BRT. METRO routes typically run at least every 15 minutes during most of the day, with the exception of METRO Red Line. METRO lines serve stations with enhanced amenities like heating, added lighting, real-time information, off-board payment, and improved security features.
While the University of Minnesota’s campus circulator service fits some of the criteria above, such as using a fixed-guideway and providing frequent service, the region does not consider it a transitway. Campus Connector Routes do not operate on weekends during the summer or other school breaks or meet other transitway guidelines such as customer facilities or weekend frequency.
Figure 8.7: Map of current transitway system
![]()
Transit advantages
Transit advantages are facilities that improve transit travel times and reliability primarily for bus service. Light rail and commuter rail operate on separate right-of-way from automobile traffic but still use some transit advantage improvements like transit signal priority or preemption on some sections of the METRO Blue Line and METRO Green Line where tracks cross roadways at grade. As of 2023, the region has built a network of facilities to give transit advantages over general traffic including:
- 336 miles of bus-only shoulders
- 6 miles of bus-only lanes on city streets
- 98 highway ramp meter bypasses
- 71 miles of managed lanes (for example, high-occupancy lanes, express-pass lanes)
- 7 miles of exclusive busways
- 161 intersections with transit signal priority
For more information see the region’s 2024 Transit Advantages and Transit Signal Priority Report.92
Figure 8.8. Map of transit advantage facilities
![]()
Transit infrastructure and assets
The transit system needs multiple kinds of infrastructure to operate. The region’s transit fleet includes nearly 2,100 vehicles that provide revenue service. In addition to vehicles, other infrastructure including customer facilities, support facilities, and transit advantages are all crucial to providing the services that riders rely on every day of the year.
All regional transit providers have support facilities, such as MVTA’s bus garages in Burnsville and Eagan, either through direct ownership or through agreements with private operators. Currently, Metro Transit uses five bus garages and three rail vehicle maintenance facilities to provide daily maintenance and storage of vehicles, with two additional facilities serving needs for more intensive vehicle repair and vehicle storage. These facilities support bus rapid transit vehicles as well as regular-route vehicles.
Customer facilities include bus stops, transit centers, transit stations, multimodal hubs, and park-and-ride facilities. The region also has 30 transit centers with facilities that improve waiting conditions and the transfer experience between buses and trains. With the opening of the METRO D Line in 2022, the region has 130 transit stations serving existing light rail, bus rapid transit, and commuter rail lines. The region had 71 active park-and-rides with nearly 28,000 spaces served by bus and rail transit in 2023 (not including park-and-ride facilities with suspended service).
There are also currently two regional multimodal hubs in the transit network. The Union Depot in downtown Saint Paul serves as a regional multimodal hub that connects local bus service, light rail transit, intercity bus services, Amtrak passenger rail, and potential future transitways. In 2014, the region opened a second regional multimodal hub in downtown Minneapolis at Target Field Station, where two light rail lines, multiple bus lines, and Northstar commuter rail come together.
Figure 8.9: Park-and-rides, transit centers, and hubs
![]()
Other transportation system assets and transit service
Most transit rides in the region are taken on buses, which mostly operate on roadways, bridges, and other facilities owned by cities, counties, or MnDOT. Disruptions to these assets such as vehicle collisions, construction, or poor conditions from deferred maintenance have impacts on transit riders, assets, and service. Likewise, major transit projects can disrupt other roadway users.
Similarly, all transit riders at some point in their trip are walking or rolling on sidewalks and other pedestrian or bicycle infrastructure, usually to get to transit services or their destinations after exiting the transit vehicle. A well designed and connected system of pedestrian and bicycle facilities that works for all ages and abilities is fundamentally important to an accessible and useful transit system.
Transit providers and agencies that own and operate these other transportation system assets should collaborate and coordinate planning and programming of transit and roadway improvements to ensure efficient and effective use of public funds and reduce disruptions to all transportation system users.
Transit system trends and uncertainties
Ridership recovering after pandemic, travel patterns continue to change
In the first months of 2020, travel patterns in the region began dramatically changing in response to the COVID-19 pandemic. With social distancing and other tactics like the shift to remote work for those who could being encouraged by the Centers for Disease Control, regional transit ridership experienced a dramatic decline, dropping to 42.9 million rides in 2020 or roughly 47% of 2019 annual totals. Transit providers also initially cut service on many routes and focused on providing service to essential destinations and essential workers, but they have been gradually reinstating service. For example, Met Council transit service hours, through Metro Transit and contracted services, were at 79% of October 2019 levels as of December 2023.
Transit ridership has also been recovering gradually since 2020. Ridership in the region in 2023 grew by 16% compared to 2022, with growth for individual transit providers ranging from 13% to 36%. While this recovery is encouraging, there is still uncertainty about what a “new normal” for transit ridership will be as travel behaviors and rider needs continue to evolve, although patterns are beginning to emerge.
Ridership recovery for regular-route services has varied by service type and location in the region. Ridership on bus rapid transit and local bus routes in urban areas recovering more robustly than on express bus and suburban services, which have been heavily impacted by ongoing telework trends. Demand response ridership in 2023 was just 9% under 2019 levels, with some services such as SW Prime, a microtransit service, showing growth compared to 2019. According to Metro Transit’s Network Now report, most bus trips on their services are now for purposes other than commuting for jobs during traditional business hours. Prior to 2020, commute trips made up 34% of trips on Metro Transit’s network and as of September 2023 accounted for 20% of trips.93 More ridership is also occurring throughout the day and into the evening, rather than concentrating around peak commute times.94
Transit providers and their partners will continue to thoroughly analyze how travel patterns are changing in the pandemic’s aftermath through products like the Travel Behavior Inventory, the Regional Route Performance Analysis, and regular monitoring of key transit performance indicators. The Met Council will incorporate the results of this work in future Transportation Policy Plan updates.
A high proportion of regional development occurs around high-frequency transit routes
The region has invested in growing its network of transitways over the past two decades and will continue to plan, design, and build them throughout the region. While these transitways serve centers of housing, jobs, goods, and services, there is often opportunity for additional economic development near the transit stations. The existing network of transitways serves only 3.4% of the region’s land area. Yet 38% of all multifamily, commercial, public and institutional, and industrial development since 2009 has been permitted within a 10-minute walk (roughly a half mile) of these transitway stations.95 That includes nearly 60,000 new housing units, which is 41% of the multifamily housing built in the region. Furthermore, this figure includes 10,710 new units of multifamily housing affordable at 60% area median income since 2014, which is 51% of affordable multifamily units built in that period.
The impacts of this transit-oriented development are significant. It means that more people can access housing opportunities near transit. It means that people already living near transit will have better access to job opportunities, services, and retail. It also means that more people will have access to an affordable and climate-friendly transportation option.
Figure 8.10: Housing within in a 10-minute walk of transitway stations
![]()
Almost one-third of ridership is on electrically powered vehicles – light rail and METRO C Line
A significant portion of the region’s transit rides happen on electrically powered vehicles. All of the region’s light rail vehicles are powered by electricity through overhead wires. Metro Transit operates eight battery-electric buses on METRO C Line which began service in 2019. Transit providers have also implemented other lower-emission options such as diesel hybrids operated by MVTA. Roughly 15 million rides, or about 28% of all transit rides in the region in 2023, were on electrically powered transit vehicles. The METRO Green Line and Blue Line extension projects will double the size of the region’s light rail system and are expected to significantly grow the number of trips on electrically powered transit vehicles.
In general, the region plans to continue adding battery-electric buses to the fleet. These technologies help reduce emissions from transit service, which contributes to achieving greenhouse gas reduction targets. Battery-electric buses also have no tailpipe emissions and so reduce local pollution in the neighborhoods they serve. Overall, shifting more travel from personal vehicles, especially driving alone, to transit means reducing the region’s emissions per person-mile-traveled.
Figure 8.11: Share of electrically powered transit rides

More transit agencies in the region are providing microtransit service
SouthWest Transit was the first agency to operate microtransit service in the region. SouthWest Prime began operating in 2015 and in 2023 the service provided roughly 142,600 rides.96 As of 2023, all the regional transit providers offer microtransit service to varying extents including MVTA Connect, Metro Transit micro, Plymouth Click-and-Ride, and Maple Grove My Ride. In 2022, Metro Transit implemented a 24-month pilot microtransit service in north Minneapolis97 and is exploring further pilot projects to test microtransit in different contexts (urban, suburban, etc.). The Met Council will be working with partners starting in 2024 to develop a regional policy framework for designing, implementing, and operating microtransit service to help guide growing interest in microtransit service.
Recruiting and retaining transit workforce a challenge for expanding service
During the pandemic, transit providers reduced services in part due to reduced demand but also due to a reduction in the number of drivers and supporting workforce available to operate transit services. Hiring has been a nationwide challenge for transit and similar industries. Hiring efforts and incentives by regional transit providers have improved employee retention and new workforce growth. As a result, transit agencies have been able to reinstate more service. For example, Metro Transit and Met Council increased their fixed-route transit service by 10% in 2023. The Met Council increased contract rates for Metro Mobility and other fixed-route services in 2022 to increase driver wages and reduce vacancies in contractor workforces. These efforts have helped stabilize workforce levels and maintain availability of critical services like Metro Mobility.
Transit and transitway investments planned by 2030 will require an estimated 30% increase in workforce including operators, mechanics, support systems, public facilities maintenance, and police.
Regional Transit System Policies and Procedures
The Metropolitan Council coordinates regional policies and procedures that apply to all transit providers. The intent of these policies and procedures is to provide a high-quality rider experience on a seamless and coordinated regional transit system while respecting the local autonomy of individual providers. These policies and procedures also ensure that shared transit resources are distributed equitably and transparently and facilitate an efficient system. A list of the key operating policies for transit providers is included in Table 8.1. Copies of any of these materials are available through the Met Council or directly from transit providers.
Table 8.1: Transit provider operating policies
| Policy | Description |
| Regional Route Performance Analysis | All regional transit providers will submit route performance information to the Met Council every year for review and inclusion in the Regional Route Performance Analysis. |
| Transit Fare Structure98 | All regional transit providers will adhere to the regional fare structure and prices established by the Met Council unless otherwise exceptions are specifically justified and granted. |
| Fleet Management Procedures | The Met Council’s fleet management procedure guides fleet decisions, including vehicle type and configuration, acquisition, use, maintenance, replacement schedule, ancillary equipment, and disposal. The policy also reflects fleet modernization, including alternative fuels such as low-sulfur diesel, biodiesel and ethanol, and alternative vehicles such as hybrid electric. All regional providers will adhere to the procedures and policies for regional transit vehicles. |
| Facilities Ownership Procedures | The facilities ownership procedure establishes the requirements for owning and maintaining a regional transit facility. All public regional transit facilities will be available for use by any regional transit provider. |
| Procurement Procedures | All regional transit providers will follow procurement procedures that are consistent with state and federal laws and guidance, as appropriate. |
| State Transit Funding Allocation Policy and Procedures | The region will distribute state transit revenues using procedures that allocate resources to state and federal mandated transit services and the region’s priorities, including the preservation of existing transit services and documented expansion priorities. |
| FTA Fund Distribution Policy | The Met Council adopted principles to distribute Federal Transit Administration (FTA) urban area formula funds for transit in 2001 that are still in use today.99 The Met Council is the primary recipient of these funds and distributes them to transit providers based on these principles. |
| Title VI Policy | Title VI of the Civil Rights Act of 1964 outlaws discrimination based on race, color, religion, sex, and national origin. The FTA requires evaluating public investments in transit for disproportionate impacts to and discrimination of protected classes based on the law. |
| Comprehensive Transit Financial Report | The Met Council is required by state law to prepare a report every two years that assesses the financial capacity and performance of the transit system and provides status updates on major transitway projects. |
New sales and use tax from 2023 legislature
The 2023 state legislative session significantly reshaped transportation finance in the region, particularly for regional transit services. The state legislature passed a transportation finance bill that revises existing funding sources and provides new funding for transit in the region. The new law required the Met Council to implement a three-quarter-cent sales tax effective Oct. 1, 2023, with 17% of revenues disbursed to metro counties and 83% to the Met Council. Of the Met Council share, 5% is for active transportation uses to be determined by the Transportation Advisory Board, with 95% for transit purposes.
Of the new sales and use tax funds distributed to counties, 17% may be used for transit purposes, complete streets, or mitigation action requirements.100 The 2023 transportation bill also revised the rate and distribution of state motor vehicle sales tax funds, increasing the rate and reducing the portion of these funds that come to the region for transit purposes. The net effect of these changes was mostly neutral to transit finance.
The new funding in the 2023 transportation bill addresses a structural deficit in transit operating funding in the region. It also relieves past county financial obligations for some transitway lines’ operations and maintenance. These local funds may now be used for other county transportation priorities. The new law also places full responsibility on the Met Council for operations, maintenance, and long-term capital repair and replacement of existing and new transitway lines in the region. Nearly all sales tax proceeds are committed through this combination of expenditures.
A portion of the new funding remains available for transit initiatives, expected to total approximately $2.3 billion by 2050. The Met Council will work with its regional partners to determine uses for these funds and will consider adopting a policy for the new funding source.
Additional information on the sales tax can be found in the Regional Transportation Finance Chapter and in the financial summary section later in this chapter.
Fares
The Met Council and its partners designed regional transit fare policies101 to achieve a variety of goals. According to the policies, fares should:
- Be simple and easy to understand to improve customer service and fare compliance.
- Reflect the costs of providing service while limiting the negative impacts to riders who have low household incomes or rely on transit as their only way to travel.
- Provide a seamless travel experience for riders when using multiple transit provider services and/or modes.
- Promote ridership growth while maintaining or increasing the proportion of operating costs covered by fare revenues.
The most recent fare increase occurred in October 2017, the first increase since 2008. The Transit Assistance Program was created in 2017 to help make transit more affordable for riders with low-incomes. Several transit providers have fare payment applications that customers can use on their smartphones such as the Metro Transit App or the RideMVTA App. Metro Transit also began testing two fare-free routes in 2022 as required by the state legislature. Route 32, a crosstown route mainly along Lowry Avenue, and Route 62, which serves Rice Street, were chosen to serve people in the east and west metros and to include a mix of core local and supporting local service. The routes also serve corridors where many residents identify as Black, Indigenous, and people of color, have low incomes, or who do not have access to a vehicle. The pilot is planned to continue through the end of 2024.
Federal performance targets
Performance monitoring and target setting for both transit safety and transit asset management is a requirement under federal law. The National Public Transportation Safety Plan outlines the safety performance measures and other expectations for the nation’s public transit providers. Safety performance targets are developed by transit providers, in coordination with the Met Council as the metropolitan planning organization and adopted as needed by the Met Council annually in accordance with federal law. The targets are allowed to remain the same from year-to-year without Met Council action. The four FTA-required transit safety performance measures are:
- Fatalities: total reportable fatalities and rate per total vehicle revenue miles, by mode
- Injuries: total reportable injuries and rate per total vehicle revenue miles by mode
- Safety events: total reportable safety events reported to the National Transit Database and rate per total vehicle revenue miles by mode
- System reliability: mean distance between major mechanical failures by mode
Transit asset management performance measures aim to manage transit capital assets most effectively through their entire life cycle. The following four performance measures and targets are federally required to be adopted by transit providers and metropolitan planning organizations:
- Rolling stock: percent of revenue vehicles that have met or exceeded their useful life
- Equipment: percent of nonrevenue service vehicles that have met or exceed their useful life
- Facilities: percent of facilities that are rated less than 3.0 on the Transit Economic Requirements Model Scale.
- Infrastructure: percent of track segments (by mode) that have a performance restriction
Competitively procured services
Contracting out transit services operation can be an appropriate and cost-effective way to meet new service demand, demonstrate new routes or service types, provide efficiencies on certain routes, properly align service expertise with providers, or maintain service in response to fiscal pressures. Decisions about which routes should be contracted to a private provider will be based on service demand, operator availability, and funding levels. Service contracts should be structured in a manner that promotes healthy competition and supports regional goals.
Metro Transit will continue to be the primary provider of regular-route transit services in its service area. The Met Council will review the amount of contracted service every two years. The target for private contract operations is 20% of regular-route bus service, measured in National Transit Database revenue hours.
Transit Investment Plan
The Transit Investment Plan lays out the types of investments that the region will make to achieve its goals and objectives outlined in the Transportation Policy Plan over the coming decades. All transit investments should support the five regional goals and transportation objectives. In practical terms, this means prioritizing investments that are safe and encourage healthy communities, emphasize equity, and allow people to better meet their daily needs on transit. The Transportation Policy Plan has nine types of transit investment categories that include:
- Regular-route bus service
- Transitways
- Non-regular-route bus service
- Transit fleet
- Transit support facilities
- Customer facilities
- Transit advantages
- Fare equipment and supporting systems
- Safety and security
Each subsection of the investment plan describes 1) the scope and decision-making process for the investment category, 2) the investments included in the plan, and 3) what investment opportunities there are for the region beyond what is in the plan.
Transit investment planning and decision-making tools
The region uses multiple tools and guidance for transit investment planning and decision making to deliver cohesive transit services that support regional goals and provide a high-quality customer experience. These tools help coordinate planning regionally but allow for local flexibility to match investments to local needs. These regional tools also help other transit stakeholders understand transit planning considerations.
Public engagement and surveys
All decision making on transit service design should be informed by robust public engagement efforts. While there may not be an engagement event or effort for every transit investment decision made, transit providers should base their decisions on stakeholder input, including input from customers and potential customers. Regular input from operators and customers is reviewed as part of the planning process. The region also conducts regular surveys, such as the Travel Behavior Inventory and its Transit On-board Survey, that provides valuable data on how people use the transportation system.
More robust public engagement is expected for major capital projects like transitways, as well as for major service changes as defined in each provider’s Title VI Plan. Public engagement and surveying should consider the unique needs of all demographics in the project area and the region to ensure that the engagement is comprehensive and a fair representation, with a particular emphasis on reaching historically underrepresented populations.
Transit market areas
The Twin Cities region uses transit market areas to describe how much demand for transit service there is in each neighborhood or community and what kinds of transit service can be expected to meet that demand successfully and efficiently. Transit market areas are defined by the demographic and urban design factors that are most associated with successful local, regular-route transit service. The Met Council updated its methodology for identifying transit market areas as part of the 2050 Transportation Policy Plan process to reflect the most recent changes to transit ridership and development in the region. The updated methodology is described in more detail in Regional Transit Service Design and Performance Guidelines. The region is categorized into five main transit market areas (see Figure 8.12) as well as other supporting features. The transit market areas are generally associated with community designations in Imagine 2050. The list below describes the general characteristics of communities in transit market areas and typical transit services. Not included are transitways, which are generally designed around specific corridors rather than market areas, and microtransit, because a regional framework will be developed in the next year for this mode.
- Transit Market Areas I and II are primarily Urban and Urban Edge communities where walkability and density of population and jobs can support higher transit service levels. These areas also have the largest concentrations of residents who rely on transit as their primary means of transportation. Transit in these areas provides a dense network of routes with frequent, all-day service that serves a wide variety of trip purposes. Market Area II typically has a similar route structure to Market Area I, but lower levels of service, as demand warrants.
- Transit Market Area III contains mainly lower-density Urban Edge and Suburban communities. It is characterized by lower density and less transit-supportive street networks and land use but with some pockets of denser development. Transit service in this market area includes suburban local routes, express and commuter service, and non-regular-route transit services, usually dial-a-ride, providing basic transportation access.
- Transit Market Area IV is mostly Suburban Edge communities along with portions of Suburban communities. It is characterized by low population and job densities that do not support frequent local transit service, and a spread-out, often circuitous, street network that hinders efficient routing. Transit service in Market Area IV is mainly peak-period express and commuter service at park-and-rides, which can effectively gather the lower density transit demand into one spot. There are some suburban local routes, including suburb-to-suburb connectors, although service is typically very infrequent. Non-regular-route transit, usually dial-a-ride, is generally available.
- Transit Market Area V is generally Rural communities including Rural Centers but also some Suburban Edge communities as well as freestanding town centers Stillwater, Waconia, Forest Lake, and Hastings. Market Area V is characterized by very low-density development or undeveloped land not well suited for regular-route transit service outside of limited peak-period express and commuter service.
Emerging market areas are unique areas of Transit Market Areas III and IV where there are significant pockets of higher density, but conditions in the surrounding area still limit the success of local transit. These areas should be a focus for future development that will connect them with areas of higher transit intensity, specifically looking at extensions of existing routes or connections.
Freestanding town centers are cities in the metropolitan planning organization region that grew independently of Minneapolis and Saint Paul but are still separated from the urban and suburban areas by rural land. These communities typically have small downtowns of their own but many of their residents commute to work in other regional centers. Local transit services that connect to the region would not be as effective at serving these areas given their location in the region, despite their relatively dense development. However, these areas may still have express service demand and possible demand for small circulator services.
Figure 8.12: Map of transit market areas
![]()
Transit Design and Performance Guidelines
The Regional Transit Design and Performance Guidelines appendix covers the fundamental elements of service planning to ensure consistency across the region on basic aspects of transit service. In addition to the service design guidelines, the document defines two performance measures the region uses to evaluate individual transit routes. These performance measures are subsidy per passenger and passengers per in-service hour. A state statute also requires the Met Council to document route performance for farebox recovery ratio in the Comprehensive Transit Financial Report.
These measures may differ from those developed to inform the Transportation Policy Plan on the performance of the overall transit system, which are discussed in the Performance Outcomes chapter. Individual transit providers also apply their own system and route performance measures to manage outcomes based on their service performance goals.
The document also provides guidance on land use and urban design practices that support transit operations and ridership. This section of the guidelines is intended to assist local agencies when they are conducting planning from community comprehensive plans and zoning to corridor studies to individual facility design.
The Met Council and regional transit providers also coordinate with MnDOT and transit services that connect beyond the seven-county metropolitan region on a case-by-case basis. The transit market areas do not address these kinds of services.
The following topics are covered in the Regional Transit Design and Performance Guidelines:
- Transit market areas
- Transit market index methodology
- Transit market area characteristics
- Transit market areas typical service and key prioritization factors
- Access to destinations
- Equity
- Network design
- Stop spacing – the distance between bus stops on a route
- Route spacing – the distance between bus routes
- Service levels
- Service span – the number of hours per day and days per week a transit service operates
- Service frequency – the average time between transit trips on a route
- Facility site selection and design
- Customer facility features – features at customer facilities that improve the customer experience
- Performance
- Productivity – passengers per in-service hour
- Cost effectiveness – the subsidy required to operate a route, per passenger
Transit provider service planning
Individual transit providers periodically conduct analysis and planning to identify where changes are needed in their transit services. This can range in scale from monitoring route performance and making minor adjustments, to conducting system-wide planning efforts with the intent of major strategic service restructuring. Each service provider uses their own strategic goals and metrics to inform this decision making, in addition to the regional goals in the Transportation Policy Plan and Regional Design and Performance Guidelines.
Regional transit providers should update their service improvement plans at least every five years. The plans can take a variety of forms, ranging from a lengthy list of service improvement concepts to a set of focused changes to meet near-term needs. Ideally, the plans will identify priorities for service expansion in each provider’s service area for at least the next two to five years. Providers should also consult with local governments, businesses, the public, including historically underrepresented groups, and other stakeholders in their service area to get a variety of inputs into transit service planning.
Transit service providers should also coordinate with each other particularly for routes or services that cross operating territories or provide connections to other transit provider services. Customer experience around transfer timing, wayfinding, and information should feel seamless when using services from multiple transit providers. Providers should also coordinate with local agencies for service planning, capital planning, and project construction.
Providers are also encouraged to explore new service delivery models and markets, as funding allows, and share feedback and best practices with all providers in the region.
Transit asset management plans
Transit asset management is a federally mandated methodology used to inform financial planning and maintenance decisions surrounding all transit assets. The transit asset management rule (49 CFR part 625) is a set of federal regulations that sets out minimum asset management practices for transit providers in accordance with MAP-21. The purpose of the FTA rulemaking is to help achieve and maintain a state of good repair for the nation’s public transportation assets.
Local agency plans
Cities and counties also conduct planning relating to transit. The primary example is the comprehensive plans that cities update every 10 years, and those plans must align with the Met Council’s regional development guide, including the Transportation Policy Plan, per state law. City comprehensive plans cover many factors that affect how successful transit will be such as land use, urban design, and local transportation networks (for example streets, and sidewalks). Cities and counties should refer to the Regional Transit Design and Performance Guidelines and the Met Council’s Local Planning Assistance team for guidance on planning for transit supportive communities.
Local agencies also work on planning and implementation for particular transit projects or corridors. Counties are often the lead planning agencies in the early stages of transitway development. Cities also conduct planning for transit projects. For example, the City of Saint Paul conducted a Streetcar Feasibility Study and the City of Minneapolis is working with Metro Transit on planning and implementing bus-only lanes at key locations within the community.
Cities and counties should collaborate with transit providers and the Met Council on their planning efforts around transit investments and service. The Met Council and regional transit providers should consider local plans and coordinate with local agencies when conducting transit planning.
State agency plans
The Minnesota Department of Transportation is responsible for managing state-level transportation systems such as the interstate highway system and produces multiple plans that affect the region. Minnesota GO, the State Multimodal Transportation Plan, is MnDOT’s highest level plan. The objectives, performance measures, strategies, and actions in the State Multimodal Transportation Plan set policy direction for MnDOT’s modal and system plans. This set of plans includes aviation, bicycle, freight, highway, pedestrian, ports and waterways, rail and transit. These plans direct state investments, maintenance, operations, modal programs, and services for all types of transportation throughout the state. Met Council participates in the planning processes and coordinates with MnDOT on all state plans that affect the region. MnDOT also conducts corridor studies affecting transit within region with the involvement of Met Council such as the Rethinking I-94 study.
Regular-route bus service
Regular-route bus service will continue to be a fundamental part of the regional transit system. Regular-route bus service provides access to the transit system for a large proportion of the urbanized area and essential connections to the region’s growing network of transitways. Regular-route bus investments service includes the following route types:
- Local bus routes
- Core local bus – Core local bus routes provide frequent transit service throughout the peak period (15- to 30-minute headways) and operate during peak periods as well as into the midday and evenings. These routes typically serve the denser urban areas of Transit Market Areas I and II and provide access to downtown or major activity centers along important commercial corridors. They are some of the highest ridership routes in the system. The most productive core local routes are often future arterial BRT candidates.
- Supporting local bus – Supporting local bus routes are designed to provide crosstown connections within Transit Market Areas I and II. Typically, these routes do not serve a downtown area but provide important connections between core local routes and more direct access between urban neighborhoods than core local bus service would provide alone.
- Suburban local bus – Suburban local routes typically operate in Transit Market Areas II and III and serve an important role in providing basic transit coverage throughout the region. This includes suburb-to-suburb connections and linking urban and suburban communities. Provider-specific variations on suburban local bus service include community routes and feeder routes.
- Commuter and express bus routes
Commuter and express bus routes mostly operate during peak periods, serving commuters going to either downtown, the University of Minnesota campus, or to a major employment center. These routes typically operate on highways for portions of the route between picking up passengers at a few stops in residential areas or park-and-ride facilities. They perform best when they serve compact areas without free and/or plentiful parking, and when transit travel times are competitive with driving alone (and parking and walking to your destination). As of 2023, fewer riders are taking commuter transit, especially on Mondays and Fridays, due to expanded teleworking by office workers after the pandemic.
What guides decision making for regular-route bus service?
Decision making in regular-route bus service is primarily done by the region’s transit service providers. However, their planning is guided regionally by policies developed collaboratively with the Met Council. The Regional Transit Service Design and Performance Guidelines is the main document used to provide a baseline for regular-route bus service levels and typical design elements across the region. Other key inputs transit providers should use to guide decision making include current route performance, feedback from stakeholder and public engagement, and coordination with other service providers.
Understanding an area’s travel patterns and transit needs and how they are changing over time is also important. Regular-route bus service planning typically considers the underlying factors that are the basis for Transit Market Areas as well as market-specific factors such as equity, community feedback, the location of unique transit demand generators like education centers or job or activity centers, roadway congestion, parking availability and cost, and geographic balance. Transit providers may value these factors differently, depending on their local needs and priorities.
The region has been investing in regular-route bus service expansion for decades through Regional Solicitation grants. From the early 1990s through the late 2000s, most of these expansion grants were oriented to suburban markets and express bus services. In recent years, these expansions have been less focused on reducing vehicles miles traveled on long-distance, single-occupant vehicle trips and instead oriented toward shorter trips on local services and new service types like microtransit or bus rapid transit. The Regional Solicitation has had a transit expansion investment category for the last 10 years that has placed a high evaluation weight on attracting new transit riders to the system.
As the region conducts the Regional Solicitation evaluation work program item, an emphasis should be placed on evaluation criterion that are developed collaboratively with regional transit providers to reflect the needs of all providers but also best address the 2050 Transportation Policy Plan goals and objectives. A similar emphasis should be placed on any other funding programs that distribute regionally (or state) shared resources to regular-route bus service expansion.
Regular-route bus service investments included in the plan
Investments in regular-route bus service funded in the plan include:
- Continued operation, monitoring, and adjustment of regular-route bus services at the level of service in October 2023
- Investments in regular-route bus service that bring total service hours in the region to pre-COVID-19 pandemic levels by 2025
- Additional regular-route bus service expansion
The Met Council expects the Regional Solicitation and expanded local transit revenues will create enough capacity to expand the regular-route bus system some, based on transit provider and regional planning. The exact amount of expansion is yet to be determined as the need must be weighed against other investment opportunities.
The COVID-19 pandemic and unprecedented workforce shortages have resulted in significant changes and reductions to the regional transit network since 2020. A number of efforts have identified where travel markets and transit demand has changed and where the most promising near-term opportunities are for service restructuring, restoration, and expansion. For example, Metro Transit’s Network Now work has identified and prioritized how service changes will be implemented as workforce and other resources allow. Guiding principles, such as preparing for new METRO system services planned to open by 2027, building on previous ridership success by adding service where people use transit the most, adapting service to reflect market changes, and focusing on advancing regional equity by providing improved access to opportunities and services, have helped evaluate options and prioritize service changes.
Similarly, MVTA and SouthWest Transit conducted a joint review of unmet needs and service change scenarios, resulting in a strategic vision for their service areas that is responsive to local needs and the shift in transit demands resulting from the pandemic. Transitway corridor planning has also been a substantial source of regular-route bus service planning to identify important connecting bus service improvements that are coordinated with transitway expansions.
Regardless of the source of funding or investment purpose, regular-route bus service expansion typically will come in one or a combination of the following forms:
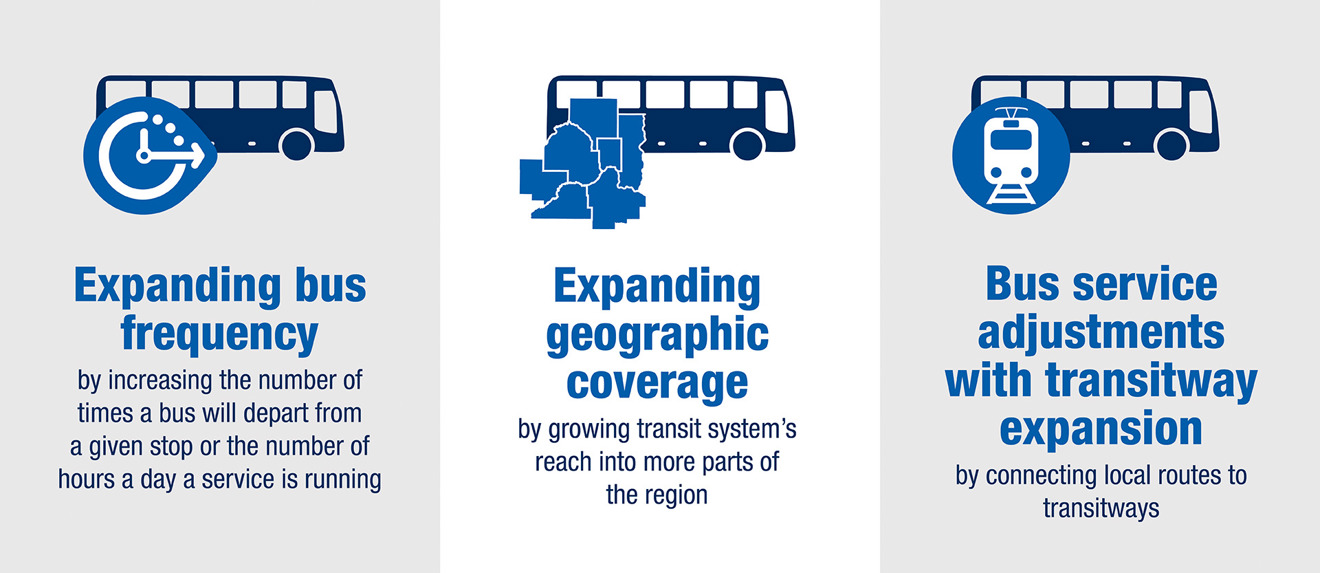
- Expanding frequency and span of service – Transit providers may improve existing routes by operating more trips, meaning a bus will depart from a given stop more often, and/or increasing the number of hours a day that service is running, for example, later into the night or earlier in the morning. Either of these will increase the total number of service hours needed to operate a route. These improvements are often in response to growing demand on a route, which can result in crowded buses or delays during the busiest times. They also provide new opportunities that otherwise wouldn’t be possible, like access to late shift jobs or weekend destinations.
The region has invested in a high-frequency transit network over the past few decades that provides more routes that people can easily use without needing to rely on a schedule. High-frequency bus routes are good locations to target high-density urban development. Local governments are encouraged to work with regional transit providers to identify potential high-frequency corridors. A local example is the work Minneapolis has undertaken in their Transportation Action Plan, which identifies transit priority projects in the city. - Expanding geographic coverage – Expanding geographic coverage means growing the transit system’s reach into more parts of the region. This is done with either new transit routes or extending existing routes. Transit providers often test expanded coverage with a basic level of service first, meaning 30- to 60- minute frequency. Once the new area demonstrates enough demand, service frequency and span can be added. Expanded coverage is often done to serve an emerging activity center of jobs and destinations or an area experiencing several high-density residential developments. Geographic coverage expansion also has cost implications for operating ADA paratransit, which must provide guaranteed service within three-quarters of a mile of regular-route service according to federal requirements.
The state also requires the Met Council to provide paratransit service within the Transit Capital Levy District, but these requirements are less stringent than federal requirements and so do not have the same cost implications.102 Transit providers should consult with Metro Mobility when considering geographic coverage expansions. While regular-route bus is one tool to provide expanded coverage, the region also uses other options for this purpose, such as microtransit. As local governments plan for land use, they should identify areas where there may be viable opportunities for expanded coverage and explore them with regional transit providers. - Bus service adjustments with transitway expansion – Transitways provide valuable fast, high-capacity connections in the transit system. Connecting local routes to these services extends riders’ overall reach via transit and thus increases the places they can access. When transitway projects are being planned, connecting bus routes or parallel/overlapping routes are reviewed and potentially modified or replaced. Factors such as station spacing, where people get on and off transit currently, and sociodemographic needs inform this decision-making process. Transitway development processes will engage the public in planning for the entire corridor, including the related bus system, but transit providers may also do their own specific engagement as the transitway project gets closer to opening.
Figure 8.13: Regular-route bus service investments
Regular-route bus service planning is an ongoing process for regional transit providers and the details of this work are left up to them. Because high-frequency transit service is an essential tool for planning high-density development, this plan includes a map of potential high-frequency corridors to aid cities in land use planning. These corridors are neither a commitment to a future service level nor the only corridors that could warrant such an investment, especially as the region grows and changes over time.
Identifying opportunities for bus service improvements is a collaborative process that should involve transit providers, local governments, riders, members of historically underserved and disadvantaged communities, residents, and businesses. Regular-route bus service is a continuum that progresses up in frequency and span as demand warrants, as shown in Figure 8.14. It is not recommended nor good practice to implement a high level of service to test a new market.
Figure 8.14: Transit route progression
![]()
Regular-route bus service investment opportunities beyond the current plan
Additional specific regular-route bus service improvements are not identified in the plan, including which applications to make to the Regional Solicitation, because this is a process left to regional transit providers. Investments in service improvements are scalable and it is important for transit providers to plan for additional improvements beyond what is currently forecastable in revenue.
Transitways
A robust and interconnected network of transitways is and will be the foundational element of the regional transit system, both in terms of use and investments. Transitway investments are permanent and long-range. They require diligent planning to best serve the existing developed region and help guide future development in the region. This permanence also plays a strong role in the ability of transitways to focus future growth and act as a catalyst for development in the region. Transitways present opportunities to advance community visions for investment and economic development, using strategies that support equitable development, community wealth-building, and address market pressures that can lead to displacement.
The region will consider the following modes while developing a network of transitways:
- Bus rapid transit
- Light rail
- Modern streetcar
- Commuter rail
Each mode has unique characteristics that must be matched to an appropriate purpose and need to provide cost-effective service. Transitways are also supported by the regular-route bus service as described in the previous section, and nonfixed-route transit services like microtransit. It is important for the region to include connecting services in transitway planning and investment scenarios.
No other modes are currently being explored for transitway development in the region. However, if other modes are recommended for investment through detailed studies, like local corridor planning studies, their inclusion in the plan would require an amendment.
The priority for investing in the region’s transitway system is continuing to operate and maintain the existing transitways, shown in Figure 8.7. Beyond ongoing operations and maintenance, these corridors may require modernization or modest expansion improvements that address operational issues, unmet demand, or other unique challenges. This may include additional stations that will be identified through Transportation Policy Plan amendments, as needed. The region has also identified several new transitways for investment within this plan.
Transitway modes
Bus rapid transit
Bus rapid transit (BRT) provides frequent transit service throughout the day103 that uses buses while incorporating many of the attractive characteristics of rail transitways. All bus rapid transit types are part of the METRO system. Highway and dedicated BRT lines receive color designations while arterial BRT lines are identified by letters. METRO bus rapid transit ridership stayed strong during the pandemic and is recovering faster than other service types, reflecting a rising demand for all-day, all-purpose service. BRT ridership increased 120% (4 million rides) in 2023 compared to 2022. Metro Transit began operating METRO D Line arterial BRT, which replaced Route 5 and is now the busiest bus route in the state, and accounts for much of this growth. Ridership on other BRT routes grew solidly in 2023, increasing 11% compared to 2022.
Bus rapid transit is generally more adaptable than rail to the unique conditions of a corridor. BRT facilities can more easily be added or expanded, as needed, over time. Since BRT is flexible, corridors may be implemented in a way that is a combination of BRT types.
The region is planning for three types of bus rapid transit that are flexible to adapt to different corridor contexts:
- Arterial bus rapid transit is focused on providing fast, frequent, and more reliable service with a better customer experience on corridors with strong demand for existing local bus service. These corridors are in highly developed areas of the region where available right-of-way limits the ability to implement facilities for light rail or dedicated BRT. Arterial BRT generally operates in mixed traffic on local streets with stations spaced half a mile apart. Arterial BRT can also use transit advantages such as on-street bus lanes and transit signal priority. Customer amenities include improved stations and customer information, unique vehicles and branding, and off-board fare collection that reduces vehicle stopping time. The METRO A Line and C Line were the first two arterial BRT lines in the region.
- Highway bus rapid transit connects regional centers near highways and facilitates longer-distance travel with fewer stops. Highway BRT stations are spaced about one to two miles apart and lines generally operate where buses can use transit advantages like bus-only shoulders, managed lanes, and ramp meter bypasses. Highway BRT service is often complemented with express bus service that uses the same facilities and coordinates with local bus connections. Otherwise, highway BRT is similar to other types of bus rapid transit and light rail in terms of frequency, fare collection, technology, and customer information. The METRO Red Line on Cedar Avenue and Minnesota Highway 77 and the METRO Orange Line on I-35W south are currently in operation.
- Dedicated bus rapid transit uses special roadways or lanes used exclusively by the buses for most of the route. Dedicated BRT is often considered the most like light rail based on how it operates and the level of investment. Dedicated BRT has more flexibility than light rail because the dedicated guideway and stations can be shared with other services, such as express or local bus. Buses can also operate in short segments of mixed traffic where space is too limited to build a dedicated guideway. The METRO Gold Line will be the first dedicated BRT transitway in operation in the region.
In many cases, elements of these projects can be implemented prior to the complete bus rapid transit investment (for example, limited stop bus service or enhanced bus shelters). Bus rapid transit projects require substantial coordination with a local or the state roadway authority, sometimes even combining roadway investments with the transitway investment.
Light rail transit
Light rail transit is all-day, frequent service that connects dense employment and population centers with each other and operates on rail tracks primarily in exclusive runningway. The vehicles are powered by overhead electrical wires. Stations are typically spaced about a half to one mile apart. Typical light rail lines in this region extend 10 to 15 miles out from the urban core and primarily serve the most densely developed areas of the region. Light rail service operates in both directions at a high frequency. All light rail lines are part of the METRO system and given color designations for customer information purposes. The initial segments of the METRO Blue Line and Green Line are operating, with the Green Line extension under construction and the Blue Line extension in planning.
Modern streetcars
Modern streetcar is an all-day service that emphasizes high frequency and high accessibility in urban areas with high transit demand. Modern streetcars typically operate in mixed traffic, similar to a local bus route or some bus rapid transit routes but may have an exclusive runningway for part or all of the route. They typically stop every few blocks (1/4-1/2 mile), travel at slower speeds, and their overall route length is usually shorter than light rail lines.
Modern streetcars may attract new transit riders similar to, though not to the same extent, as light rail, and offer some advantages over local buses such as faster boarding, faster fare collection, and intersection signal priority – similar to the transportation benefits bus rapid transit can offer. Many streetcar lines are also constructed with the intent of spurring economic development along the line conferred from the visibility and permanence of streetcar infrastructure. Modern streetcar service is particularly suitable for high-density, mixed-use areas with limited right-of-way and short average passenger trip lengths like downtowns or dense urban corridors. These are typically areas where improved transit will benefit a high number of existing riders and the streetcar may serve as an attraction for new or infrequent transit users like shoppers or visitors.
Commuter rail
Commuter rail is an express service that connects downtown employment centers to distant population centers or ridership aggregators such as park-and-ride facilities and transit centers. Commuter rail typically operates on existing freight railroad tracks to reduce infrastructure costs. Commuter rail vehicles used in the region are either diesel multiple-unit vehicles or conventional diesel locomotives pulling passenger coaches.104 In many cases, commuter rail operates on tracks that also carry intercity passenger rail traffic operated by Amtrak or other passenger rail services, potentially sharing common stations. Lines are typically 20 miles in length or more, with stations spaced much further apart than other modes, usually about five miles apart or more. This spacing results in faster travel times that are competitive with auto travel. Station areas are primarily oriented to park-and-ride uses or dense housing and mixed-use development. The Northstar Line is the only commuter rail line in the transitway system and is not considered part of the METRO system of all-day, frequent transitway service.
Transitway Design Guidelines
The region previously developed Regional Transitway Guidelines that helped create a consistent definition for transitways across the various modes. These guidelines ultimately led to the creation of the METRO brand and basic assumptions for transitway characteristics to carry through from planning to operation. While the guidelines have not been substantially revisited since 2016, the essential elements have been carried through to this Transportation Policy Plan in the Regional Transit Design and Performance Guidelines.
The assumptions for dedicated bus rapid transit were brought into the guidelines as the region is actively building the METRO Gold Line and pursuing the METRO Purple Line. At this time, there are no specific design guidelines for modern streetcar. Table 8.2 summarizes key design characteristics for the different transitway modes. There can be exceptions to the design guidelines based on discussions with funding partners and performance.
Figure 8.2: Design guidelines for transitways
| Characteristic | Design Guidelines Guidelines apply to all modes unless listed individually |
| Frequency | 15-minute all-day |
| Span | 18 hours per day on weekdays |
| Typical station spacing |
Arterial BRT: 1/4 to 1/2 mile |
| Runningway | Arterial BRT: Full-sized, mixed-traffic travel lanes that provide transit advantages under congested conditions or in congested segments. Highway BRT: Full-sized, managed lanes or bus shoulders that provide travel time advantages under congested roadway conditions. Light rail and dedicated BRT: Dedicated runningway that can ensure safe and reliable operation for the majority of the line. |
| Vehicles | Bus rapid transit: Sleek, modern, appropriately sized and configured to service characteristics and rider comfort. Light rail: Rail vehicles compatible with existing rail and infrastructure systems. |
| Fare collection | Off-board fare collection with proof-of-payment enforcement that integrates with the regional fare system. |
| Identity and branding |
Arterial BRT: METRO branding with letter names for lines. |
Other modes
No other modes are currently being explored for transitway development in the region. However, if other modes were to be explored through further detailed studies, like local corridor planning studies, their inclusion in the plan would require an amendment.
What guides decision making for transitways
There are several different processes that guide decision making in transitways:
- System planning
- Corridor planning
- Transitway Advancement Policy
- Project development and implementation
- Capital preservation and maintenance
Each process has its own considerations described below, but there are some overarching principles of transitway investment that have and will continue to guide all processes. Those principles are:
- Transitway investments should seek to maximize competitive federal funds and their associated prioritization criteria (for example, FTA Capital Investment Grants). This should be balanced with the project implementation timeline – using more local funding strategically may be warranted in some cases.
- Transitways are long-term investments that should consider current needs as well as future needs and the potential for investments to help guide land use plans.
- Transitways are implemented as regional partnerships between the transit provider, funding partners, local governments, and the communities they serve. All partners should be at the table during the development process.
It is expected that no matter who leads a transitway development process, these principles will apply.
Transitway system planning
In recent decades, the Met Council has taken the lead on system planning that considers the merits of multiple corridors across the region. System planning is an important step in identifying future corridors that show potential for transitway investment for more in-depth corridor analysis. System planning is usually done with high-level analysis of basic factors of cost, risk, and contributions to regional goals and objectives. The most common evaluation metrics during this stage are transit market (ridership or similar), land use potential and plans, and equity. Corridors are compared to each other in relative terms and not with the precision required to evaluate merits against funding programs like FTA Capital Investment Grants. Stakeholder engagement in system planning includes transit providers, local governments, MnDOT, and corridor coalition, as applicable. There may be some engagement with regional businesses and residents, but the high-level nature of this process is not intended for extensive corridor-level engagement.
System planning typically includes corridors that have been decided on with the relevant stakeholders, depending on the nature of the study. For example, arterial bus rapid transit system studies start with corridors that already have high-performing local bus routes. Highway bus rapid transit studies start with corridors that are high-performing express bus corridors and have planned highway improvements.
The region has undergone a number of system studies in the last 30 years that have provided the background and direction to the transitway investment plan that is reflected here including:
- Transit Master Study (2008)
- Arterial Transitway Corridors Study (2012)
- Highway Transitway Corridors Study (2014)
- Network Next Arterial Bus Rapid Transit Plan (2021)
This plan includes an updated evaluation of the long-range vision for arterial BRT as part Metro Transit’s service improvement planning efforts, which are described in more detail in the Work Program. The Met Council also intends to update the regional transit vision by working with partners to consider if and how new corridors, modes, or other major transitway system investments might serve the region's needs and goals. System planning can be incorporated into the Transportation Policy Plan through amendments or as part of major plan updates every five years.
Transitway corridor planning
Local governments or transit agencies carry out transitway planning focused on a single corridor to determine if a transitway is viable on the corridor and what type of service is preferred. Agencies analyze multiple alternatives in detail to determine viability, the type of transit service, and a preferred alignment and stations. Lead agencies analyze each alternative’s costs and merits against the project purpose and need statement and a set of goals and objectives agreed upon by corridor stakeholders that participate in a policy advisory committee (or a similar group).
Lead agencies should engage, coordinate, and cooperate with partner agencies along the corridor being studied starting early in the process to ensure local support and alignment with other upcoming transportation infrastructure projects. This should include coordinating the timing of transit and non-transit projects. Corridor plans should align with the Transportation Policy Plan goals and objectives, though some flexibility to address local needs and concerns is expected.
Counties, transit agencies have historically been lead local agencies for transitway planning
Counties have historically played a lead role in corridor planning for dedicated and highway BRT, modern streetcar, light rail, and commuter rail transitway projects within the region. Building on prior regional system planning, counties identify their transit investment priorities for two to four years through regular budgeting processes resulting in their operating budgets and capital improvement programs. Longer-term priorities and visions for transit investment are outlined in county comprehensive plans. Counties fund this early route and mode planning and environmental review work and provide the local match funding to federal grants for engineering and construction.
Transit agencies, on the other hand, have funded and led planning for arterial bus rapid transit projects. To date Metro Transit has been the lead agency for corridor planning on all arterial BRT routes that have been implemented.
Other agencies are not precluded from leading transitway corridor planning. Minneapolis, Saint Paul, MVTA, MnDOT, and Bloomington have or will lead corridor planning.
Transitway planning requires robust public engagement involving affected communities
The project stakeholder and community engagement efforts during corridor planning are more robust than system planning because of the localized nature of the process. All potential affected federal, state, local, and Tribal governments should participate in the process along with residents, businesses, and other unique perspectives specific to the corridor. The corridor-planning process considers land use plans from local governments as both an important input as well as an opportunity analysis for future potential. These studies may even evaluate transit-oriented development potential through scenarios beyond what is assumed in plans.
Transitway corridor-planning processes must include a corridor policy advisory committee made up of local officials from affected communities and partner agencies. This group provides input to project staff and ultimately votes on whether to recommend a locally preferred alternative.
The approval process for transitway corridor plans has multiple steps
The result of corridor planning is the identification of a locally preferred alternative that includes the type of transitway, alignment, and station locations, unless no alternatives are believed to meet the project purpose, need, goals, and objectives. The corridor policy advisory committee makes a recommendation for final approval to the originating local planning agency that initiated the corridor plan. Corridor recommendations are then considered for inclusion in the Transportation Policy Plan based on the Transitway Advancement Policy, usually through a Transportation Policy Plan amendment. In some cases, corridor planning has resulted in no specific transitway recommendation, but rather interim steps to build corridor demand over time and a commitment to revisit the analysis later. This approach is usually best for corridors that do not have much established transit service to evaluate yet. Under federal law, a corridor does not have a locally preferred alternative until it is adopted into the Transportation Policy Plan.
Figure 8.15: Transitway development process
![]()
Capital investment grant competitiveness is a key factor for transitway viability
This is also the stage where competitiveness for FTA Capital Investment Grants or other competitive grant criteria are weighed during the selection process. The Capital Investment Grant criteria are often a major driving factor in decision making at the corridor level because of the large competitive grant funds associated with the program. Capital Investment Grant criteria are split into two categories – project justification and local financial commitment – as shown in Figure 8.16. For corridors where Capital Investment Grant funding is not being sought, similar criteria may be applied as determined by the corridor-planning process.
Figure 8.16: FTA Capital Investment Grants evaluation criteria

Transitway Advancement Policy
To aid the Met Council’s consideration to adopt or amend a project in the Transportation Policy Plan, it is the region’s policy that the following information is required from each transitway’s originating local planning agency:
- Documentation of transitway type, alignment and station locations and the selection process. Originating local planning agencies will have to provide the preferred transitway type, alignments, station locations, and documentation of the process for selecting them. The documentation should include an evaluation of project alignment with the Transportation Policy Plan goals and objectives, usually based on the project’s purpose and need, and goals and objectives. Documentation of these evaluations and the project’s processes is typically found in locally preferred alternative reports, corridor plans, and/or station area plans. Station locations can shift some without amending the Transportation Policy Plan, but adding or removing any planned stations requires a plan amendment and proper documentation.
- Resolutions of support from relevant government bodies and agencies. Originating local planning agencies must obtain resolutions of support for the locally preferred alternative from cities, counties, and government agencies that are directly impacted by the proposed transitway and provide them to the Met Council before a transitway can be adopted into or amended in the Transportation Policy Plan. “Directly impacted” includes stations or alignments passing through a community or using or altering another entity’s infrastructure. This is similar to, but not the same as, municipal consent, which has an approval process required under Minnesota State Statute 473.3994105 for light rail projects specifically.
- Documentation of fiscal constraint. Originating local planning agencies will provide documentation of planned capital, operating, and lifecycle costs, as well as revenues for the transitway and assumptions of funding commitments for the construction, maintenance, and operation for the proposed project through the horizon of this plan (2050).
- Documentation of public engagement and feedback. Originating local planning agencies are required to provide documentation of the public engagement efforts involved in each phase of the transitway project development process and provide the feedback that resulted from those efforts. Documentation of public engagement can be provided in the form of a public engagement report or excerpts from alignment and/or station location selection reports. This summary is typically included in a locally preferred alternative report.
This information is necessary for the Met Council to assist in evaluating the project against the Transportation Policy Plan goals, objectives, policies, and actions and to ensure the plan maintains fiscal constraint through the lifecycle of existing and new transitway assets. Met Council staff will work with originating local planning agencies to obtain and summarize project information for the purposes of this review. This review will occur when new or amended projects are considered for adoption into the Transportation Policy Plan.
Metro Transit typically partners with originating local planning agencies in developing, implementing, operating and maintaining transitways within the region. For projects initiated by local sponsors, if Metro Transit is the intended project developer and operator, Metro Transit will lead coordination with local project sponsors during the planning phase to inform sponsor-led activities. If another transit agency is the planned operator of a transitway, early coordination and ongoing planning are expected to ensure operations and maintenance for the project’s lifecycle are considered through the project’s planning.
Project development and implementation
After a locally preferred alternative is identified, the project begins development including environmental review, and design and engineering. During these phases, additional changes to the project may occur as designs become more detailed or environmental work identifies concerns. Any substantial changes during these phases, such as adding or removing stations or substantial alignment changes, will require a Transportation Policy Plan amendment. The Met Council is currently the lead agency for light rail development under state law, but bus rapid transit can and has had different lead agencies for project development.
Project construction should consider the impacts on travel, local businesses and residents, and the environment to ensure that the project is least disruptive as possible. Transitway projects typically have a system testing phase before beginning operations. Construction timelines should also be coordinated with partner agency projects including cities, counties, and MnDOT.
Capital preservation and maintenance
Once transitways are in operation, those assets must be maintained in a state of good repair to provide safe, reliable, and comfortable service. Investments can include vehicle overhauls and replacements, customer facility investments and refurbishments, and modernization of infrastructure like track, guideway, structures, and signals. Transit providers are responsible for these costs and identify capital needs through condition assessments, inspections, operational experience, and policy guidance. These needs are vetted and prioritized as they move through agency capital budgeting processes.
Transitway investments included in the current plan
This plan includes major investments in transitways that are described in more detail below. Transitways are regionally significant projects in which any expansion of the system must be included in the Transportation Policy Plan, regardless of the source of funding. At a high level, the major investments in this plan include:
- An extension of each light rail line – the METRO Green Line and METRO Blue Line
- Two dedicated bus rapid transit expansions – the METRO Gold Line and METRO Purple Line
- Five arterial bus rapid transit expansions – the B Line, E Line, F Line, G Line, and H Line
All projects included in the plan have a locally preferred alternative and an accepted funding plan. These projects are advancing through project development phases, such as environmental clearances, design and engineering, or construction, with a tentative opening date planned. Two of the projects, METRO Blue Line extension and METRO Purple Line, are considering major revisions to their adopted locally preferred alternative (details in status updates below). Updated recommendations from these projects are expected to be amended into the Transportation Policy Plan in 2025. The expansion investments are shown on Figure 8.17.
Figure 8.17: Map of transitway expansion investments
![]()
Project status updates
METRO Green Line Extension – This 14.5-mile extension of the METRO Green Line will connect Eden Prairie, Minnetonka, Hopkins, and St. Louis Park with Minneapolis and Saint Paul along the existing Green Line. The Met Council adopted the project’s locally preferred alternative in May 2010, which is the Kenilworth-Opus-Golden Triangle (3A) light rail alignment.106 During the project development phase, the terminus was revised to SouthWest Station, eliminating the Mitchell Road Station from the project. The project started heavy construction in 2019 and received a full funding grant agreement in September 2020. As of early 2024, the project is under construction with an anticipated opening date in 2027.
METRO Blue Line Extension – This 13.5-mile extension of the METRO Blue Line will connect Brooklyn Park, Crystal, Robbinsdale, and Golden Valley with Minneapolis and the other existing Blue Line communities. The project’s locally preferred alternative was adopted as the West Broadway– Burlington Northern Santa Fe Corridor – Olson Memorial Highway (B-C-D1) light rail alignment in May 2013. The project is in engineering and anticipates requesting a full-funding grant agreement when this phase is complete. As of early 2024, due to the inability to secure colocation rights on the Burlington Northern Santa Fe right-of-way, Hennepin County and the Met Council have identified an alternative alignment for an updated locally preferred alternative that is expected to be addressed through a Transportation Policy Plan amendment in 2025.
METRO Gold Line Dedicated BRT – This project will connect Saint Paul, Maplewood, Landfall, Oakdale, and Woodbury. This project’s locally preferred alternative was adopted as dedicated BRT generally on Hudson Road – described as Hudson Boulevard (A-B-C-D3) alignment in the locally preferred alternative report – that crosses to the south side of I-94 at approximately Bielenberg Drive terminating along Guider Drive between Queens Drive and Woodlane Drive. The project received a full funding grant agreement in early 2023 and is currently under construction with a planned opening date in March 2025.
METRO Purple Line Dedicated BRT – This project will connect Saint Paul and Maplewood to the rest of the METRO system. The project’s locally preferred alternative is dedicated BRT generally from Union Depot along Phalen Boulevard, Ramsey County Regional Railroad Authority property (adjacent to Bruce Vento Trail) to Beam Avenue and the Maplewood Mall Transit Center. As initially envisioned, the METRO Purple Line BRT was a 15-mile line between Union Depot in downtown Saint Paul and downtown White Bear Lake generally along Robert Street, Jackson Street, Phalen Boulevard, Ramsey County rail right of way co-located with the Bruce Vento Regional Trail and Highway 61.
In spring 2022, the Purple Line began a Route Modification Study to evaluate a new northern terminus north of Beam Avenue to either end the line at Maplewood Mall Transit Center, I-35E & County Rd. E park-and-ride in Vadnais Heights, or Century College on the border of White Bear Lake and Mahtomedi. An ending at Maplewood Mall Transit Center proved to be the only option that would qualify for federal funds. The project is in project development and is exploring options that do not utilize the Ramsey County Regional Railroad Authority property and instead route onto Maryland and White Bear Avenue. An updated locally preferred alternative is expected to be addressed through a Transportation Policy Plan amendment in 2025.
METRO B Line Arterial BRT – The METRO B Line is a planned arterial BRT line that will provide faster and more reliable transit service in the Route 21 corridor along Lake Street, Marshall Avenue, and Selby Avenue. The B Line is currently under construction and anticipated to open for service in June 2025. The B Line Corridor Plan was adopted by the Met Council in October 2021.
METRO E Line Arterial BRT – The METRO E Line is a planned BRT line that will provide faster and more reliable transit service in the Route 6 corridor along University Avenue/4th Street, Hennepin Avenue, and France Avenue from the University of Minnesota to Southdale. E Line design was finalized in 2023, with service expected to open in December 2025. The Met Council adopted the E Line Corridor Plan in June 2022.
METRO F Line Arterial BRT – The METRO F Line is a planned arterial BRT line that will provide faster and more reliable transit service in the Route 10 corridor between downtown Minneapolis and Northtown Transit Center along Nicollet Mall, Central Avenue, and University Avenue. F Line design is currently underway. The F Line Corridor Plan was adopted in August 2023.
METRO G Line Arterial BRT – The METRO G Line is a planned arterial BRT line that will provide faster and more reliable service in the Route 62 and Route 68 corridor from Little Canada to the Dakota County Northern Service Center via Rice Street, downtown Saint Paul, and Robert Street. G Line planning is currently underway, the corridor plan is anticipated to be adopted in summer 2024.
METRO H Line Arterial BRT – The METRO H Line is a planned arterial BRT line that will provide faster and more reliable transit service in the Como/Maryland corridor partially served by Route 3. It will travel between downtown Minneapolis and Sun Ray Transit Center on the east side of St. Paul. Preliminary planning for the H Line is currently underway, the corridor plan is anticipated to be adopted in 2026.
Transitway system investment opportunities beyond the current plan
There are opportunities for transitway investments beyond the projects included in this plan. These corridors have undergone or will undergo a corridor study to determine the type of investment and identify what is needed to begin moving the project through the Transitway Advancement Policy process. In most cases, the project funding plan is not yet complete. At a high level, the region has identified the following transitway investments opportunities beyond the current plan:
- Seven additional arterial bus rapid transit candidate corridors were identified through Network Next in 2021. These corridors will be evaluated in a Work Program item in 2025.
- Six corridors, considering various modes, are currently under study or soon to be under study.
- Six corridors were studied previously but follow-up work is anticipated in the next five years.
Local governments along these corridors should conduct land use studies and planning to maximize transitway potential while recognizing they are still in the planning phases. These projects still provide an opportunity to align transportation decisions with the land use visions of local communities.
Project status updates
Arterial bus rapid transit – Metro Transit’s Network Next project identified priority arterial bus rapid transit corridors through the METRO H Line, as well as seven future candidate corridors. These candidate corridors will be evaluated along with other potential candidates during the arterial bus rapid transit plan update in 2025. That process will identify at least the next three programmed corridors and any revised candidate corridors for future consideration. The recommendations from this process will be included in a future amendment or update of the Transportation Policy Plan. The seven 2040 candidate corridors previously adopted by the Met Council include:
- 63rd / Zane
- Grand Ave
- Johnson Ave / Lyndale Ave
- Lowry Ave
- Nicollet Ave
- Randolph St / East 7th St
- West Broadway Ave / Cedar Ave
West 7th Corridor – This project will connect downtown and the West 7th Street neighborhood in Saint Paul with the Minneapolis-Saint Paul International Airport and the Mall of America/South Loop in Bloomington. The locally preferred alternative was initially approved as a modern streetcar alignment in a mix of dedicated and shared-use guideway from Union Depot to the Mall of America generally along West 7th Street and crossing the river at Highway 5. In September 2024 the lead agency announced they would be stopping work on the project based on feedback gained during a comprehensive public engagement process.
The region is committed to planning for a transitway investment of some type on this well-used transit corridor within the timeline of this plan, specifics of which will be identified by future planning work. Bus frequency improvements implemented late 2024 may serve as a basis for further bus improvements in the future including potential bus rapid transit.
Highway 169 Highway BRT – This project would connect communities in northern Scott County to cities along Highway 169 in Hennepin County and along Highway 55 into downtown Minneapolis. The Highway 169 Mobility Study evaluated options for improving transit and reducing congestion on Highway 169 in the southwest metro, with a focus on highway bus rapid transit, a managed lane, and spot mobility improvements. In addition to the study of BRT, potential interim service improvements were identified, and highway improvements could provide improved transit advantages in the corridor for existing and planned transit. In 2023, the state provided a $3 million appropriation for additional work on this corridor and Highway 55 bus rapid transit.
Highway 55 Highway BRT – This project would connect Plymouth and Golden Valley with Minneapolis along Highway 55 in the west metro. This project was evaluated as a supplement to the Highway Transitway Corridor Study in 2015. Subsequently, additional funding has been provided by the state to explore this corridor further, though the initial kick-off of the study was put on hold due to the COVID-19 pandemic. In 2023, the state provided an additional $3 million appropriation for work on this corridor and Highway 169 bus rapid transit. An expanded limited-stop bus service is planned for this corridor in 2026 funded with a Regional Solicitation award.
METRO Orange Line Extension – The first stage of METRO Orange Line opened in 2021 as highway BRT service from Minneapolis to Burnsville on I-35W. The Metro Orange Line Extension Study (2018) defined the key components of a potential future extension of service south further to Burnsville Center. The study identified preferred station locations, route alignments, runningway operations and operating technologies needed for an extension. The recommendations are contingent on performance of the first stage of the METRO Orange Line and land use changes in the Burnsville Center Mall area. Dakota County will evaluate the need and timing of the extension prior to the next TPP update.
METRO Red Line Highway BRT future stages – The first stage of this project opened in mid-2013 and capital improvements in the second stage were largely completed by 2020. A Red Line Implementation Plan Update (2015) has identified additional future stages that will add stations, park-and-ride capacity, and service to the line, including an extension to a number of planned stations in Lakeville. The near-term priorities are infill stations at Palomino Drive and Cliff Road, with each station undergoing some planning activity recently or in the near future. Extension of the line further south is staged according to forecasted station boardings and cost effectiveness in the implementation plan update, but this will be examined in future updates as well. Future stages would also continue to address bicycle and pedestrian improvements and station area planning, continuing a theme from stage two of the implementation plan update.
Midtown Rail – This project would connect the existing METRO Blue Line Lake Street Station and planned METRO Green Line West Lake Station with neighborhoods in south Minneapolis. The transit study was completed in 2012 with a locally preferred alternative recommendation of rail in the Midtown Greenway combined with arterial BRT on Lake Street. The B Line arterial BRT is included in the plan and Hennepin County will take steps to further analyze rail in this corridor before the next Transportation Policy Plan update.
Red Rock Highway BRT – This project would connect Saint Paul to Newport, Saint Paul Park, Cottage Grove, and Hastings. An implementation plan was completed in 2016 that defined a long-term vision of highway BRT recommendations in the Highway 61 corridor. Initial stages include improved express bus service and all-day bus service introduction with ongoing monitoring of its performance. The Red Rock Corridor Commission gathered insights from employers, residents, and other stakeholders in 2023 to refresh the vision for this corridor, which was adopted in January 2024.
West Broadway Modern Streetcar – This project would connect the Minneapolis neighborhoods along West Broadway to downtown Minneapolis and Robbinsdale. The corridor study was completed in 2017 and recommended modern streetcar to North Memorial along with additional improvements to bus service in the corridor. In the City of Minneapolis’ Transportation Action Plan, the city is committed to partnering with Metro Transit and other agencies to plan, design, and construct high-capacity, neighborhood-based transit along the West Broadway corridor. This project may be impacted by ongoing planning for the Blue Line Extension, which is looking at West Broadway as a possible updated alignment. The future of this transitway study will be incorporated with an amendment that addresses Blue Line Extension.
I-35W north – This corridor links downtown Minneapolis with communities along I-35W north of downtown to Blaine. The corridor was studied in the 2013 I-35W North Managed Lanes Corridor Study. The study focused primarily on the highway managed-lane vision, but also included an analysis of highway BRT to the 95th Avenue park-and-ride in Blaine that could potentially be coordinated with the managed vision. Portions of the managed-lane vision have been implemented and additional work was conducted on the I-35W North Gateway Study. However, no recommendations were advanced because of the impacts of the COVID-19 pandemic on travel patterns.
Highway 36 – Washington County, in collaboration with partners at Ramsey County, Hennepin County, MnDOT, cities adjacent to the corridor, and the Met Council completed the Highway 36 Transit Feasibility Study in 2021. The study identifies transit service needs and recommendations that are reflective of the Highway 36 corridor’s existing and anticipated future travel demands and patterns. The report includes short- and long-term implementation recommendations that include monitoring and exploring transit service improvements in the corridor and coordinating highway projects with potential multimodal improvements.
Rethinking I-94 – MnDOT led a transit feasibility study in coordination with Met Council as part of the Rethinking I-94 project. The study explored bus rapid transit options on I-94 between downtown Minneapolis and downtown Saint Paul. These transit alternatives will inform more detailed analysis of roadway alternatives in the broader project that will likely result in an identified program of projects in 2028. The Met Council will likely lead the next steps of transitway development concurrent with or after the Tier 1 Environmental Impact Statement is complete for the Rethinking I-94 program of projects recommendations.
County Road 42 – MVTA is leading a study of bus rapid transit options along County Road 42 between Shakopee and Rosemount in the south metro. Study recommendations are anticipated in spring 2024 and will be incorporated into the 2050 Transportation Policy Plan once available.
American Boulevard – The City of Bloomington is leading a study to examine transitway alternatives along American Boulevard to build on previous work exploring arterial bus rapid transit in the corridor. The corridor would connect multiple METRO lines including Blue Line, Orange Line, and Green Line Extension, as well as connect to several planned arterial bus rapid transit lines. In addition, the American Boulevard corridor has significant development plans and development activity, but existing service has not yet demonstrated a proven market for high-frequency service.
Non-regular-route services
Non-regular-route service is a broad category that includes transit services that do not operate on a published route or stop schedule. These types of transit can more effectively provide service for people living in areas that cannot be cost-effectively served with regular-route transit or for people with disabilities that prevent them using regular-route transit. As such, non-regular-route services play an important role in achieving the region’s equity goals. For the purposes of this plan, the types of transit service in this category include:
- Special transportation services (Metro Mobility)
- General public dial-a-ride like Transit Link
- Metro Vanpool
- On-demand, app-based services like microtransit
Because these services are used to complement the regular-route transit system, they continually adapt to the service levels provided on the rest of the system.
What guides decision making for investments in non-regular-route services
Non-regular-route transit services have similar investment needs as regular route when it comes to maintaining an adequate and reliable vehicle fleet or updating equipment. For service expansion, investment decision-making for non-regular-route transit services depends on the type of service:
- Metro Mobility meets the requirements of the Americans with Disabilities Act (ADA) by providing transit service to people with disabilities certified as not able to use the regular-route transit system. Under the ADA, the region is required to provide complementary paratransit service within three quarters of a mile of all regular-route transit service during the same times that the service operates, referred to as the ADA service area. Metro Mobility provides guaranteed rides that cannot be placed on standby for trips starting and ending within this area.
Minnesota state law, under the special transportation services language, requires Metro Mobility service to be provided in areas beyond the requirements of the ADA22, referred to as the Metro Mobility service area. Trips that begin or end outside of the ADA Service Area but are within the Metro Mobility Service Area will be placed on standby. When regular-route service is expanded into areas that previously did not have transit service, Metro Mobility service must also be expanded to provide guaranteed rides within that new coverage area. - General public dial-a-ride is shared-ride public transportation provided for the Twin Cities metro area where regular-route transit service is infrequent or unavailable. The service area for Transit Link, the Met Council’s dial-a-ride service, is based on access to regular-route services.
- Metro Vanpool is provided for people who live or work in the seven-county metro area. Vanpools are made up of five or more people, including a volunteer driver, commuting to and from work at destinations throughout the region on a regular basis. The Metro Vanpool program provides financial assistance for vans serving locations or times not well served by the regular-route transit network. Participants and their vanpool must meet certain criteria. Service levels are largely based on demand and the program is promoted directly by employers or outreach to employers. Historically, demand and availability of volunteer drivers for vanpools have been the limiting factors in expansion, not the availability of financial assistance.
- Microtransit is a relatively new mode that provides shared-ride services on-demand within a defined service zone (for example, an MVTA Connect service zone is Eagan city limits). Transit agencies assign vehicles as needed in response to rider demand within a zone. The Met Council will be working with regional transit providers and local government partners to develop a regional microtransit policy framework that will be incorporated into a future Transportation Policy Plan update. Until then, regional transit providers will continue to explore microtransit services in a variety of applications in the transit network. Microtransit is a required spending category for funding from the new regional sales and use tax passed by the state legislature in 2023.
Non-regular-route service investments included in the current plan
Investments in non-regular-route transit services assumed in the fiscally constrained plan include:
- Continued operation, monitoring, and adjustment of existing non-regular-route bus services
- Metro Mobility service expansion
- Microtransit pilot projects and expansion
- Transit Link and other dial-a-ride programs
- Metro Vanpool service expansion
Metro Mobility service expansion
Metro Mobility continues to plan for growth as demand for ADA service increases with the seven-county metro area’s aging population and other demographic changes. Prior to 2019, Metro Mobility saw an average annual growth in ridership of 7%. Ridership growth in 2019 was modest at 2%. However, the cost of the service has outpaced ridership growth in recent years because of driver shortages and the need to significantly increase driver wages. Additionally, the FTA has defined more stringent service quality expectations, which is lowering productivity and resulting in higher costs per passenger.
Each new ride requires added costs, on average about $45 per passenger trip in 2022. Regular-route bus service, on the other hand, becomes more cost effective with additional riders. For example, core local bus routes average passenger trip cost was just under $11, with some routes achieving $7 per passenger trip. Because Metro Mobility is an essential service for the people it serves and is required under federal law to complement the regular-route system, the growth of this program is considered an investment in the operation and maintenance of the existing transit system, rather than transit system expansion.
Microtransit pilot projects and expansion
Metro Transit micro service is currently a two-year pilot program in North Minneapolis and further options for pilot microtransit programs are being evaluated. SouthWest and MVTA have noted their intent to focus near-term transit expansions on microtransit services as the service type continues to mature and expand its customer reach. These expansions could be in the form of new service areas, new service hours and days, and improved capacity or shorter wait times. The Transportation Policy Plan also has a Work Program item to define microtransit’s role in helping achieve the broader regional transportation goals and objectives in this plan.
Transit Link and other dial-a-ride programs
The Met Council contracts with local governments and private companies to provide Transit Link general public dial-a-ride service. Some suburban transit providers also provide citywide dial-a-ride services with nonregional funds in place of regular-route service that would not be effective. Growth or reduction in these services will be as demand warrants. The expansion of the regular-route bus system may result in reduced demand for Transit Link, as more people will have access to regular-route service. However, the expansion of Suburban Edge communities at low densities may increase the demand for this type of service.
Metro Vanpool service expansion
Service expansion will be dependent on additional demand and availability of volunteer drivers. The Met Council will be working to adjust its requirements for vanpools to meet changing needs as travel behaviors continue to evolve after the COVID-19 pandemic, based on the Metro Vanpool evaluation study completed in 2022.
Investment opportunities beyond the current plan
All of the non-regular-route transit services can be expanded to improve capacity, reliability, or span of service based on demand. Adequate demand must be demonstrated to justify expansion for these modes as they are generally the most costly to operate per passenger, with the exception of vanpool. ADA paratransit service may need to expand beyond assumed amounts if the geographic coverage of regular-route transit service expands. Zero-emissions vehicles, equipment, and support facilities for these services are another potential investment the region may make if funding becomes available.
Transit fleet
The transit fleet is the most fundamental part of the transit system. The fleet includes all vehicles used for providing transit service (buses, trains, etc.), as well as support vehicles. As of 2023, the regional transit system includes about 1,165 regular-route buses, 118 light rail vehicles, 18 commuter rail passenger cars, six commuter rail locomotives, and 790 dial-a-ride or microtransit buses to operate.
Vehicles used to provide service should be comfortable, clean, and designed to meet customer needs. The region utilizes a variety of bus types to match the appropriate vehicle to the service it is providing. Vehicles are also outfitted with various types of equipment to serve customers and make operations more efficient. Finally, each transit provider uses service vehicles in supporting roles that do not transport passengers, such as road supervisor or maintenance vehicles.
What guides decision making for transit fleet
The region’s policy is to prioritize FTA formula funds and regional transit capital funding for asset management, with fleet replacement being the number one transit capital funding priority. The region also has a Fleet Management Procedure107 that documents vehicle replacement expectations based on vehicle useful life and mileage. This document is part of the region’s Transit Asset Management Plan and is intended to facilitate compliance with all federal requirements to assure that vehicles purchased meet minimum standards, and to create efficiencies and improve flexibility deploying and reassigning vehicles. This is the primary policy document guiding decisions on the region’s transit fleet. Each transit provider also has their own asset management practices.
The FTA has also established standards for measuring the condition of vehicles used to transport riders (“rolling stock”) and support vehicles (“service vehicles”). All transit providers should comply with these standards and reporting requirements. There are also standards from the FTA on the percent of spare buses transit providers should keep beyond the maximum number of vehicles operated at a time, called their spare ratio. The purpose of these spare vehicles is to ensure that buses will always be available to run service even if some are in for maintenance work.
Fleet replacement is the top capital investment priority for maintaining the transit system. The region will work to maintain a bus fleet that is integrated and not overly specialized to specific services or corridors. BRT services may have sub-fleets, but these should also be integrated across corridors.
Figure 8.18: Transit fleet in the region
![]()
Transit fleet investments included in the plan
Investments in transit fleet assumed in the plan include:
- Bus and support vehicle replacement
- Light rail vehicle replacement
- Service expansion vehicles
- Fleet modernization and overhauls
Bus and support vehicle replacement
All transit vehicles need to be maintained and then replaced when they are past their useful life, which varies by vehicle type. For example, the Federal Transit Administration’s default Useful Life Benchmark for a transit bus is 14 years, 10 years for a cutaway bus, and 31 years for a light rail vehicle.108
Light rail vehicle replacement
The original light rail vehicles supporting current METRO Blue and Green Line operations will reach the end of their useful life within the horizon of this plan. Replacing these 91 vehicles will represent a significant capital investment.
Service expansion vehicles
Transit agencies may need more vehicles when adding service at times of day when they are already running their maximum vehicles in operation. In some cases, expanding transit service does not require additional vehicles, usually if it is at lower demand times such as the weekends, late evening, or early morning. As METRO network expansion adds more stations and infrastructure to the system, additional support vehicles are also needed to sustain operations.
Fleet modernization and overhauls
Transit agencies typically outfit all their buses with the same equipment for particular systems like fareboxes or automatic passenger counters. At times these systems may become outdated or no longer meet the transit provider’s operational needs. At that point transit providers may procure new equipment for a large portion or all their fleet at once. This can also be the case when new technology comes out that would benefit passengers or operations. Transit providers should evaluate potential fleet modernization projects based on the costs and benefits of new systems and technologies compared to the current equipment. Fleets can also undergo substantial overhauls throughout their life, as certain components are likely to wear out sooner than the overall vehicle. Components like seats, flooring, and engine parts can be overhauled prior to vehicle replacement to maintain a well-functioning vehicle for both operations and the passengers.
Investment opportunities beyond the current plan
Low- and no-emission fleet transition
New state legislation requires spending some regional transportation sales and use tax revenues on no-emission buses and requires that Metro Transit replace all qualifying buses with zero-emissions buses starting in 2035. Transit providers around the country, including in the Twin Cities, have been adding more low- and no-emissions vehicles to their fleets. These vehicles range from compressed natural gas buses, light rail vehicles, electric trolley buses, and battery-electric buses.109 Twin Cities region transit providers have added eight battery-electric buses as well as substantial numbers of hybrid electric buses into the fleet. Many of the early hybrid buses are near the end of their useful life and need replacing.
Battery-electric bus technology may allow the transit fleet to increase its energy efficiency and sustainability. Battery-electric buses typically have lower emissions per mile traveled than diesel or natural gas buses.110 In addition to reducing climate impacts, electric buses have no tailpipe emissions and therefore reduce local pollution in the neighborhoods they serve, like the METRO C Line. The region plans to continue adding battery-electric buses to the transit fleet, but the amount and timing are still subject to technical factors.
Like other new technologies, battery-electric buses have operational challenges, but they are expected to improve over time. They vary from charging technology to range and maintenance. All of this means a different approach to planning service using these buses is required compared to fossil fuel powered buses. The Met Council and its partners will continue monitoring the state of electric buses, charging technology, and service planning strategies with an eye for when and how to expand their use in the region’s transit system while maintaining high quality service. The region will also re-evaluate alternative options for reduced emissions from transit operations in the meantime based on lessons learned thus far.
Competitive grants are available, such as the FTA Low/No Emissions Grant Program, but these sources are limited and agencies across the country compete for them. Transit providers must also have a zero-emission fleet transition plan to be eligible for this funding.111 All regional transit providers should prepare and maintain one of these plans.
Transit support facilities
Transit service in the region uses a substantial system of both public and private transit support facilities. Support facilities are where the necessary behind-the-scenes work occurs that is essential to maintaining reliable, high-quality service throughout the region. Facilities in this category include bus garages, maintenance buildings, rail support facilities, operations centers, communications control centers, bus layover facilities, and others.
The regional transit system must have adequate facilities to support efficient and cost-effective transit services. The region sorts transit support facilities into three categories:
- Bus support facilities include garages and bus maintenance facilities, bus layover facilities at route terminal points, and dispatching and control centers.
- Rail support facilities include operations and maintenance facilities, train storage facilities, layover facilities, and logistics facilities such as control centers.
- System-wide support facilities are all support facilities that are not specific to a particular mode of transit and include transit control centers, facilities maintenance headquarters, and transit police facilities.
As the transit system expands, and the types of services available and the number of riders increases, support facility capacity must increase as well.
What guides decision making for transit support facilities
Generally, as the transit network expands, bus garages, bus layovers and vehicle storage will need to be increased. Maximum use of existing support facilities should be made but overcrowded facilities lose operating efficiency, making it more difficult to provide the quality of transit service expected in the region. Support facilities expansion should precede fleet expansion.
The FTA has also established standards for measuring the condition and managing of support facilities for both bus and rail. All transit providers should comply with these standards.
Transit support facilities investments included in the plan
Investments in transit support facilities assumed in the plan include:
- Support facilities maintenance and replacement
- Bus facilities modernization and expansion
- Rail facilities modernization and expansion
- Systemwide facilities modernization and expansion
Support facilities maintenance and replacement
The current revenue scenario assumes that transit providers will replace support facilities as needed based on multiple factors like FTA useful life, condition ratings, and asset management plans, policies, and procedures.
Bus support facilities modernization and expansion
Currently, Metro Transit uses five bus garages for daily maintenance and storage of vehicles, with two additional facilities serving needs for more intensive vehicle repair and vehicle storage. Other regional transit providers have support facilities as well, such as Southwest Transit’s maintenance and administrative facility in Eden Prairie, either through direct ownership or through agreements with private operators.
Existing garage facilities in the region are aging and the need to maintain or replace them will emerge as an issue to be addressed in the coming decades. Their use and effective life can be maximized with maintenance and modernization efforts, including investments that result in operating efficiencies. The North Loop Garage opened in 2023, and an expansion and modernization of the Heywood Garage was completed in 2020.
Given projected growth and capacity of existing layover facilities, the region expects additional layover facilities will be needed in both downtowns, the University of Minnesota, and some suburban locations. Bus layover facilities provide a physical space for transit vehicles to stage, an opportunity for route recovery time, and driver break rooms and restrooms. Bus layover facilities are typically located at the end of transit routes and may be co-located with customer facilities, such as transit centers. These facilities enable the system to operate cost-effectively and on time.
Rail support facilities modernization and expansion
Rail support facilities presently include two light rail transit operations and maintenance facilities, a rail operations support facility, and the Northstar commuter rail maintenance facility. A new rail support facility is planned as part of the METRO Green Line light rail expansion project. Options to improve or expand existing facilities as well as construct new facilities will be evaluated based upon the planned transitway network, corridor-specific planning efforts, and facilities planning for the entire transit system.
Systemwide support facilities modernization and expansion
Systemwide transit support facilities currently in operation include central control centers, maintenance crew headquarters, materials warehouses, transit police facilities, and administrative offices.
Control centers monitor schedule adherence and coordinate the daily activities of buses, trains, Metro Mobility and dial-a-ride services, service vehicles, training vehicles, and other mobile units. They also dispatch vehicles to respond to on-street incidents and to support transit police.
Facilities that headquarter maintenance crews are needed to keep customer facilities clean and in good condition. Customer facility maintenance capacity must expand to meet the maintenance needs of more heavily used existing facilities and of new facilities.
Investment opportunities beyond the current plan
In general, support facilities investments should match the planned service levels and network developed by transit providers. Additional support facilities beyond those included in this plan may be needed if transit service is expanded well beyond planned levels.
Customer facilities
Customer facilities are the places where transit customers get on and off transit vehicles such as transit stations, transit centers, and bus stops. Customer facilities also serve as an important point of transfer between transit services, including bus-to-rail transfers. Regional transit providers build and maintain a range of features and amenities such as real-time transit information, shelters, and seating. Customer facilities are an important factor in people choosing to take transit, and their design should be accessible, safe, and comfortable.
What guides decision making for customer facilities
Regional guidelines for customer facilities are defined in the Transit Design and Performance Guidelines subsection. These guidelines provide for regional consistency in the spacing and features of different customer facilities. Transit providers also have their own policies and procedures for customer facilities, such as ADA transition plans, transit asset management plans, shelter placement guidelines and their bus stop design guidance that provide more detailed direction. The state and some cities also have their own regulations that affect customer facilities. For example, new legislation in 2024 requires that Met Council construct sidewalk curb ramps and pedestrian signals at each intersection adjacent to a BRT station that are not currently ADA compliant. The federal government also has standards, particularly for accessibility for people with disabilities through the ADA.112
Every customer facility should provide ADA accessibility and information for customers to feel secure in using the transit system.
Customer facilities investments included in the plan
Investments in transit customer facilities assumed in this plan include:
- Bus stop improvements
- Transit centers
- Transit stations
- Mobility hubs
- Park-and-rides
Customer facilities categories often overlap and share many features. For example, transit centers and stations usually have bus stops; many transit centers are also mobility hubs and transit stations; and park-and-rides are passenger amenities provided at many of these facilities.
Bus stop improvements
Bus stops are established locations for customers to get on and off the bus. There are approximately 12,000 bus stops in the region. Features that modernize bus stops - such as pavement improvements, enhanced transit information, shelters, or heat and light in shelters - improve the customer experience. Bus stop improvement programs, such as Metro Transit’s Better Bus Stops program, are assumed in the plan. Maintenance, replacements, and improvements at customer facilities are a required investment category for regional transportation sales and use tax under state law.
Transit centers
Transit centers are customer facilities that provide comfortable and convenient locations for customers to transfer between routes where two or more transit routes connect. They are typically located off-street at major activity centers and have multiple bus stops with bus service timed for easy transfers. Transit centers provide customers with shelter, transit information, and other features to enhance their experience. Buses also frequently lay over and bus operators may take breaks at transit centers. Having break facilities directly at layover locations is important for scheduling and on-time performance.
Transit centers may need to be refurbished or modernized to meet customer needs for access, safety, and comfort. With changes in transit service, opportunities for new transit centers may emerge or existing transit centers may need to be adapted to meet operational needs.
Transit stations
Transit stations are customer facilities associated with transitways. They provide public access to light rail, commuter rail, and bus rapid transit services. There are currently 130 transit stations in operation on the system. New transit stations are typically developed as transitways are constructed but can also be added incrementally before or after a full transitway is in operation. More information regarding transitway investments can be found in section 4.3 Transitways.
As the transitway system matures, transit agencies will need to modernize existing transit stations through refurbishments and upgrades for service reliability, safety, and customer comfort.
Mobility hubs
A mobility hub is a public gathering space or transportation facility where customers can get information on and make connections between multiple transportation options. While transit customer facilities make natural mobility hubs, they are not exclusive to transit. Mobility hubs often include shared mobility travel options like bikes, scooters, and electric cars. Hubs help people easily switch between travel options and bridge the gap between different types of travel. These facilities often include features like additional passenger amenities, real-time customer information, or first-/last-mile travel options. These improve the user experience and encourage multimodal travel. Met Council’s Mobility Hub Planning and Implementation Guidebook provides comprehensive technical assistance to transportation partners for implementing mobility hubs across the Twin Cities region.
The guidebook recommends hub locations based on transportation services, land use, demographics, and other factors to highlight areas that could benefit the most from mobility hubs investments. An online map shows the region’s 50 priority locations for mobility hubs.
Park-and-ride facilities
Park-and-ride facilities are surface lots and structured ramps, mostly in suburban communities, served by commuter and express bus, highway or dedicated bus rapid transit, or rail. Park-and-rides are amenities co-located with other types of customer facilities like bus stops, stations, or transit centers. Park-and-rides are important tools for creating locations with the customer density required to provide cost-effective transit service in suburban and rural areas. The system currently operates at around 15% of capacity and can accommodate the demand expected through 2050. Some additional park-and-rides are planned along new transitways that could serve a different market than the existing system.
The park-and-ride system and express bus corridors are shown in Figure 8.9.
Investment opportunities beyond the current plan
Park-and-ride modernization
The region made significant investments in park-and-rides in prior decades. Since 2020, commuter travel patterns have drastically changed, and the longstanding 9-to-5 commute to downtown offices from suburban areas via transit has recovered slower than other transit ridership.113 Factors for this slow recovery include an increase in telecommuting at least 1-2 days a week and lower parking rates at downtown ramps that make it more attractive to drive. Transit providers may adapt the existing park-and-ride system to changes in customer use and transit service through strategies like consolidations or transit-oriented development or even downsizing or closure per the plan’s Policies and Actions.
Transit providers will continue to coordinate with local communities in planning and designing park-and-rides to integrate park-and-rides into local development patterns. Transit-oriented development and joint-use ventures associated with park-and- ride locations may become more prevalent over time as the region’s transitway system and land use development matures.
Regional multimodal hubs
Regional multimodal hubs connect light rail and commuter rail transit to multiple other existing and planned services. There are currently two of these facilities in the region. The Union Depot in downtown Saint Paul is served by the METRO Green Line, local and express bus service, Amtrak passenger rail service, and several intercity bus services. It will also be served by the Gold Line starting in 2025. Target Field Station in downtown Minneapolis is served by the METRO Green Line and Blue Line light rail, Northstar commuter rail, and other bus services that connect in downtown Minneapolis. Additional multimodal hubs may be added to the system as the region continues to build out its rail transitways or passenger services that extend beyond the region (for example, passenger rail and intercity bus services). There are no additional planned regional multimodal hubs included in this plan.
Transit advantages
Transit advantages are facilities or equipment that allow transit to travel faster than general traffic or bypass it completely in some cases. These advantages include transit-only streets, bus-only shoulders and lanes, high-occupancy vehicle lanes and managed lanes, ramp-meter bypasses, traffic signal queue jumps, transit signal priority, and curb extensions at transit stops.
These features help transit be a more competitive and attractive option than driving alone, especially on congested roads or many traffic lights. Speed and reliability are consistently cited as top priorities for transit riders in the region. In addition to providing benefits to riders, transit advantages also make transit service more efficient to operate. In some cases, improvements to travel time on a route can reduce the number of buses and drivers needed to operate it, meaning the same service can be provided with fewer resources. These savings can then be allocated to other routes or used to increase frequency on the improved route. Transit advantages can also help manage vehicle demand on roadways by making transit flow smoother and attracting additional riders which also improves its people-moving efficiency.
What guides decision making for transit advantages
Decision making around transit advantages investments is largely based on coordination between the agencies that own facilities (the roadway authority) and transit service providers. On highways, MnDOT builds managed lanes, high-occupancy vehicle lanes, and bus-only shoulders in coordination with transit providers. Bus lanes are also being considered on MnDOT arterial roadways within urban cities.
Cities and counties also participate in decision making and implementation of transit advantages on their roadways. For example, several bus-only lanes have been installed in the City of Minneapolis and the City of Saint Paul in coordination with Metro Transit. More are planned.
Looking ahead, a prioritized five-year plan of transit advantage projects in Minneapolis will be available in late 2024. Minneapolis and Metro Transit evaluated 27 potential corridors for transit advantages as part of the City’s Transportation Action Plan. Using data such as passenger delay or equity and other considerations like project coordination, the project team categorized each corridor into one of three tiers. Corridors that ranked in top tier will be advanced between 2024 and 2030.
Transit advantages investments included in the plan
The following transit advantages investments are included in this plan:
- Transit advantages on highways
- Transit advantages on local roads
- Transit advantages on transitways
Transit advantages on highways
On state highways, transit advantages can include bus-only shoulders, dedicated bus lanes, managed lanes, ramp meter bypasses, and transit stations adjacent to or on roadways (see Figure 8.19). The managed lanes and high-occupancy vehicle lanes section of the Highway Investment Plan outlines the investments in these transit advantages facilities that are included in the fiscally constrained plan. Maintenance and spot mobility projects also offer opportunities to widen shoulders enough for bus-only lanes where they currently could not accommodate a bus.
Transit advantages on local roads
On local streets, transit advantage investments include dedicated bus lanes, dynamic parking lanes, traffic signals that are coordinated with transit service and/or provide transit priority, curb extensions that allow buses to avoid pulling out of and back into travel lanes, and queue jump lanes, among others. These improvements provide faster trips for customers, improve the attractiveness of transit, and significantly increase the people-moving capacity of local streets.
Figure 8.19: 2050 Bus shoulders and managed lanes

Transit advantages on transitways
Transitways generally include transit advantages appropriate to meet the speed and reliability goals for the route. For example, arterial BRT operates on busy roadways with traffic signals. As a result, they often include transit signal priority and in some cases bus-only lanes for a portion of the route. Investment plans for transit advantages are based on the planned transitway investments outlined in the Transitways section of this chapter.
Opportunities for investment beyond the current plan
Transit providers partner with roadway authorities to improve speed and reliability along high ridership corridors served by one or more bus routes. The region is exploring an expanded network of bus-only lanes or other transit advantages that can provide more consistent travel times in congested areas and can make transit a more attractive option for the region’s traveling public.
In some instances, bus lane concepts are being tested through a short-duration pilot project such as in Hennepin Avenue bus lane pilot project completed in February 2020. This allows the transit agency and roadway authority to measure changes to route performance, observe impacts to traffic, and gather public feedback. If the initial results are promising, any lessons learned can be incorporated into the final design and expand the concept to additional corridors as it becomes a more proven concept.
Fare equipment and supporting systems
Investments in fare-collection equipment and supporting systems include fare technology, new fare media, on-vehicle fare-collection equipment, off-board fare-collection equipment, and mobile apps. All of these play an important role in transit service delivery. Improvements in fare-collection technology should ensure regional compatibility while supporting regional goals and objectives.
What guides decision making for fare equipment and supporting systems
Two documents regarding fare collection equipment and technology provide direction at the regional level. The Guidelines and Procedures for Fare Collection sets the regional fare structure for regular-route service including transfers from dial-a-ride and paratransit. Chapter 7 of the Regional Transitway Guidelines provides general guidance for decision making on transitway fare collection. Transit agencies plan for the maintenance and replacement of these systems in their transit asset management plans.
Overall, the goal of fare collection systems is to provide a convenient customer experience, support operating goals for the various service types, and provide accurate data for reporting. Regional transit providers make their own decisions within the regional guidelines based on the needs of their customers and their asset management approach. Fare collection equipment ages like any other asset and fare technology needs can change over time.
Fare equipment and supporting systems investments included in the plan
Regular replacement of fare collection equipment and supporting systems on transit vehicles and at stations as needed is managed by the regional transit agencies and assumed in the financially constrained plan. This includes a large update to Metro Transit’s fare collection system software that will allow for account-based fare payment (rather than card-based like the current Go-To system), fare capping, and other features.114
Opportunities for investment beyond the current plan
While customers can transfer between services of the various regional providers, transfers to regular-route services from other modes can take multiple steps. The region will investigate opportunities to improve transfer experiences for customers between regular-route and non-regular-route services.
Safety and security
Safety and security investments encompass both equipment and staffing, on transit vehicles and at customer facilities, that help to provide an environment where transit customers and operators can take their trip or do their jobs without worrying about their personal safety. Working with transit providers and communities, the Met Council will continue to work to provide a safe and secure environment for customers and employees on vehicles and at transit facilities.
The Metro Transit Police Department and transit liaisons like the Transit Rider Investment Program (TRIP) staff at Metro Transit are important parts of this effort. Through a variety of means, transit police and transit liaisons enhance security, and preserve the quality of regional transit infrastructure, which also helps to increase ridership. These include fare enforcement, welfare checks, regular patrols and rides on transit vehicles, partnerships with other law enforcement agencies and community organizations, and innovative programs such as community service officers.
Not everyone has the same experience using the region’s transportation system; analyses of enforcement data show that people of color experience disproportionate traffic stops or enforcement on transit. People of color are also disproportionately represented among the region’s transit riders. The Met Council will work to ensure that Metro Transit Police actions do not perpetuate racial inequities. The Metro Transit Police Department will also work to remain current with evolving industry standards, best practices, and community expectations.
Safety is a shared responsibility, and the Met Council will continue to invest in employee awareness and public education campaigns to improve transit safety. Furthermore, public transit is a safer system when it is well used. More people use transit when they feel comfortable on it, especially new riders. Operating useful and frequent services with well-maintained facilities can also help to improve safety.
What guides decision making for safety and security investments
Federal legislation gives authority and responsibility to the U.S. Department of Transportation for safety oversight and rulemaking related to all modes. FTA has been publishing rules along these lines, focusing mostly on rail transit, but also requiring performance measures and targets for transit safety. Every transit provider in the region takes the safety of their employees, customers, and the public seriously and has procedures for ensuring safety. At Metro Transit:
- Each mode has its own system safety program plan that describes how safety is integrated into the operation. Further, all modes have an accident investigation, reporting, and corrective action planning process.
- All transit modes have an emergency management plan that describes the overarching responsibilities and public safety partners. These are updated annually for bus and light rail.
- All major capital projects undergo a safety certification process to ensure that the new service is safe for passenger operations. Similarly, significant changes to the operating system are subject to the same rigorous verification.
Regional transit providers also may produce more general safety plans such as the Metro Transit Safety & Security Action Plan,115 which was completed in 2022. This plan summarizes the steps Metro Transit is taking to improve public safety on transit, including more than 40 individual actions focused on improving conditions on the system, training and supporting employees, and engaging customers and partners. Reported crimes declined by 25% from the first to fourth quarter of 2023.
In addition to promoting safety and security during regular transit operations, the Met Council and Metro Transit also have an important role in regional disaster preparedness. The Met Council maintains an emergency management plan to coordinate between Metro Transit and the various regional and state public safety agencies in the event of an emergency.
Safety and security investments included in the plan
Transit safety and security equipment
Equipment is an important component of safety and security. These investments range from cameras and emergency telephones on transit vehicles and at stations, to improved lighting at transit stops and stations, among others. An important component of safety and security is good design of facilities, including the consideration of Crime Prevention through Environmental Design principles.116 Regional transit providers will continue to invest in needed safety equipment both on vehicles and at customer facilities, such as Metro Transit expanding use of real-time cameras.
Transit liaisons and fare enforcement
The Met Council implemented the Transit Rider Investment Program (TRIP) in 2023, deploying nonpolice personnel to perform fare inspections.117 These staff also educate and assist riders, improve the transit experience, and may issue administrative citations for fare violations in accordance with Minnesota Statutes section 473.4075. Updates to state law changed fare violations from a misdemeanor to an administrative citation, which allows agencies to use nonsworn officers to administer them. The addition of these staff will bolster official presence on transit as well as free up capacity for transit police to focus on other public safety needs.
Opportunities for investment beyond the current plan
As additional funding may be available and prioritized for this purpose, additional safety and security equipment or upgrades and additional safety and security staffing may be implemented by regional transit providers.
Financial Summary
Overall, the region’s financial position for transit is positive and stable going forward. This is due to increased revenues from a new regional sales tax, which the state legislature passed in 2023, as well as shifting funding responsibility for the region’s ADA paratransit services (Metro Mobility) to state funding sources. The existing and new transit revenues shown in Table 8.3 will meet the needs identified in this plan for transit operations and capital investments. This funding will allow the region to maintain bus service, meet obligations to operate ADA service, and expand the region’s transitway system.
Regional transit, one of the four main categories in the Finance Chapter, is projected to make up roughly one third of total regional transportation revenues and expenditures over the plan timeline, accounting for $53.9 billion out of $171 billion. This figure includes revenues and spending by all regional transit providers and local governments for the regional bus and transitway systems.
1Table 8.3: Regional transit revenues by source118
| Revenue source | Calendar year 2025 Total | 2025 % of Total | 2025-2050 Total | % of Total |
| Regional sales tax | $449 | 27% | $17,300 | 32% |
| Motor Vehicle Sales Tax (MVST) | $368 | 22% | $14,300 | 27% |
| State general fund and bonds | $163 | 10% | $7,050 | 13% |
| Fares | $82 | 5% | $4,100 | 8% |
| Federal formula and Regional Solicitation | $198 | 12% | $5,500 | 10% |
| Federal Capital Improvement Grants | $100 | 6% | $1,300 | 2% |
| County sales tax and regional railroad authorities | $244 | 15% | $1,050 | 2% |
| Regional transit capital property tax and other | $63 | 4% | $2,450 | 4% |
| Fund balance and interest earned | - | - | $850 | 2% |
| Subtotal | $1.67 billion | 100% | $53.9 billion | 100% |
The largest expenditure of transit funds will be for operating the system, accounting for more than two-thirds of all transit spending from 2025 to 2050. Roughly 52% of all spending will be for bus system operations, 9% for operating current transitways, and 12% for operating planned transitway lines that will be built during the plan timeline. Just under one-quarter of available funds will be used for capital projects including for the bus system, current transitways, and future transitways. This includes major individual investments such as:
- Light rail vehicle replacement ($1.1 billion) and vehicle overhauls ($600 million)
- Construction of new regional transitways including METRO Green Line Extension light rail (completion), METRO Blue Line Extension light rail, METRO Purple Line dedicated BRT, and the METRO B, E, F, G, and H arterial BRT lines.
Table 8.4. Regional transit expenditures, by category, in millions of dollars
| Expenditure | Calendar year 2025 Total | 2025 % of Total | 2025 through 2050 Total | % of Total |
|
Bus operations |
$684 | 41% |
$28,650 |
53% |
| Bus system capital | $250 | 15% | $6,250 | 12% |
| Current transitways operations | $143 | 9% | $5,200 | 10% |
| Current transitways capital | $21 | 28% | $3,400 | 6% |
| Expansion transitway operations | - | - | $5,550 | 10% |
| Expansion transitway capital | $447 | - | $2,650 | 5 |
| Remaining transit opportunity funds | $122 | 7% | $2,300 | 4% |
| Subtotal | $1.67 billion | 100% | $53.9 Billion | 100% |
Regional Transportation Sales and Use Tax and other legislation
The regional sales tax created by the 2023 Omnibus Transportation Law119 will now be the largest single transit revenue source at 27% of total revenues out to 2050. In calendar year 2025, the regional sales tax is expected to supply about $450 million in revenues for transit and a total of over $17 billion between 2025 and 2050. Most of this funding will be used to cover operating costs of services that are already present or planned.
Figure 8.20 shows how the new regional sales tax funds will be used across various transit purposes, including to fill expected operating and capital shortfalls for existing bus and rail services and to provide funds for new transitway operations and capital maintenance. Roughly $2.3 billion of the sales tax funds remain to be identified for new transit spending opportunities. Figure 8.20 is current as of October 2024; these allocations will change over time with changes to capital projects, transit operations, and maintenance needs.
Figure 8.20: Regional transportation sales tax transit spending by category, 2025-2050, as of October 2024
![]()
Other major implications for transit in the Twin Cities region from recent legislation include:
- State general fund revenues will be responsible, after fares and federal revenues, for the costs of Metro Mobility operations and capital starting in state fiscal year 2026.
- The metro counties’ 50% share of dedicated transitways (light rail, dedicated BRT, highway BRT, and Northstar commuter rail) operating costs were shifted from the counties to the Met Council, accounting for about $4.2 billion, or 24% of the 26-year total regional sales tax revenues.
- The region is required to spend a portion of the regional sales tax revenues on specified purposes ranging from improvements to accessibility at customer facilities, expanding micro-transit services, to procuring zero-emissions buses in line with the Met Council’s transition plan. The required investment areas are covered in the Transit Investment Plan section of this document.
- Met Council light rail capital construction funding is restricted to federal funds and direct appropriations.
Additional funding opportunities
Federal discretionary funds
The region has historically been competitive for funding from many federal discretionary programs. It is anticipated that the region will continue to apply for and receive grants for opportunities to enhance its transit system. While the plan already assumes FTA Capital Investment Grants for a number of transitways, additional grants could be sought for new corridors that are identified or replace local funds for planned corridors, like arterial bus rapid transit projects.
Some examples of other discretionary transit programs that have been successful in the past include buses and bus facilities, low- and no-emission vehicle programs, and transit-oriented development planning. The vast majority of federal funding programs provide funds only for transit capital purposes, or to initiate new services over the first few years of implementation. These and other potential FTA grant programs could provide additional funding to support the transit investment plan.
Regional Solicitation
The region receives federal formula funds to allocate and invest as it chooses in the regional transportation system. The region has provided significant funding for transit projects through its Regional Solicitation competitive process and expects to continue to do so. In total, over $3 billion of federal funds will be available for the Met Council and TAB over the life of this plan to determine how to invest in our transportation system in a manner that will best help the region achieve our goals of safe and welcoming, climate leadership, equitable and inclusive, dynamic and resilient, and protecting our natural systems.
As of 2024, the region has begun a process to evaluate and update the Regional Solicitation process. This will include transit funding categories, scoring criteria, and a general approach. Once the Regional Solicitation evaluation project is complete, changes to funding will be amended into the Transportation Policy Plan.
Carbon Reduction Program
The Infrastructure Investment and Jobs Act of 2021, also known as the Bipartisan Infrastructure Law (BIL), established the Carbon Reduction Program. Administered by the Federal Highway Administration, the program provides $6.4 billion in formula funding over five years for states to develop carbon reduction strategies and for projects to reduce transportation carbon dioxide emissions, including traffic management, public transportation, pedestrian facilities, alternative fuels, and port electrification. The Carbon Reduction Program is a formula program, meaning that federal funding is apportioned among the states and states have broad discretion over how they spend the funds. States are also able to transfer Carbon Reduction Program funds120 to other formula programs.
The Carbon Reduction program provides Minnesota with approximately $20.9 million annually over five years to fund projects that reduce carbon emissions from surface transportation. Program funding is distributed across the state, with some funds allocated proportionally based on population. MnDOT districts and metropolitan planning organizations like the Met Council will select projects to receive Carbon Reduction Program funding. The Bipartisan Infrastructure Law required each state to develop a carbon reduction strategy to support efforts to reduce carbon dioxide emissions from on-road highway sources in consultation with metropolitan planning organizations in the state. MnDOT published a report121 documenting the state’s strategies and goals in November 2023.
State discretionary funds
Transit providers can seek one-time funding from the State of Minnesota. The state has historically provided state general obligation bonds for some transit projects over the past decades. State bonds must be used for capital projects and cannot be used for vehicle fleets or assets with a short useful life. In recent years, state bonds have been appropriated for bus rapid transit corridors and the Mall of America transit station improvements.
The State of Minnesota also provides general funds for transit operations and this number can go up or down every two-year state budgeting cycle. While less common, there have been instances of the state appropriating general funds to transit for capital purposes when there is a large state budget surplus.
County funding
Metropolitan area counties have various funding sources that can be used for transit purposes. Some counties have invested substantially in the transit system in the past, especially those counties that have planned transitways. Before the law changes in the 2023 Omnibus Transportation Law, counties provided half of transitway operations funding that is now required to be paid by the Met Council.
Going forward, metro area counties have both their own locally enacted transportation sales taxes of up to one-half-cent and 17% of the new three-quarter-cent regional sales and use tax for transportation purposes. They also receive funds from the transportation advancement account, which collects revenues from sales taxes on vehicle repair parts and a regional package delivery fee on purchases of $100 or more. Under state law, counties must spend 17% of the funding they receive through the regional transportation sales and use tax and the transportation advancement account funds on transit purposes, complete streets, or activities to reduce transportation related greenhouse gas emissions. This plan assumes counties will continue to provide the nonfederal share of funding to develop and construct new transitways that are not arterial BRT. Counties also have regional railroad authorities that can levy taxes and, in the past, some of this funding has gone toward transit projects. All county funds are administered and prioritized through county and regional railroad authority budgeting processes.
Counties, the Met Council, and regional transit providers will need to mutually explore opportunities to fund the identified transit investment opportunities in this chapter. Counties that are investing in transit should work directly with the Met Council and regional transit providers to identify how their investments fit with regional transit plans. In addition, regional transit providers and the Met Council should work directly with counties as well as MnDOT on transit investment plans to make sure they identify how they will impact and interact with county infrastructure and plans.
