Regional Transit Design and Performance Guidelines
Table of Contents
Introduction
Demand for transit service varies across the region. This applies to the time of day that transit is used, the number of trips taken, and the purpose of those trips. While this variation in transit demand is driven by several factors, it is primarily due to differences in density of development, urban form, and demographics. To account for these differences in planning and evaluating transit service, the Metropolitan Council collaborated with regional transit providers and other partners like cities and counties to develop the following regional guidelines for transit service design and operation. The Met Council intends for these to provide transit users with consistent service quality across the region while allowing transit providers and local governments to make their own decisions about the specifics of transit service and operations in their communities.
Transit Planning Basics
The region’s transit system is a network of routes, facilities, and services that need to be well designed and managed to best achieve regional goals, including good stewardship of public resources. This is especially true in a fiscally constrained situation, where available funding only allows for building and operating the highest priority projects. The region uses a number of foundational principles to guide transit route and network design and ultimately influence the overall success of the transit network.
Demographic factors, generally outside the control of transit providers, and urban design shape the design and potential success of transit investments. Transit providers design the transit system and manage it largely based on these demographic and urban design factors.
Urban design, such as land use or street layout, is typically outside the direct control of any one agency or government body. However, multiple agencies can change the urban environment over time, especially when working in collaboration with each other. Urban design factors are generally managed by land use planning efforts and development policies of local governments, and transportation system planning of local, county, and state agencies. A successful transit system requires the cooperation of transit agencies, local governments, and state agencies within their respective roles.
Service and route types
The region classifies transit routes based on the type of vehicle used (mode) and their role within the region’s transit network for the purposes of providing design and performance guidelines. Service types include local bus, express and commuter bus, demand response, and transitways. All service and route types classified below, except demand response, are fixed-route services. This means they operate along established paths with published schedules and designated stops, although some routes may operate with a flex or deviation pattern.
Figure 9.1: Fixed-route and demand response services

Local bus service is the foundation of the region’s transit system
Local bus routes form the base of the transit network, providing access between where people live and the centers of activity, ranging from downtown cores or key destinations like medical services to neighborhood commercial centers. Some core local bus routes are supplemented with a limited stop route designed to serve customers wishing to travel farther distances along the corridor. Limited stop routes make fewer stops and provide faster service than the core local routes. There are three main types of local bus routes including:
- Core local bus routes provide frequent transit service throughout the peak period and generally into the midday and evenings. These routes typically serve the denser urban areas of Market Areas I and II, usually providing access to downtowns or major activity centers along important commercial corridors. They are some of the most productive routes in the system.
- Supporting local bus routes are designed to provide crosstown connections, usually within Market Areas I and II. Typically, they do not serve downtowns but provide important connections between core local routes and ensure transit access for those not traveling downtown.
- Suburban local bus routes typically operate in Market Areas II and III. These routes serve an important role in providing a basic level of transit coverage throughout the region. Provider-specific variations on suburban local bus include community routes, feeder routes, and suburb-to-suburb routes which are similar to express bus routes but between suburban locations.
Coverage service provides regular-route transit service to areas that have lower transit demand but meet certain guidelines
The Met Council’s service area encompasses seven counties. Much of the residential and population growth has been happening in areas outside of urban core communities. There is continual pressure to add service in areas that either do not currently meet or are unlikely to meet established transit route productivity guidelines. However, the value of a bus route in a lower-demand setting may not always be best measured by the number of riders it carries per in-service hour. Other measures, such as serving job centers or neighborhoods with high numbers of people likely to rely on transit to travel, also serve the region’s broader transportation objectives. Guidelines for coverage service design and performance in the Transit Design Guidelines section of this subsection.
Overall, regional transit providers should operate a productive system in terms of ridership but choices on individual routes and their resulting productivity can serve multiple regional goals such as equity.
Commuter and express bus mainly serve workers traveling to and from employment centers
Commuter and express bus routes mostly operate during peak periods, serving commuters going downtown or to a major employment center. These routes typically operate on highways for portions of the route between picking up passengers at a few stops in residential areas or park-and-ride facilities.
Demand response service improves access to transportation
Demand response is a broad category of transit services that fulfill different roles based on the size of their service area, how far in advance rides must be reserved, and who is eligible to use the service. Transit providers typically use smaller vehicles to operate these services and they are designed around access to transportation rather than high ridership productivity. Three types of demand response services currently operated in the Twin Cities region:
- General public dial-a-ride is intended to augment the regular-route network and is only available for trips that cannot be accomplished on regular routes alone. Transit Link is the Met Council’s general public dial-a-ride service and is open to the any person and operates where regular-route transit service is not available. Transit Link trips may drop off passengers at major transfer points to complete their trip on the fixed-route network.
- Paratransit service is public transportation for certified riders who are unable to use the regular fixed-route bus due to a disability or health condition and is required by the Americans with Disabilities Act. In the Twin Cities region, the Met Council oversees all ADA paratransit services. Metro Mobility contracts with ADA paratransit service providers, who provide customers with first door (pickup) through first door (drop-off) transportation.
- Microtransit provides on-demand, shared-ride transit service within a defined zone. The zone is usually small enough to keep wait times for pickup under a set number of minutes. Microtransit in the Twin Cities serves areas ranging in size from several neighborhoods to the entire service area of some smaller transit providers. The Met Council and its partners will be developing a regional framework for designing and managing microtransit services.
Paratransit riders must meet eligibility requirements to access the service
Eligibility for ADA services is determined using federal guidelines established by the Americans with Disabilities Act. A person may be eligible for ADA paratransit service if any of the following apply:
- The individual is unable to independently navigate the fixed-route transit system because of a health condition or disability.
- The individual is unable to independently board or exit fixed-route vehicles due to a heath condition or disability.
- The individual is unable to propel to or from a bus stop within the fixed-route service area due to a health condition or disability.
Paratransit service span and area are guided by federal and state requirements
The paratransit service coverage area and hours of service are determined by several factors outlined in federal and state requirements. Per the federal requirements, ADA paratransit service must operate within at least 3/4 mile of the local regular-route network and for the same hours of the day. To meet this requirement, Metro Mobility matches the regular-route hours of service delivery for weekday, Saturday, and Sunday and holiday service in each community where regular-route service is available. In addition to federal requirements, the State of Minnesota requires Metro Mobility to provide service to all communities within the transit capital levy district. Metro Mobility is available to eligible residents living in these areas by providing 12 hours of service on weekdays, and on an as-space-is-available basis on Saturdays, Sundays, and holidays.
Transitways
The region uses the term transitway as a general designation for transit routes that meet one of the following criteria:
- Providing frequent all-day service, high-capacity or uniquely branded vehicles, and high amenity stations that include off-board fare payment
- High-capacity service operating on a fixed-guideway such as rail or a bus-only facility
Transitways are built on high-demand corridors where the most customers will benefit from enhanced services and amenities. These routes are part of the METRO system and designated with a color for light rail and highway or dedicated bus rapid transit or a letter for arterial bus rapid transit.
The region operates three transitway modes including:
- Bus rapid transit
- Light rail transit
- Commuter rail
Design guidelines for each of these modes are provided in the Transitway Design Guidelines section of this appendix. Modern streetcar is also considered a transitway mode but no lines are currently operating in the Twin Cities region.
Bus rapid transit provides faster service on the highest demand bus corridors
Bus rapid transit is a high-frequency, high-amenity bus service that typically operates 18 hours a day and provides faster connections between destinations than local bus services. It uses transit advantages, off-board fare payment, and has less frequent stops. The region uses bus rapid transit on high-demand corridors to provide a convenient and reliable rider experience that encourages transit use.
Three types of bus rapid transit have been implemented in the Twin Cities region to date:
- Arterial bus rapid transit operates in high-demand urban arterial corridors with service, facility, and technology improvements that enable faster travel speeds, greater frequency, an improved passenger experience, and better reliability.
- Highway bus rapid transit operates in high-demand highway corridors with service, facility, and technology improvements providing faster travel speeds, greater frequency, an improved passenger experience, and better reliability.
- Dedicated bus rapid transit operates in dedicated right-of-way for the exclusive use of buses in high demand corridors. Service, facility, and technology improvements are similar to light rail. It provides faster travel speeds, greater frequency, an improved passenger experience, and better reliability.
Light rail
Light rail operates using electrically powered passenger rail cars operating on fixed rails in a dedicated right-of-way. It provides frequent, all-day service, stopping at stations with high levels of customer amenities and waiting facilities.
Commuter rail
Commuter rail typically operates using diesel-power locomotives (although there are examples outside the region using other power sources) and passenger coaches on traditional railroad tracks. These trains typically only operate during the morning and evening peak period to serve work commuters.
Transit market areas
The Twin Cities region uses transit market areas to describe how much demand for transit service there is in each neighborhood or community and what kinds of service can be expected to meet that demand successfully and efficiently. The region determines transit market areas using a transit market index that is based on a combination of measures including population and job density, urban form, and personal vehicle availability.
The Met Council has generally used these tools to evaluate the potential for current transit demand. However, they could also serve as a useful tool for planning future development and thinking about how different approaches to land use and transportation could help or hinder the viability of transit services. The Met Council will be working with its partners to develop this concept further. Furthermore, travel behavior in the region has been evolving since the COVID-19 pandemic and this may mean that methodologies used to create transit market area boundaries need to be re-evaluated more frequently.
Transit market index predicts transit ridership potential
The transit market index is a prediction of transit passenger activity that can be expected based on population, employment, and the built environment. The Met Council, in coordination with regional partners, uses this index to create a transit market area map that communicates the places in the region where different levels of transit service may be appropriate.
The Met Council updated the index calculation methods for the 2050 Transportation Policy Plan using 2023 ridership data as a basis to evaluate how well different factors were able to predict ridership. The calculation uses the following data sets at the census block group to predict boardings and exits:
- Population density
- Employment density looking at both total jobs and jobs by sector
- Household vehicle availability
- The proportion of residents who are renters
- Walkability
- The presence of park-and-ride facilities
These measures were found to have a strong relationship to existing transit demand in our region. Their respective weights in the transit market index formula are determined based on their relative impact on transit demand.
The equation to calculate transit market index for each block group is as follows:
![]()
In addition, the index score for each block group is smoothed based on its neighboring block groups with the level of influence based on how far the center of a block group is from its neighbors. Smaller block groups, typically in urban areas, have their centers closer to their neighbors and would have more influence over each other than rural block groups that are usually much larger.
| Measure | Data source |
| Population | U.S. Census Bureau; American Community Survey 5-year Estimates |
| Employment | U.S. Census Bureau; Longitudinal-Employer Household Dynamics Program; LODES Data based on NAICS code |
| Zero-vehicle households | U.S. Census Bureau; American Community Survey 5-Year Estimates |
| Walkability | OpenTripPlanner |
| Census block group land area | U.S. Census Bureau; TIGER/Line file data |
Figure 9.2: Contributing factors to transit market index
![]()
Population and employment density are the strongest predictors of transit ridership
Population and total employment density have the strongest relationship to transit demand. Higher-density areas usually generate more transit demand. The simple reason is that they have more people living within walking distance of a transit stop, and there are also more destinations like work locations or shopping and services that they can easily access by walking or rolling after disembarking. These areas can also support more frequent transit service, which makes it more convenient to use, and there are more costs associated with driving like paid parking and roadway congestion. As a result, people living and working in these areas are more likely to use transit.
For the transit market index, population and employment densities are each calculated by dividing the total population or total jobs in a census block group by the land area of that block group.
Certain jobs like retail and services support more transit ridership than others
The Met Council analyzed if some kinds of jobs are more or less predictive of transit ridership. The results showed that concentrations of retail and/or service jobs have a stronger relationship with transit ridership. These jobs require on-site work and are also destinations for people running errands and meeting their daily needs. Examples include retail stores, restaurants, and hotels. Other job types like finance, real estate, and warehousing exhibited a negative association to transit ridership when compared to total job density. The Met Council added adjustments for these different job categories into the updated index methods.
Renters are more likely to use transit
Regardless of whether they live in high- or low-density areas, renters generally are more likely to use public transit. The Met Council incorporated an adjustment in the transit market index equation to account for areas that have a higher density of renters. While this is not a large adjustment, it was substantial enough to incorporate into the equation.
More walkable areas generally have higher transit demand
Transit riders usually must walk or roll some distance between a transit stop or station and where they start or end their trip. The index measures walkability using the ratio of the area one can reach in five minutes (about a quarter mile) by walking the street network, and the area that could be reached in five minutes on a straight line unconfined by barriers. Using the street network rather than sidewalks or other walking paths provides a more complete dataset throughout the region as complete sidewalk network data is currently unavailable. Walkability is generally low near freeways, lakes, and other barriers that prevent walking, or in areas with large blocks and disconnected street and sidewalk networks. Walkability is high in areas with a well-connected street grid with smaller block sizes.
The transit market index previously used the number of intersections in a census block group divided by its land area to measure the ease of walking access and identify places that are more transit supportive. However, intersection density alone is not a good measure. For example, many mobile home communities have very high intersection density within the community, but extremely low connectivity to the surrounding area.
Zero-vehicle households can predict higher ridership potential but only at higher densities
For a variety of reasons, transit is the only means of mobility for many people in the region. Areas with high concentrations of people who do not have private vehicles will tend to generate greater demand for transit. The transit market index measures this using the number of households without a vehicle in each block group. This value is then divided by the land area of the block group.
Park-and-ride facilities concentrate transit ridership activity
Park-and-ride facilities with commuter and express or METRO service bring together transit services and riders, particularly in suburban areas. Accounting for their presence in the transit market index methodology improved predictions of ridership activity, particularly in parts of the region with lower population and employment density.
Block groups influence transit demand in neighboring blocks
While the transit market index is calculated for each block group individually, each area’s population, jobs, and other predictors of transit demand can influence ridership activity in neighboring blocks. In other words, multiple connected blocks with high transit demand will have higher overall ridership potential than similar areas that are disconnected. To account for this effect, the transit market area of each block group considers the index values of neighboring block groups.
Transit market index score is the basis for determining transit market areas
Block groups are separated into five transit market areas based on transit market index values. See Table 9.2 for the index value ranges for each market area. Block groups with the highest index values are assigned to Market Area I while those with the lowest index value are Market Area V.
| Transit Market Area | Approximate index score range1 | Propensity to use transit |
| Market Area I2 | >2.59 | Highest potential for transit ridership |
| Market Area II | >1.04 to 2.59 | Approximately 1/2 of ridership potential of Market Area I |
| Market Area III | >0.48 to 1.04 | Approximately 1/2 of ridership potential of Market Area II |
| Market Area IV | >0.21 to 0.48 | Approximately 1/2 of ridership potential of Market Area III |
| Market Area V | <0.21 | Lowest potential for transit ridership |
| Emerging market area | Meets minimum score for next market area up | Varies. Typically higher than surrounding market area. |
| Freestanding town center | Transit market index at least 0.48 | Varies. Typically higher than surrounding market area. |
Notes: (1) The transit market index score range represents typical scores. Some block groups may be categorized as a higher market area because it is surrounded by block groups with the appropriate score or to connect two areas with higher scores. (2) The maximum observed score was 170.25. The data was log-normal distributed with a median score of 0.48 and a log-transformed standard deviation of 2.41
Transit market areas typical characteristics
Transit Market Area I includes the region’s most dense urban centers and corridors
Transit Market Area I has the highest density of population, employment, and lowest personal vehicle availability. Median population density in Transit Market Area I in 2022 was 14.6 residents per acre with some census block groups exhibiting densities as high as 200 residents per acre. Job densities are similarly high, with a median of 3.6 jobs per acre and the top quartile having at least 9.5 jobs per acre. These are typically Urban communities and have a more traditional urban form with a street network laid out in grid form. Market Area I has the potential transit ridership necessary to support the most intensive fixed-route transit service, typically providing higher frequencies, longer operating hours, and more options available outside of peak periods.
Transit Market Area II covers less dense urban neighborhoods and activity centers
Transit Market Area II has high to moderately high population and employment densities, and typically has a traditional street grid comparable to Market Area I. Median population density in Transit Market Area II in 2022 was 8.5 residents per acre. The median job density for the same year was 1.3 jobs per acre and the top quartile of census blocks had at least 3.8 jobs per acre. Much of Market Area II has a Community Designation of Urban or Urban Edge and it can support many of the same types of fixed-route transit as Market Area I, although usually at lower frequencies or shorter service hours.
Transit Market Area III is suburban but still dense enough to support some regular-route service
Transit Market Area III has moderate density but often a less traditional street grid that can limit transit’s effectiveness. It is typically Suburban and large portions of Suburban Edge communities. The median population density of census block groups in Transit Market Area III was 4.8 residents per acre in 2022. The median job density for the same period was 0.9 jobs per acre and the top quartile of census blocks in Transit Market Area III had at least 2.4 jobs per acre. Transit service in this area is primarily commuter express bus service with some fixed-route local service providing basic coverage. General public dial-a-ride services are available where fixed-route service is not viable.
Transit Market Area IV includes low density suburban and suburban edge areas
Transit Market Area IV has lower concentrations of population and employment and a higher rate of personal vehicle ownership. It is primarily composed of Suburban and Suburban Edge communities. The median population density for census block groups in Transit Market Area IV was 3.4 residents per acre. The median job density for the same year was 0.3 jobs per acre and the top quartile of census blocks had at least 0.7 jobs per acre. This market can support peak-period express bus services if a sufficient concentration of commuters likely to use transit are located along a corridor. The low-density and suburban form of development presents challenges to fixed-route transit. General public dial-a-ride services are appropriate in Market Area IV.
Transit Market Area V is generally rural in character with some small communities
Transit Market Area V has very low population and employment densities and tends to be primarily Rural and Agricultural communities. The median population and job densities for census block groups in Transit Market Area V were 0.7 per acre and less than 0.1 per acre, respectively. General public dial-a-ride service may be appropriate here, but due to the very low-intensity land uses, these areas are not well-suited for fixed-route transit.
Emerging market areas have higher activity predictors than their surroundings
The region uses the emerging market area overlay to identify places in Transit Market Areas III and IV with higher potential for transit use than the surrounding area. These areas are currently too small or noncontiguous to support a higher level of transit service. Focusing growth in and around these areas and along corridors connecting them to other areas of higher transit use potential will present good opportunities for future transit service improvements.
Freestanding town centers are dense communities surrounded by rural areas
Freestanding town centers are areas that historically grew independently of Minneapolis and Saint Paul and are still separated from the urban and suburban areas of the metro by rural land. Because of their concentrated downtowns laid out in a traditional urban form, these areas have a transit market index value that would indicate Market Area III or higher. However, their relatively small population and land area, as well as their distance from other transit-supportive land uses, limits the potential for local fixed-route transit. Examples include Stillwater, Hastings, Waconia, and Forest Lake.
Figure 9.3: Transit Market Areas
![]()
Transit Market Area typical service
The Transit Market Areas are typically able to support certain types and amounts of transit service. How transit providers implement transit service depends on several factors including available resources, analysis of local transit demand and existing ridership, complementary and competing services, and others. Detailed analysis of specific communities and locations may determine that other types and levels of service are more appropriate. As travel behaviors continue to evolve in the region after the COVID-19 pandemic and transit providers adjust their services to respond to changes in demand, these descriptions of typical service may also change.
Prioritization factors shown in Table 9.3 are ways to help differentiate when to add service. That a factor isn’t listed doesn’t mean it’s not an issue or present in the area. The table describes typical transit services provided in the different transit market areas.
Table 9.3: Typical service and key planning factors by Transit Market Area
| Market area | Typical transit service1 | Prioritization factors2 |
|---|---|---|
|
Market Area I
|
Transit serves multiple trip purposes and provides the most frequent and longest span of service. Light rail and bus rapid transit serve the highest-demand corridors. There is a dense network of core and supporting local bus routes. Commuter bus and rail terminate at regional activity centers. Transit advantages maintain reliability and improve travel time competitiveness throughout. More than 98% of residents in Market Area I lived within walking distance (about ¼ mile) of a transit route as of 2022. | Access to opportunities Equity Parking availability Ridership productivity |
|
Market Area II
|
Transit serves similar functions to Market Area I but at a lower intensity reflecting lower demand. Limited-stop services like limited-stop local bus, bus rapid transit, and light rail connect major destinations. Core and supporting bus networks are less dense than Market Area 1. Transit advantages are used on high-demand corridors to maintain reliability. About 85% of residents in Market Area II lived within walking distance of a transit route as of 2022. | Access to opportunities Commute corridors Equity Parking availability Ridership productivity |
|
Market Area III
|
Transit fulfills two major roles: commuting to/from major activity centers in Market Areas I and II, and access to suburban activity centers. Suburban local bus and commuter and express bus serving park-and-rides are the primary route types. Transit advantages may be provided on congested highways to improve travel time reliability and competitiveness. Bus rapid transit is used on select corridors connecting major regional activity anchors with adequate demand to support all-day, bi-directional, limited stop service. About 45% of residents in Market Area II lived within walking distance of a transit route as of 2022. | Access opportunities Congested commute corridors Parking availability at destination Coverage Ridership productivity Transportation insecure populations |
|
Market Area IV
|
Transit is mainly focused on commuter service during peak periods as demand can support, generally at park-and-ride type facilities. Some suburban local bus may operate in areas with sufficient demand, typically adjacent to Market Area III. General public dial-a-ride services are appropriate here. A little less than 15% of residents in Market Area IV lived within walking distance of a transit route as of 2022. | Commute corridors Coverage Transportation insecure populations |
|
Market Area V
|
Not well suited for fixed-route service. Primary emphasis is on general public dial-a-ride. Around 2% of residents in Market Area II lived within a walking distance of a transit route as of 2022. | Transportation insecure populations |
| Emerging Market Area | Varies. Typically, similar to surrounding market area but may serve as anchor for higher levels of service such as commuter express, suburban local bus, etc. | |
| Freestanding Town Center | Varies. Potential for local community circulator as demand warrants. Some peak-period commuter express service may be appropriate. |
Notes: (1) The Met Council’s paratransit service, Metro Mobility, provides guaranteed service within ¾ mile of fixed-route transit services throughout the region. Standby paratransit service is provided to rides that begin or end outside of the ADA service area but are within the state-defined Metro Mobility service area. More information about Metro Mobility is available at MetroMobility.org (2) Prioritization factors are listed in alphabetical order, not order of importance.
Transitways are unique services emphasizing customer accessibility and convenience and they require detailed planning processes to ensure specific corridors get appropriate levels of service. This detailed planning work leads to unique applications of transit service design standards and specific types of service unique to each corridor. See the Transitway Design Guidelines section for more information about planning for arterial bus rapid transit, highway bus rapid transit, light rail, and commuter rail.
Demographics
Demographic factors are outside the direct control of transit providers but play a significant role in the design of transit service. With that in mind, the impact of transit investment can indirectly influence these factors by providing access to opportunity. These factors include:
- Auto ownership or the number of cars available in households
- Household income, number of children, and marital status
- Age and disability status
- Job status and unemployment rate
The Met Council also maintains a dataset of Equity Considerations for Place-based Advocacy and Decisions, which provides a crosscutting analysis of these types of factors. More information on these is available on the Met Council’s website.122
Equity
Equity is a key Transportation Policy Plan goal. Transit providers are required to analyze impacts of any major service or fare changes on people of color, low-income residents, and people with limited English proficiency by federal Title VI requirements implementing the Civil Rights Act of 1964123 and environmental justice guidance.
Providing safe, affordable, and reliable transportation increases opportunity. Transit services and programs should be built to equitably benefit all, especially underserved communities, including people who identify as Black, Indigenous, and people of color; people experiencing low wealth; women; people who have a disability; people identifying as LGBTQ; youth; and older adults. Transit equity requires identifying and addressing injustices and building actionable pathways to create a fair and more just future.
Transit decisions can impact the ability of people in underserved communities to find and keep jobs, reach medical care, access educational opportunities and affordable housing, and develop and maintain social connections, among other impacts. Transit services and investments can reduce inequalities that contribute to racial, environmental, and economic disparities.
Transit planners and operators have an essential role and responsibility to examine all decisions impacting our region’s access to quality transit, reduce existing disparities, and prevent further inequities by:
- Reviewing and revising policies
- Seeking partnerships with other responsible institutions
- Improving planning and operational practices
Access to destinations
Access to destinations is a measure of how well the transit network is meeting the travel needs of current and potential riders. People use transit to reach destinations like work, school, or shopping, among many others. Accessibility measures how many of these destinations transit users can reach using the transit network within a certain amount of time. This is related to but different from mobility, which measures how fast or far people can travel on the transportation network. By considering the destinations that people can access using that network, measures of accessibility provide a more complete picture of how useful the network is to its users. The Met Council views accessibility as an important tool to measure and evaluate the regional transportation network and land use patterns. The Met Council and its partners are engaged in ongoing efforts to develop and implement regionally consistent measures of access to destinations.
Local land use, urban design, and transportation networks
Land use and urban design factors that fall within the control of local governments, such as land use mix, density, and infrastructure design, have significant influence on transit service design and its ability to succeed. To be successful, transit needs people to ride and places to which they can (and want to) easily walk. Local governments and transit agencies need to work together to best match transit service with local land use and maximize the opportunities for success of the transit system. For communities that desire more transit service, local governments should plan for and help facilitate transit-supportive land use. In many suburban communities, these changes are happening, like with station-area planning along light rail and bus rapid transit corridors. The following factors are the primary components of effective local transit service. Express and commuter services are discussed separately.
Design and build walkable, pedestrian-friendly environments along transit routes
All transit users are pedestrians for at least some portion of the beginning and end of their trip. An accessible, pedestrian-friendly environment encourages transit use by providing a comfortable walking environment and minimizing the walking distance from the transit stop to front doors. Elements that achieve these aims include:
- Complete sidewalk networks
- Plenty of destinations to walk to
- Buildings along the sidewalks
- Street parking only, no parking lots or at least behind buildings
- Boulevard trees to provide shade and/or wind breaks
- Shortened street crossings (bump outs, narrower lanes, etc.)
- Slower traffic speeds
- No right turns at red lights
- Many more
Multiple good resources on how to design walkable, accessible pedestrian environments are available, such as the National Associate of City Transportation Officials Urban Street Design Guide or MnDOT’s Complete Streets Handbook. Accessible pedestrian pathways are generally built and maintained by the authority that owns a roadway, typically cities, counties, or the state. Maintenance, especially winter maintenance, is essential for year-round pedestrian use and access to transit.
Figure 9.4: Transit-supportive stop placement
![]()
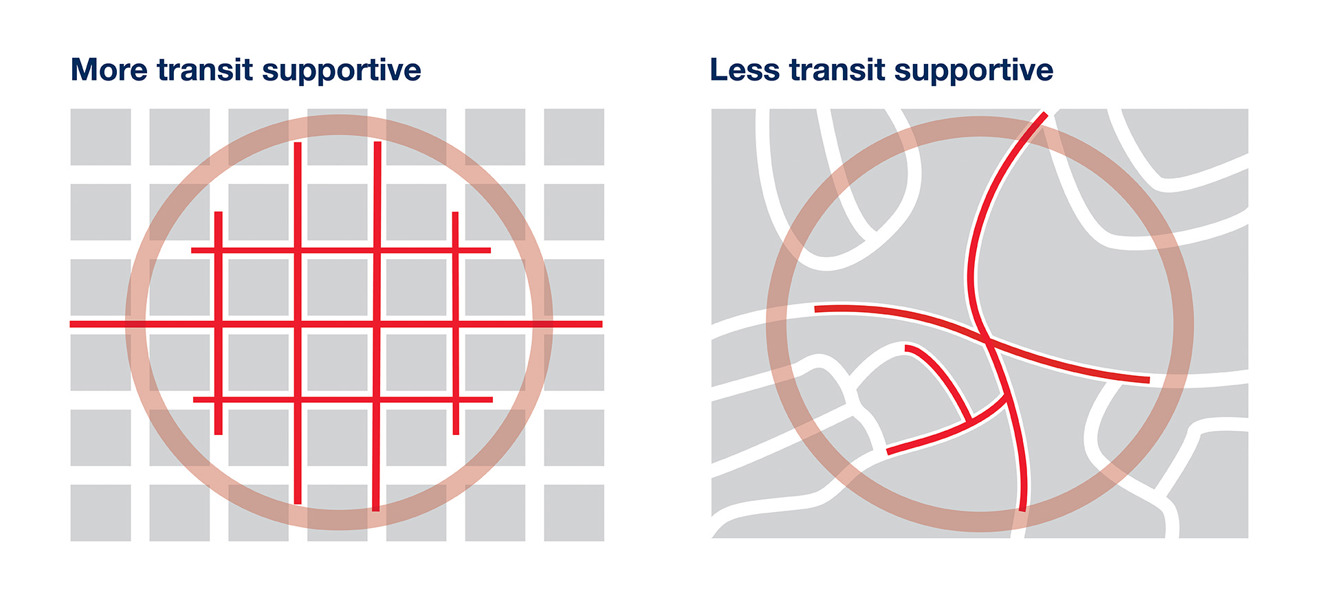
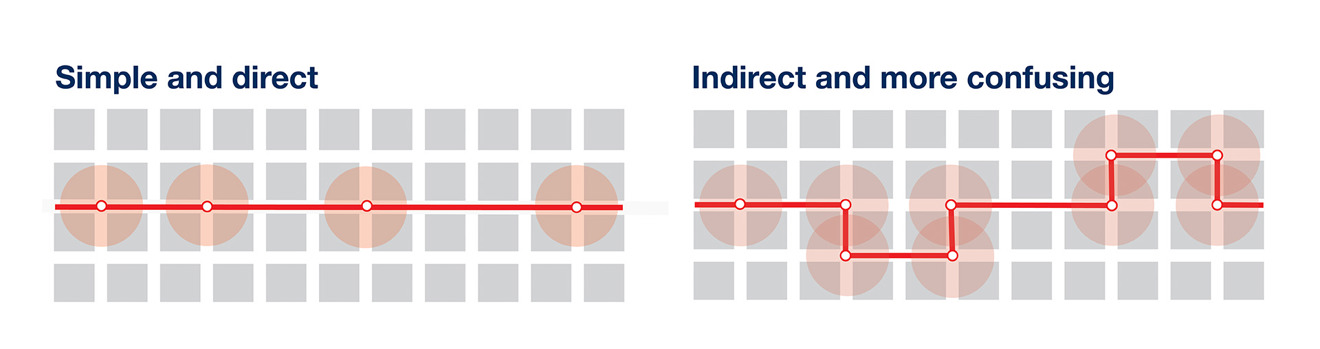
Build and maintain an interconnected street network that maximizes pedestrian and bicycle access and supports simple route design
An interconnected street network minimizes barriers and maximizes the area that is accessible within a short walk or bike to a transit stop, allowing each stop to serve more people. In addition, it supports the design of simple, direct routes that are efficient and easy to understand.
Figure 9.5: Transit-supportive street network
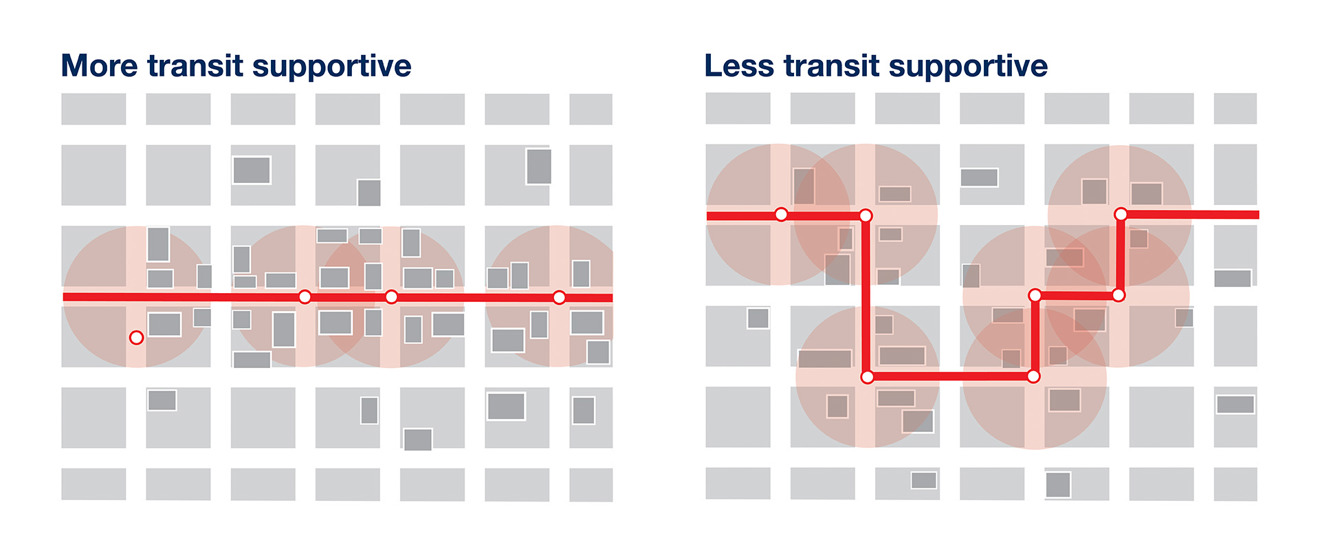
Plan for linear growth in nodes along corridors
A linear pattern of development along corridors is easier to serve with transit. Transit routes that are linear and consistent are the most effective to provide and easier for customers to understand. This also requires coordination across community boundaries.
Figure 9.6: Transit-supportive development pattern
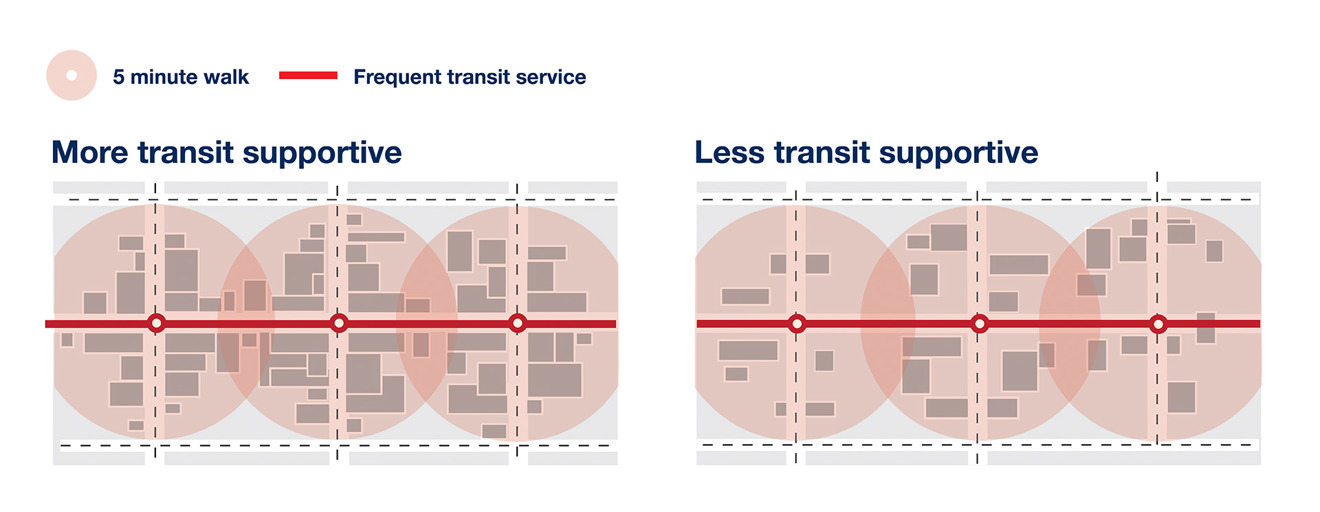
Encourage population and activity density
Population and activity (such as shopping, schools, or cultural amenities) density supports transit because it provides more people and activities within easy walking distance of stops. Additionally, people living in dense areas are more likely to use transit because more frequent and reliable transit options can be provided that are more competitive with driving, especially when accounting for the time and cost of parking.
The Met Council’s research to update its Transit Market Index, which measures an area’s propensity to support ridership, found job and population density are the main drivers of transit ridership currently, along with walkability. In 2022, Transit Market Area I had a median of 14.6 residents per acre and 3.6 jobs per acre with the top quartile having at least 9.5 jobs per acre. While an entire community does not need to exhibit these densities to have basic transit service, planning for these densities within a half mile of transit stops is essential for producing ridership that can support quality, frequent transit service.
Figure 9.7: Transit-supportive density
Allow and encourage a mix of different uses along transit lines
Transit is most effective when it serves a variety of trip purposes and destinations. Mixed-use development patterns encourage travel patterns with many origins and destinations throughout the day, making transit more effective and easier to provide for a variety of purposes. Some land use types were shown in Met Council’s work to update the Transit Market Index to be more supportive of transit ridership than others including rental housing, retail and hospitality, and large institutions like schools or hospitals (assuming the surrounding environment is easily walkable).
Figure 9.8: Transit-supportive mix of uses
![]()
Provide for transit advantages and customer and support facilities on streets with transit
The design of streets that transit routes operate on can do a great deal to support or hinder ridership. Transit advantages such as bus-only lanes, transit signal priority, or bump outs at transit stops help transit vehicles maintain faster average speeds. This means a faster trip for riders and potentially more frequent transit service at less cost to the transit agency. Space should also be left for customer facilities such as bus stops, shelters, or even transit centers in busier locations with multiple routes. Finally, support facilities are vital to transit operations. Agencies that build and maintain roadways should coordinate with transit agencies on where they need break facilities for drivers or utilities to support customer facility features like heating.
Multiple useful guidance documents are available for designing streets to support transit operations, first and foremost being those generated by the regional transit providers themselves. Other documents such as the National Association of City Transportation Official’s Transit Street Design Guide can also be good sources of information. It is recommended that roadway owning agencies always coordinate with transit agencies when designing roads that currently carry or are likely to carry transit service in the future.
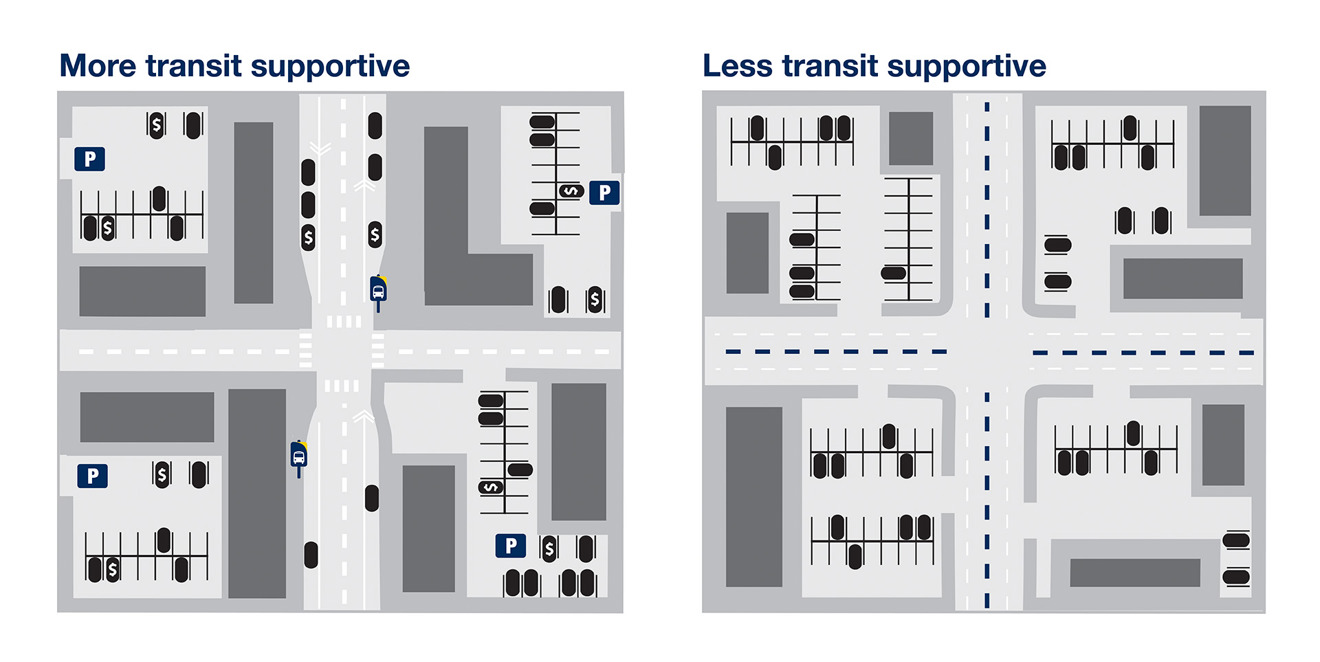
Support travel options that encourage or complement transit use
Transit is more effective in areas where the cost of driving and parking are greater, or at least comparable to the cost of using transit, and alternatives like car-sharing, bicycling, and walking are available and convenient.
Figure 9.9: Transit-supportive travel options
The factors listed above describe the general relationship between local land use decisions and transit planning. More details on these factors and the considerations for local communities on land use planning around transit are available in the Land Use Policy Plan.
Transit service route and network design principles
The quality and design of transit service is an important part of the success of transit. Regional transit providers must weigh the potential benefits of transit investments against the costs to best manage the system cost-effectively and efficiently. This applies to times when the transit system is stable, when the transit system is expanding, and when the transit system is facing cuts. There are also different factors for the design of local transit service and express and commuter transit service.
Local route and network design
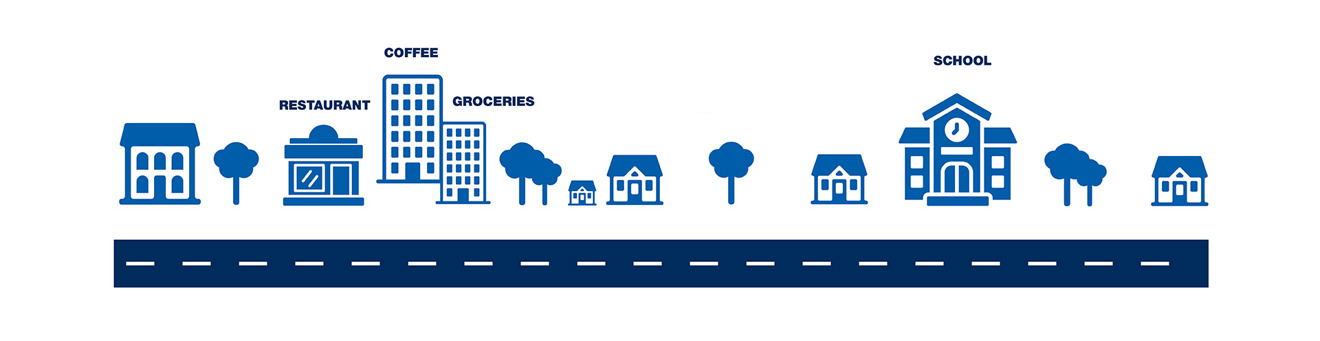
Serve a variety of trip purposes and destinations
Transit will generate higher ridership and more balanced passenger loads if it is designed to serve a number of different trip purposes along the route and throughout the day.
Figure 9.10: Transit that serves variety of trip purposes and destinations
Design routes with strong anchors at both ends
Transit is more efficient with balanced passenger loads in each direction. Major destinations at each end help to distribute demand evenly and limit overcrowding of vehicles and oversupply of service.
Figure 9.11: Transit designs that create strong anchors at both ends
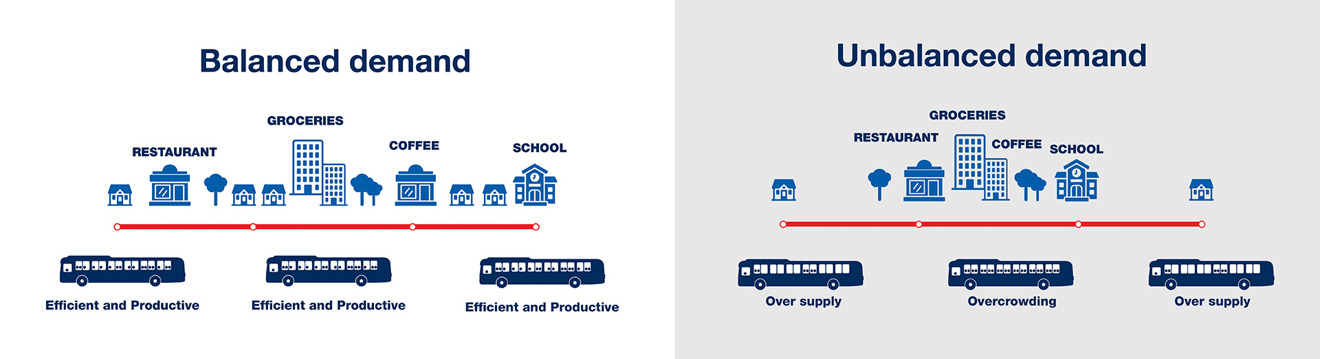
Match level of service to demand
Transit is more effective if the type and amount of service provided matches the demand for transit. This allows providers to get the most out of high-demand areas while still serving lower-demand areas.
Figure 9.12: Transit service that matches level of demand
Design simple, direct routes
Transit service is more efficient, reliable, and easier for customers to understand when routes are designed in simple, linear patterns without complicated paths.
Figure 9.13: Transit designs that support simple, direct routes
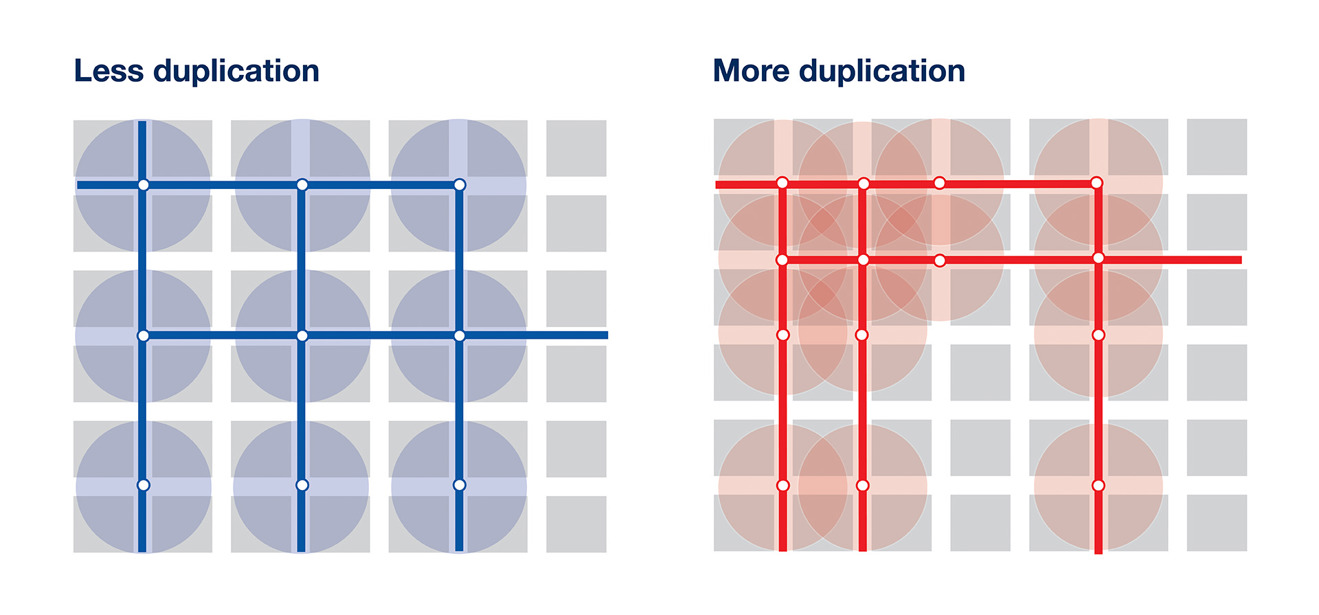
Avoid duplication of service
Routes should be spaced far enough apart so that they do not compete with one another for riders at the expense of service coverage in other areas.
Figure 9.14: Transit design that avoid duplication of service
Provide useful customer information and comfortable amenities
Transit ridership grows and the user experience is better when customers can easily understand the system and are comfortable while waiting at or leaving a stop and riding on a bus or train.
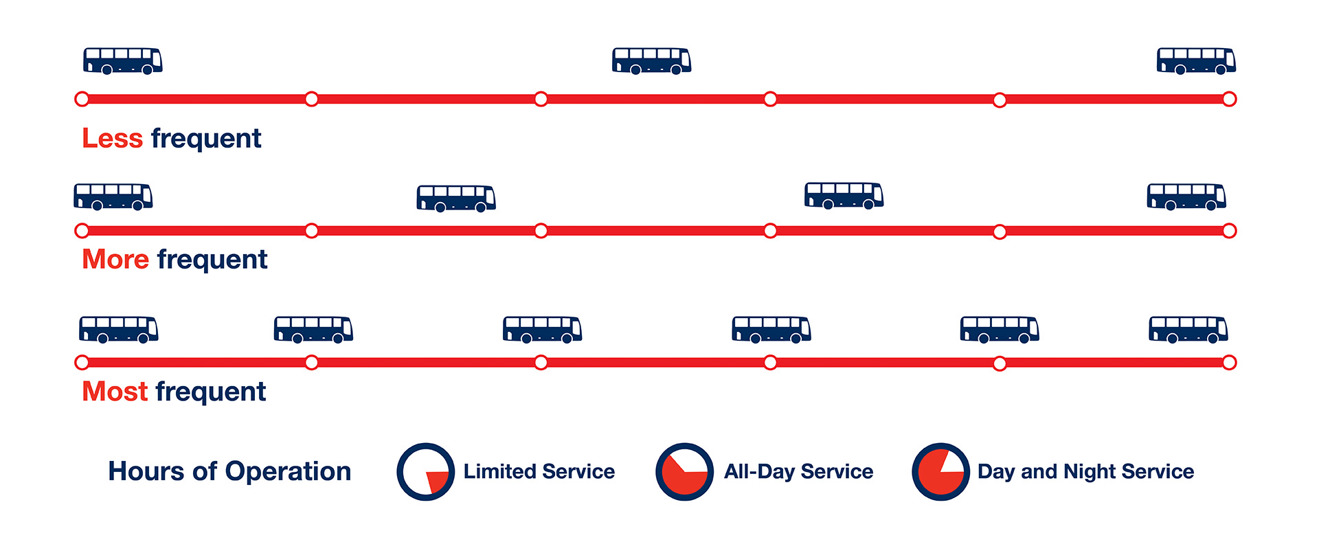
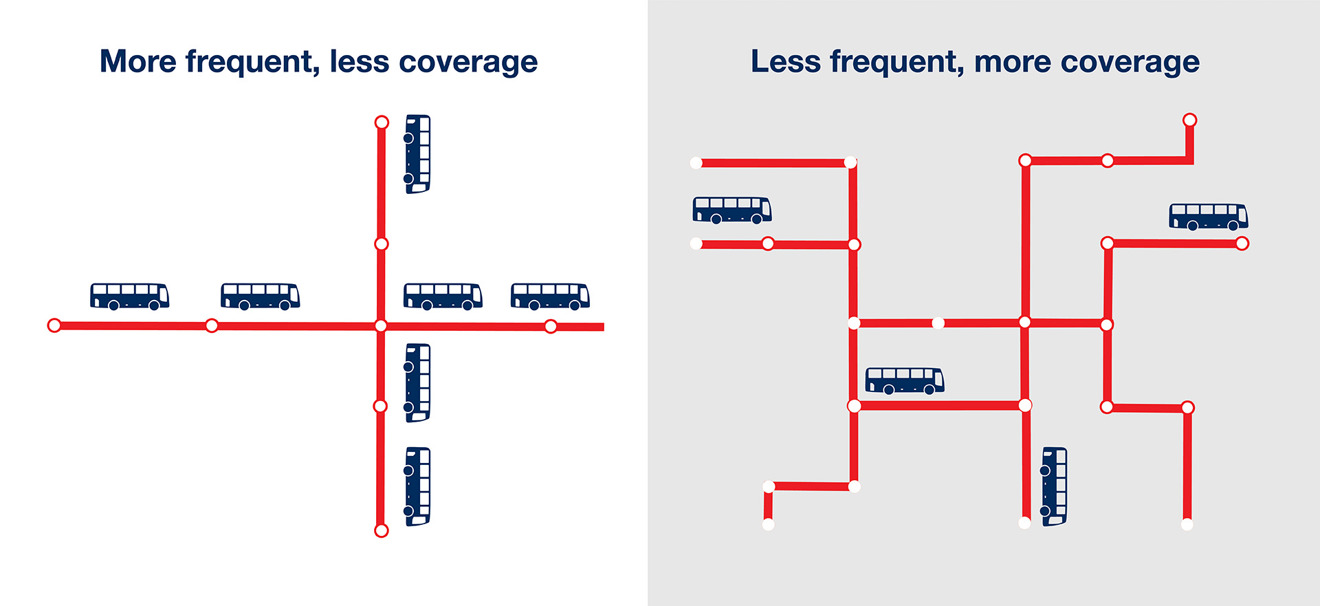
Balance frequency and coverage
An effective transit network finds a balance between providing fast, frequent routes that offer more convenience, and providing coverage to more area but with infrequent, less-convenient service.
Figure 9.15: Transit designs that balance frequency and coverage
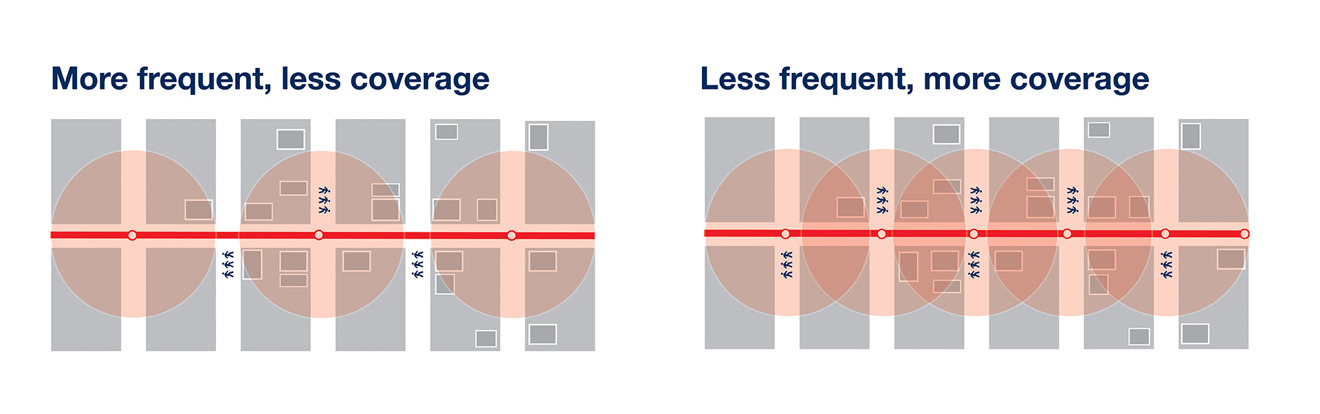
Balance walking distance and travel speed
Routes with more stops provide shorter walks to transit but are slower and can have less reliable travel speeds. A transit network needs to balance speed and access.
Figure 9.16: Transit designs that balance walking distance and travel speed
Commuter and express route design
The factors that guide commuter and express route design are somewhat different from those for local routes. These routes are focused on providing fast, reliable trips into major regional centers. The most important factors for express service success are high-density origins and destinations at both ends of the route (like at a park-and-ride and downtown), and demand management that balances parking supply and cost with the demand for parking and access to transit. The level and location of congestion can also be a substantial factor in the success of express bus services.
![]()
Transit Design Guidelines
These guidelines are split into two categories: local and express bus service, and transitways. Local and express bus service guidelines are organized by transit market area and/or route type. They provide general direction on fundamental aspects of transit service design, like frequency, to ensure regional consistency. There are often exceptions to these guidelines based on local circumstances and available funding.
Transitways are unique services with high frequency and high capacity that require extensive detailed analysis and planning processes. The guidelines in this appendix are informed by the Regional Transitway Guidelines,124 which the Met Council developed with its partners. The guidelines provide technical guidance based in best practices that support consistent, equitable, and efficient development and operation of transitways with the ultimate goal of delivering an effective, integrated, and user-friendly transit system throughout the Twin Cities region.
Local and commuter and express bus service design guidelines
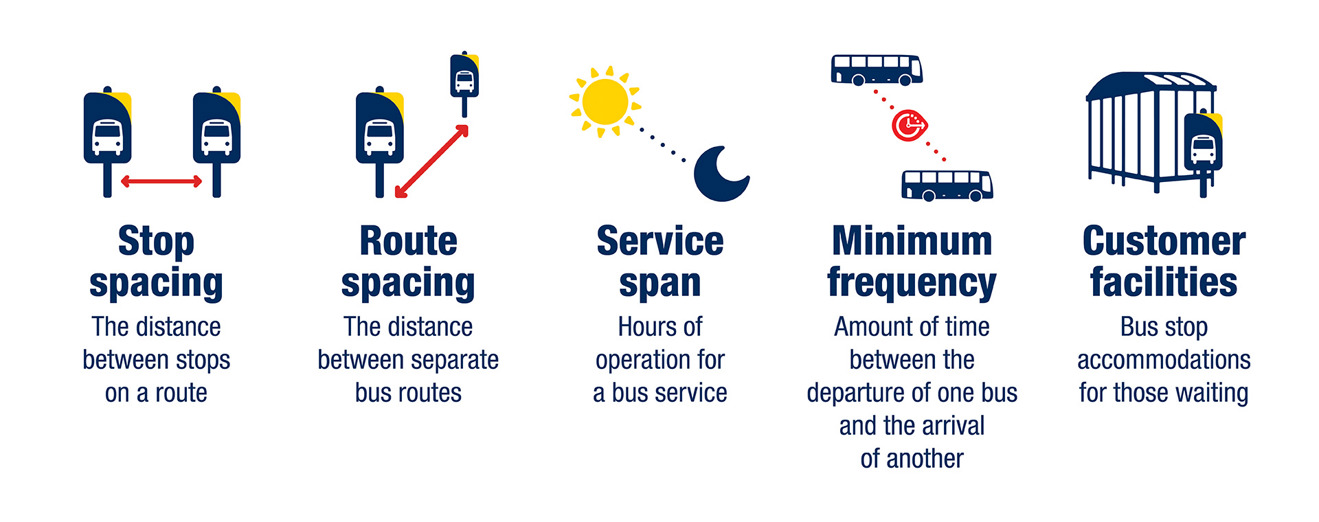
Local and express bus service includes core local bus, supporting local bus, suburban local bus, commuter express bus, and reverse-commute service types. These types of transit provide most of the service throughout the Twin Cities region currently. The design guidelines include stop spacing, route spacing, span of service, minimum frequency, and customer facility features.
Figure 9.17: Bus service design guidelines
Stop spacing
Stop spacing must balance easy walking access to transit and travel speeds. More stops spaced closer together reduce walking distances to transit but add travel time. A general guideline in transit planning is that most people are willing to walk up to a 1/4 mile, about five minutes typically, for local bus service and 1/2 mile for limited stop bus service.
Table 9.4 shows the recommended stop spacing guidelines that balance access to transit and service speed based on the route type and purpose.
Table 9.4: Local and express route spacing guidelines
| Route type | Typical stop spacing |
|---|---|
| Core local bus1 | 1/8 to 1/4 mile |
| Supporting local bus | 1/8 to 1/4 mile |
| Suburban local bus | 1/8 to 1/2 mile |
| Commuter and express and reverse commute bus | Market specific2 |
Notes: These are guidelines, not minimums or maximums. Situations may call for exceptions to these guidelines, such as within a central business district or near major traffic generators.(1) Local routes with limited stop service will have a typical stop spacing of 1/4 to 1/2 mile. (2) In downtowns and local pickup zones, stop spacing should follow local route standards. Along limited-stop or no-stop route segments, stop spacing will be much greater
Route spacing
Route spacing refers to the distance between parallel routes. Routes that are spaced too close together will have overlapping service areas and compete for riders, reducing the productivity of both routes. Routes spaced too far apart will lead to coverage gaps. Generally, areas with lower transit demand will have routes spaced farther apart. Table 9.5 shows the route spacing guidelines by route type and market area. Commuter express bus and reverse-commute routes should be determined on a case-by-case basis according to specific transit market conditions.
Table 9.5: Local bus route spacing guidelines by route type and Transit Market Area
| Route type | Market Area I | Market Area II | Market Area III | Market Area IV | Market Area V |
|---|---|---|---|---|---|
| Core local bus1 | 1/2 mile | 1 mile | Specific2 | NA | NA |
| Supporting local bus | 1 mile | 1-2 miles | Specific2 | NA | NA |
| Suburban local bus | NA | 2 miles | Specific2 | Specific2 | NA |
Notes: (1) Local limited-stop routes will be located on high-demand corridors. (2) Specific means that route structure will be adapted to the demographics, geography, and land use of a specific area.
Service span
Service span is the times of the day that a route is running. Service span guidelines are typically based on a route type’s role in the overall transit network. Route types designed to primarily serve commuters mostly operate during peak periods, while route types that serve a broader set of trip purposes usually have a longer service span. Table 9.6 shows the recommended hours of service by route type.
Table 9.6: Local and express bus route span of service guidelines
| Route type | Weekdays | Weekends and holidays | ||||
|---|---|---|---|---|---|---|
| Peak | Midday | Evening | Owl | |||
| Core local bus1 | ||||||
| Supporting local bus | ||||||
| Suburban local | ||||||
| Commuter and express bus | ||||||
Always provided ![]() Occasionally provided
Occasionally provided ![]() Provided as demand warrants
Provided as demand warrants ![]()
Notes: Weekday service periods are defined as follows: peak – 6:00 a.m. to 9:00 a.m. and 3 p.m. to 6:30 p.m.; midday – 9:00 a.m. to 3:00 p.m.; evening – 6:30 p.m. to 1:30 a.m.; owl – 1:30 a.m. to 5:00 a.m. Weekends include all service periods on either day. Sunday also includes holiday service. (1) Local limited-stop routes operate primarily during the weekday peak period
Minimum frequency
Minimum frequency is the most amount of scheduled time between when one transit vehicle departs and the next arrives on a given route in the same direction. Routes types serving areas of higher transit demand will tend to have higher frequencies. Table 9.7 shows the recommended minimum frequency by route type and market area.
Table 9.7: Local and express bus minimum frequency guidelines by Transit Market Area, headways in minutes
| Route type | Market Area I | Market Area II | Market Area III | Market Area IV | Market Area V |
|---|---|---|---|---|---|
| Core local bus1 | Peak - 15 Off-Peak - 30 Weekend - 30 |
Peak - 30 Off-Peak - 60 Weekend - 60 |
Peak - 60 Off-Peak - 60 Weekend - 60 |
NA |
NA |
| Supporting local bus | Peak - 30 Off-Peak - 30 Weekend - 30 |
Peak – 30 Off-Peak - 60 Weekend – 60 |
Peak - 60 Off-Peak - 60 Weekend - 60 |
NA | NA |
| Suburban local bus | NA | Peak - 30 Off-Peak - 60 Weekend - 60 |
Peak - 120 Off-Peak - 120 Weekend - 120 |
NA | NA |
| Commuter and express bus | Peak -30 | Peak -30 | Peak - 3 trips | Peak - 3 trips | NA |
| Reverse commute bus | Peak - 3 trips | Peak - 3 trips | Peak - 2 trips | Peak - 2 trips | NA |
Notes: These guidelines apply primarily to the peak direction. Additional service may be added as demand warrants.
Coverage service
The region identified several service functions through the Transit Service Allocation Study that are not related to creating high ridership productivity but may deserve investment. Coverage routes that do not meet the productivity guidelines in Table 9.7 may serve another regional transportation goals by serving one of the following roles:
- Geographic coverage – A route may be considered fulfilling this purpose if it provides the only transit service in the area. When designing these routes, transit providers should place stops in locations with transit-supportive densities of residents and/or jobs per acre. Prioritize this type of service in areas with a higher proportion of populations more likely to rely on transit than the region as a whole, such as people with low incomes; people who identify as Black, Indigenous, or people of color; people with disabilities; or households with low-vehicle access.
- Job-access coverage – A route may be considered fulfilling this purpose if it provides access to one or more local job centers. An area may be considered a local job center for this purpose if it has more than 3,500 jobs total and a job density of five jobs per acre or more. The route should also serve populations that are employed in these locations or provide connections with other transit routes that serve those populations and result in a reasonable travel time.
Job access routes provide the best benefit when serving locations where at least one-third of jobs within 1/4 mile of stops are held by residents who are likely to rely on transit as their main means of travel. Routing and stops serving more entry-level or low-wage jobs can be considered a strength when designing job access routes. Other elements that contribute to the success of job access routes may include timing service with shift changes, the availability of free parking, where employees are coming from, and pedestrian access to transit.
Customer facility features
Regional transit providers offer a range of features at customer facilities, based on factors like how many people use those facilities each day, to improve the customer experience and meet customer needs. With limited resources for improving the more than 13,000+ bus stops and customer facilities in the region, transit agencies must prioritize the locations where investments are made and prioritize the types of facilities it can install and maintain across the system. For the purposes of regional guidelines, the Met Council groups these features into two categories, standard features and optional features, based on the type of customer facility. Two features are standard for all customer facilities:
- Pedestrian connections and ADA accessibility
- Basic stop information
Pedestrian connections and ADA accessibility must be provided at all transit stops
An accessible path to and boarding area at customer facilities are essential. The Met Council is working toward improving older bus stops that do not meet ADA requirements and current best practices. Local governments and transit providers should coordinate to ensure that all regular-route transit stops are accessible. Coordination of maintenance is particularly important in winter when snow and ice can impede access to transit for all customers. Local governments’ urban design decisions can help make customer facilities accessible, such as by developing an interconnected grid of sidewalks and paths. Pedestrian accessibility is also critical within and adjacent to park-and-rides. Ensuring pleasant paths between bus stops, parking areas, and surrounding land uses is critical to integrating park-and-ride facilities with surrounding communities.
Basic stop information should be provided at all transit stops
Stop information at transit facilities is an important component of transit service. Basic stop information includes the routes serving the stop, stop number, and access to Nextrip real-time information. This information increases customer satisfaction and reassures them that they can depend on transit.
Transit operators may provide other information like a map of routes serving a stop and their schedules or dynamic real-time arrival and departure updates and customer announcements. New technologies play an important role in improving customer information and the Met Council will continue to expand a network of customer information systems using proven and cost-efficient technology at key locations, like transit stations and centers, online, and on mobile devices.
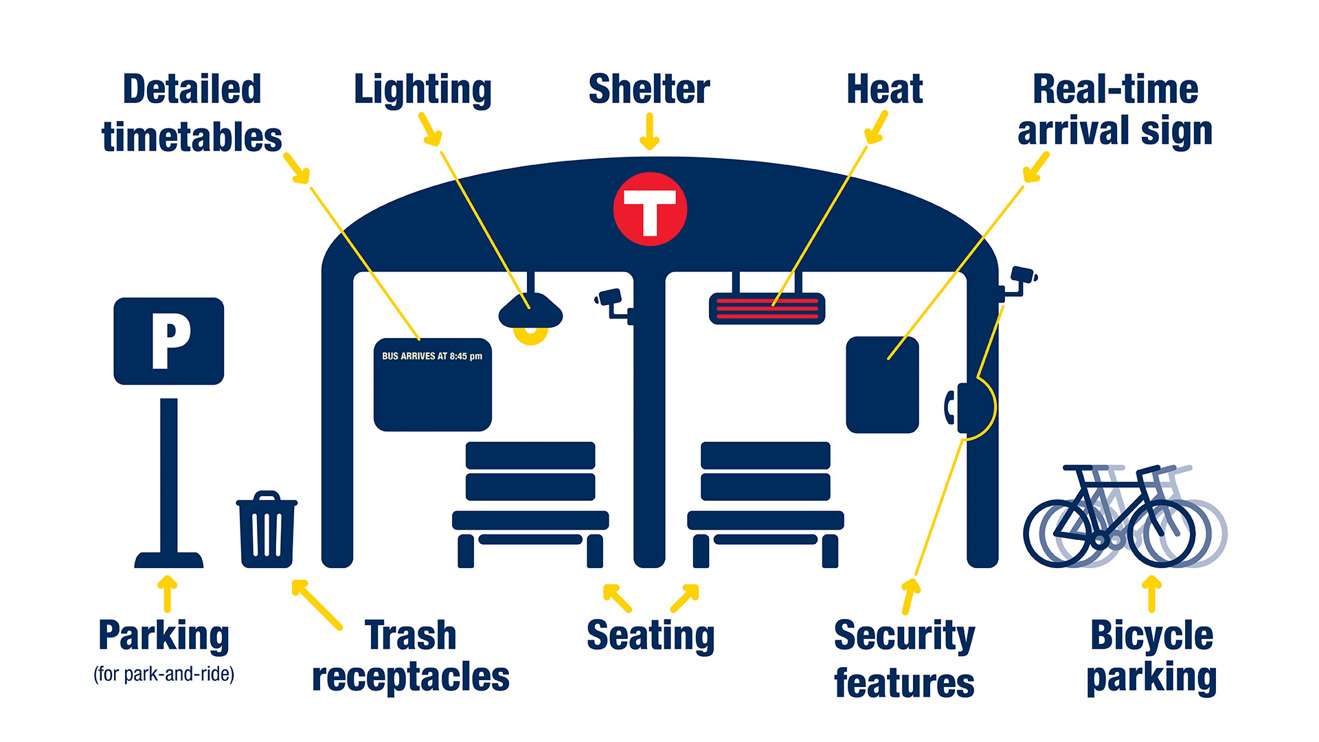
Bus stop features vary based on usage and other factors
Beyond features that are required at all transit stops (pedestrian and ADA access and basic stop information) transit operators provide a range of features at bus stops depending on how well the stops are used, the types of bus routes serving the stop, demographics of the surrounding area, and other factors. Features that transit providers might provide at bus stops include, but are not limited to:
- Shelter
- Detailed timetables
- Real-time arrival sign
- Seating
- Lighting
- Heat
- Trash receptacles
- Security features like cameras or call boxes
- Bicycle parking or secure bicycle storage
- Parking (park-and-ride)
Transit agencies provide shelters at higher demand stops and based on local circumstances
Sheltered waiting places for transit customers come in many forms, including an interior waiting space or alcove in a building, a park-and-ride with a sheltered waiting area, a transit center building, a shelter at a rail or bus rapid transit station, or a shelter at a bus stop. Shelters provide a package of features for transit customers: weather protection, detailed schedules, typically a bench, and sometimes lighting and radiant heaters. Shelters also create an identifiable waiting place for transit customers. Shelters are typically provided by the transit agency, though sometimes by local government or property owners. Metro Transit has guidelines for prioritizing shelter locations as do other transit providers in the region.
Parking at transit customer facilities
Transit operators provide parking at transit facilities to aggregate rider demand in parts of the region with lower density and less walkability. These facilities are often referred to as park-and-ride facilities. However, there is a wide variety in the amount of parking provided from a couple dozen spaces on a surface lot to hundreds of spaces in large parking structures. Parking may be owned by a transit agency, leased by them, or provided by a partner agency. Generally speaking, transit agencies try to scale the amount of parking provided to rider demand.
Transit centers
Transit centers are locations where two or more transit routes connect and that provide comfortable and convenient locations for customers to connect between routes. They typically have multiple bus stops and bus service is timed for easy transfers. Buses also frequently layover with scheduled recovery time and bus operators may take scheduled breaks at transit centers. Transit centers typically provide customers with the following features beyond those standard to all transit stops:
- Shelter
- Detailed transit information like timetables
- Real-time arrival sign
- Seating
- Lighting
- Heat
- Trash receptacles
Transit providers may also provide other features to enhance their experience such as:
- Security features like cameras or call boxes
- Bicycle parking or secure bicycle storage
- Parking (park-and-ride)
Figure 9.18: Customer facilities
Mobility hubs help people connect between different travel modes
A mobility hub is a public gathering space or transportation facility where customers can get information on and make connections between multiple transportation options. Hubs help people easily switch between travel options and fill the gaps between different types of travel. Hubs often include features like additional passenger amenities, real-time customer information, or first- and last-mile travel options like bike share, scooters, or car share.
While transit customer facilities make natural mobility hubs, they are not exclusive to transit. Met Council’s Mobility Hub Planning and Implementation Guidebook provides comprehensive technical assistance to transportation partners for implementing mobility hubs across the Twin Cities region.
Transitway design guidelines
This subsection includes minimum design elements for transitways. The Met Council and its partners developed Regional Transitway Guidelines to ensure transitway projects are implemented in a consistent, equitable, and efficient manner throughout the region. One of the key elements of the guidelines was establishing a consistent definition of a transitway based on the different modes under development in the region. While the Regional Transitway Guidelines have not been updated recently, the key elements of minimum definitions have continued to apply to transitway definitions, including expanding the discussion to new modes as they are developed.
There are five transitway modes in the region:
- Commuter rail
- Light rail transit
- Dedicated bus rapid transit
- Highway bus rapid transit
- Arterial bus rapid transit
This subsection does not directly address express buses with transit advantages or modern streetcars. Each transitway, regardless of mode, should include the minimum elements identified in the guidelines.
Multiple agencies work together to plan and implement transitways. Local governments, particularly counties and regional railroad authorities, typically lead transitway corridor planning and recommend locally preferred alternatives. The lead agency, in consultation with advisory groups, is responsible for initiating discussions and negotiations with funding partners for any deviations from the guidelines. Local land use authorities and transit operating agencies also need to be involved in these discussions. The transitway design guidelines apply whenever investments are being studied, planned, and made in a transitway corridor identified in the Transportation Policy Plan.
Stop spacing
Transitways are designed to provide faster, more reliable trips than local service. One of the ways this is done is by generally having less frequent stops. Table 9.8 presents the typical and minimum stop spacing by transitway mode. Transit agencies may provide wider spacing for segments of a route based on analysis and public engagement from the corridor planning process.
Table 9.8: Transitway typical and minimum station spacing, in miles
| Transitway type | Typical | Minimum |
|---|---|---|
| Arterial bus rapid transit | ½ | 1⁄4 |
| Highway bus rapid transit | 2 | ½ |
| Dedicated bus rapid transit | 1 | ½ |
| Light rail transit | 1 | ½ |
| Commuter rail | 7+ | 5 |
Notes: stations may be spaced closer together within central business districts or downtowns or at key transfer locations.
The Regional Transitway Guidelines provide additional detailed guidance on different aspects of station site selection such as market analysis, land use factors, and adding new stations to a line.
Minimum service span
The region considers 18 hours of service as the general minimum service span for all transitway modes except for commuter rail, which has a minimum number of trips. Table 9.9 provides the minimum service span by transitway mode.
Table 9.9: Transitways minimum service span, In hours per day
| Route type | Weekdays | Weekends |
|---|---|---|
| Bus rapid transit1 | 18 | 18 |
| Light rail transit | 18 | 18 |
| Commuter rail | 10 trips2 | N/A |
Notes: 1) This includes all bus rapid transit modes (arterial, highway, and dedicated). 2) Commuter rail minimum is five trips per peak period. There are two peak periods per day, so the total is 10 trips.
Minimum frequency
Transitways provide frequent service that reduces waiting time and improves transferring from other routes, so riders do not need to plan as much. Generally speaking, this means 15-minute headways or better although less frequent service may be provided during very low demand periods. These minimums also assume adequate staffing levels to maintain them. Again, commuter rail is an exception to the service is oriented toward providing high-capacity commute service.
Table 9.10: Transitway service frequency minimums, in minutes
| Route type | Weekdays | Weekends | ||||
|---|---|---|---|---|---|---|
| Peak | Midday | Evening | Early / Late |
Day / Evening |
Early / Late |
|
| Arterial bus rapid transit1 | 15 | 15 | 15 | 30 | 15 | 30 |
| Highway bus rapid transit | 15 | 15 | Specific2 | Specific2 | Specific2 | Specific2 |
| Dedicated bus rapid transit | 15 | 15 | 15 | 30-60 | 15 | 30-60 |
| Light rail transit | 15 | 15 | 15 | 30 | 15 | 30-60 |
| Commuter rail | 5 trips | Specific2 | Specific2 | Specific2 | Specific2 | Specific2 |
Notes: Weekday service periods are defined as follows: peak – 6:00 a.m. to 9:00 a.m. and 3 p.m. to 6:30 p.m.; midday – 9:00 a.m. to 3:00 p.m.; evening – 6:30 p.m. to 1:30 a.m.; owl – 1:30 a.m. to 5:00 a.m. Weekends include all service periods on either day. Sunday also includes holiday service. Weekends cover other reduced service days like holidays. (1) Frequency for bus rapid transit is combined with local routes for arterial bus rapid transit and express routes for Highway bus rapid transit. (2) Specific service frequency is based on demand.
Customer facilities
Transitway customer facilities should fit in with and enhance the neighborhoods surrounding them. Transitway stations and support facilities should be functional, attractive, cost-effective, and generally consistent by transitway mode across the region. All transitway customer facilities should have the following features at minimum:
- Pedestrian and ADA access
- Off-board fare collection that integrates with regional fare system
- Station platforms
- Waiting shelters
- Radiant heat and passive cooling
- Real-time rider information
- Seating
- Lighting
- Security features
- Trash receptacles
- Passenger information
- Wayfinding
Stations may have additional features based on the corridor planning process and input from public engagement efforts:
- Transit layover facilities
- Parking (park-and ride)
- Bike parking or secure storage
- Enclosures
- Elevators or escalators
- Concessions
- Acoustic treatments
- Short-term pick-up/drop-off
- Local betterments
Additional detailed guidelines on rider and support facilities are available in the Regional Transitway Guidelines on topics like station and support facility design principles or enclosures at stations.
Branding standards for vehicles and stations
Transitways should be easily recognized based on the unique look of stations and vehicles compared to local service and route-naming conventions. System brand elements for all light rail and bus rapid transit services should be consistent and visible at all stations. Transitway and system brands should take precedence over provider brand.
Vehicle standards
The most important aspects of branding on transitway vehicles are the system brand, line name/route identity, and where to find additional service information. These aspects should be included on each vehicle. Vehicles should meet the following minimum branding requirements:
- Bus rapid transit vehicles should be sleek, modern, premium-style buses appropriately sized to accommodate rider demand and configured to service characteristics and rider comfort.
- Light rail transit vehicles should be compatible with existing rail and infrastructure systems while also being configured to service characteristics and rider comfort.
Station and signage branding
The most important aspects of the branding and identity at transitway stations are the system brand, line identity, and station name. These aspects should be included at each station. Station names should be easily recognizable, distinct from other stations, and reference local landmarks. Names will be selected by the Met Council with input from the lead agency and impacted communities.
Route naming
All transitway routes should have METRO system branding in their names. Arterial bus rapid transit lines will use letter names for lines. Light rail, dedicated bus rapid transit, and highway bus rapid transit lines will use color names for lines.
Regional Transit Performance Guidelines
The region uses performance guidelines to evaluate the relative productivity and efficiency of transit services provided. To be responsive, a transit system must consistently measure and adjust service in unproductive routes and address insufficient service in productive areas. These guidelines serve as indicators of route performance and call attention to routes that may need to be adjusted. The use of multiple performance measures provides better insight into the operational and financial performance of individual services and allows transit providers to balance the cost and ridership of each route with its role in the regional transit network. A recent state statute requires the Met Council to develop route performance standards for farebox recovery ratio, which will be explored in a Work Program item on the Comprehensive Transit Financial Report. Additional refinements to performance standards will also be explored through this effort in collaboration with regional transit providers.
Productivity
Productivity is the number of passengers per in-service hour. A high productivity means a route is serving more people with the resources provided. The passengers per in-service-hour standard establishes a minimum threshold of route performance. It is calculated at both the route and trip level.
Table 9.11 shows the guidelines for the minimum number of passengers per in-service hour by route type. Routes and trips that do not meet these minimum standards should be reviewed for potential changes to increase ridership or reduce service. Very poor performing routes may be considered for restructuring or elimination.
Table 9.11: Minimum guidances for passengers per in-service hour
| Route type | Route average1 | Minimum per trip2 |
|---|---|---|
| Core local bus | ≥ 20 | ≥ 15 |
| Supporting local bus | ≥ 15 | ≥ 10 |
| Suburban local bus | ≥ 10 | ≥ 5 |
| Commuter and express bus | Peak ≥ 20; Off-Peak ≥ 10 | Peak ≥ 15; Off-Peak ≥ 5 |
| General public dial-a-ride | ≥ 2 | N/A |
| Light rail | ≥ 70 | ≥ 50 |
| Arterial BRT | ≥ 25 | ≥ 5 |
| Highway BRT | ≥ 25 | ≥ 5 |
| Commuter rail | ≥ 70 | ≥ 50 |
Coverage service productivity
Routes that provide coverage service may not meet the productivity (ridership divided by hours of service) guidelines outlined in Table 9.11, but transit service providers should strive to make the routes as productive as possible while serving the coverage purpose. If productivity of a coverage route drops below half of its route type guidelines in Table 9.11, transit agencies should evaluate the route for opportunities to improve productivity and implement them. In some cases, transit providers may determine lower productivity is beneficial to meet other regional goals like equity. Transit providers should regularly review coverage routes for productivity performance. Newly implemented routes should be allowed a reasonable period to mature before being reviewed for potential changes; 12 to 24 months is commonly used.
Cost effectiveness
A route’s cost effectiveness is measured by the subsidy per passenger required to operate the route. Subsidy is calculated as the difference between the total cost of providing service minus revenue from passenger fares. Since different types of routes are expected to have different levels of performance, each route’s subsidy is compared to the average subsidy of its peers. This standard identifies routes that are not operating within the range of peer routes and focuses corrective action for those services. Subsidy thresholds are determined by calculating the nonweighted, per passenger subsidy average within each route type. Table 9.12 shows the subsidy thresholds and possible corrective action.
Table 9.12: Subsidy thresholds per passenger
| Level | Subsidy per passenger | Review level | Possible action |
|---|---|---|---|
| 1 | 20% to 35% more than peer route avg. | Quick review | Minor changes to route, timing, stops, etc. |
| 2 | 35% to 60% more than peer route avg. | Intense review | Major changes to route, timing, stops, etc. |
| 3 | At least 60% more than peer route avg. | For significant change | Route restructure or elimination |
