Transportation Overview
Table of Contents
Introduction
The core purpose of transportation is providing people and businesses access to the places they need to reach, and choice in how to reach these places. People and businesses need reliable transportation choices so they can perform everyday tasks, like taking a child to daycare, going to work, attending school, or delivering goods and services. These needs and places are unique to each resident and business in the Twin Cities region, and this plan’s challenge is to better meet those needs across a growing region with diverse community contexts.
By 2050, the Twin Cities region will add 657,000 new residents and 342,000 new jobs.
Footnote: 1
The COVID-19 pandemic was a shock to regional transportation and land use systems, and our regional transportation system is still adapting in response. While the way some people live and work has changed, our fundamental need to travel to meet daily needs remains. Some of the lasting effects are positive, like time savings from reduced congestion during peak commute hours, while others are negative, like worsening traffic safety outcomes and revenue challenges for transit.
Investments and legislation at the state and federal level are key in addressing this growth and change. In 2023, the Minnesota Legislature provided transportation revenue increases, including the gas tax, vehicle registration tax, motor vehicle sales tax, and state general funds. They also included new transportation revenue sources, most notably a new seven-county metro regional sales tax for transit, active transportation (walking, biking, rolling), and county transportation.
In 2021 and 2022, Congress created many new programs to reduce greenhouse gas emissions and improve transportation resilience to climate change, including new sources of regionally allocated revenues for each. The Biden-Harris administration has undertaken multiple actions in pursuit of environmental justice and improved transportation equity. The Justice40 Initiative, established by Executive Order 14008, aims to direct 40% of federal investment benefits to disadvantaged communities, encompassing programs like Carbon Reduction and Safe Streets and Roads for All. The administration also updated the definition of environmental justice to include people with disabilities, functioning alongside existing orders on environmental justice.
The Imagine 2050 Transportation Policy Plan presents the region’s objectives, policies, actions, and investments that guide development of the region’s transportation system. It implements the core values, vision, and goals of Imagine 2050: Our Region’s Plan for an Equitable and Resilient Future. Integrated with updates to regional plans guiding land use, water resources, housing, and parks policy, the Imagine 2050 family of plans will create a prosperous future for our children and grandchildren.
As the region’s federally designated metropolitan planning organization, the Metropolitan Council prepares a transportation plan for all forms of travel in the region. This transportation plan and other Met Council plans are prepared with input from many sources, including the region’s counties, cities, and towns, which use these plans as a guide in their own planning processes. The Met Council’s planning region includes Anoka, Carver, Dakota, Hennepin, Ramsey, Scott, and Washington counties. As required by federal law, the Imagine 2050 Transportation Policy Plan also plans for urban portions of southeast Sherburne and Wright counties.
The regional transportation system
Highways
Each day, 86% of all trips in the region are taken in an automobile.2 These roads also serve freight, transit, walking, biking, and rolling. Roads are a key part of a dynamic and resilient transportation system, and the regional highway system is its backbone. While only representing about 16% of centerline road miles in the region, this system carries 80% of all vehicle miles traveled. It includes:
- Principal arterial highways: interstates, other freeways, and expressways and certain major roads (for example, Cedar Avenue in Lakeville). The region has 700 miles of principal arterial highways primarily owned by the Minnesota Department of Transportation (MnDOT). These roads carry 8% of bus service in the region.
- Minor arterials: roads that aren’t as fast as principal arterials but still serve many trips. These roads provide direct routes and some local access, often serving transit, walking, and biking trips, too (for example, Snelling Avenue in Ramsey County). The region has 2,300 miles of minor arterial roads owned 72% by counties, 16% by MnDOT and 12% by cities. These roads carry 51% of bus service in the region, and they also serve as the first- and last-mile connections between freight-generating businesses and principal arterial highways.
Improving safety on this system, and on collector and local streets, was strongly emphasized by technical stakeholders and policymakers during plan development. Since the onset of the COVID-19 pandemic, safety performance regressed and more people in our region died or were seriously injured while traveling on roadways. In 2022, 179 people did not make it home after a crash in the Twin Cities region. This plan seeks to eliminate these fatal and serious injuries from traffic crashes by 2050 through implementation of the Safe System Approach.
These highways are a key economic driver in our region. In 2020, delay per commuter in the Twin Cities was comparable to other similarly sized metropolitan areas across the nation.3 In 2021, the region had the ninth-highest job accessibility by vehicle in the United States,4 and has consistently been ranked in the top ten for several years. However, the region must continue to address excessive travel delays to retain our high standard of living and regional economic competitiveness.
See the Highway Investment Plan for more information about our existing regional highway system and planned investments.
Transit
Transit is an essential means of travel for many residents in the region. On a typical weekday in 2023, people in the Twin Cities region took more than 135,000 rides on public transit services. Transit services are, for people who cannot drive, a reducer of greenhouse gas emissions through more efficient travel and a congestion mitigator.
Together these providers served 53.3 million rides in 2023, or about 16.2 trips per person in the region.
The region is served by six transit providers: the Met Council (Metro Transit and Metropolitan Transportation Services), the Minnesota Valley Transit Authority, SouthWest Transit, Maple Grove Transit, Plymouth MetroLink, and the University of Minnesota. Together, they operate a variety of services that include regular route buses, bus rapid transit, light rail, commuter rail, dial-a-ride and paratransit, microtransit, and vanpool.
Total ridership increased 16% in 2023 over the previous year, showing encouraging signs of ridership recovery from the impacts of the COVID-19 pandemic. To serve these riders, the six regional transit providers ran 3.7 million hours of transit service in 2023, or about 1.2 hours per person.
The total area served by transit (within a half mile of a transit stop) in the region was 492 square miles. About 55% of the region’s population lived within a half mile of regular-route transit services, and 19% lived within that same distance of high-frequency transit (meaning a transit vehicle departs at least every 15 minutes from a stop). Roughly 50% of the region’s jobs were located within a half mile of a transit stop as well.
See the Transit Investment Plan for more information about our existing transit system and planned investments.
Bicycles
The Twin Cities region has a well-developed bicycle network throughout much of the region, including:
- Regional trails designated in the Regional Parks Policy Plan and developed and maintained by regional park implementing agencies.
- Local bikeways and off-road multiuse trails that cities, counties, and MnDOT are responsible for planning, developing, and maintaining.
- Several state trails in the metro region developed and maintained by the Minnesota Department of Natural Resources.
In 2016, the Met Council measured the size of this system in the Regional Bicycle System Inventory, which identified 3,908 miles of existing bikeways and 2,865 miles of planned bikeways. Over time, the region’s investments in bicycle-friendly infrastructure have led to Minneapolis and Saint Paul consistently ranking in the top 10 best large cities for biking, as rated by PeopleForBikes, a nonprofit bicycle policy and trade organization. Work remains to expand this option throughout the region.5
Local governments are the key drivers of building this system, and they face constrained resources to build connected networks for transportation. Through several regional studies, the Met Council created three planning and investment prioritization tools to guide regional investments:
- The Regional Bicycle Transportation Network (RBTN) establishes an integrated, seamless network of bikeways and trails to prioritize investments that serve daily trips, provide access to destinations, and connect local bicycle networks.
- The Regional Bicycle Barriers identifies major physical barriers to bicycling (for example, freeways, railroads) and identifies barrier-crossing opportunity areas.
- The Major River Bicycle Barrier crossings identify investment priorities for providing connections across the region’s three major rivers: the Mississippi, Minnesota, and St. Croix Rivers.
See the Bicycle Investment Plan for more information about our existing bicycle system and planned investments.
Pedestrians
Walking is our most universal mode of travel – we all walk or roll (using a mobility device such as a wheelchair or walker) and walking also makes essential connections to other modes of travel. Across the region, nearly 11% of all trips were walking-only trips.6
Walking is an essential means of travel within the regional transportation system, but availability, type, and quality of facilities for walking vary across the region. Facilities for walking include a few state trails in the metro, regional trails (as designated in the Met Council’s Regional Parks Policy Plan), local multiuse paths, sidewalks, skyways, and pedestrian or multiuse bridges or underpasses. Often the most dangerous part of walking or rolling is crossing streets, so street-crossing treatments are critical parts of infrastructure for safe travel by people walking and rolling.
See the Pedestrian Investment Plan for more information about our existing pedestrian system and planned investments.
Travel Demand Management
Travel demand management is a set of strategies and investments that the region makes to reduce the need to invest in infrastructure and to support other regional goals by encouraging travel behavior changes. Travel demand is influenced by the availability of transportation infrastructure and services, land development patterns, and personal travel needs. Many partners play a role in influencing these three factors, but the primary implementors of travel demand management strategies use engagement, incentives, and promotions to influence travel demand. Implementors like transit providers and transportation management organizations work directly with travelers or through employers to tailor programs to specific needs with the intent of shifting to modes other than driving alone or shifting travel to nonpeak times. Travel demand management strategies are often coupled with new infrastructure investments or with development practices implemented by city zoning codes.
See the Travel Demand Management Investment Plan for more information about the existing travel demand management strategies and opportunities for expansion.
Freight
The existing metropolitan freight system consists of several interconnected networks and regional freight terminals that facilitate the movement and transfer of freight within and between forms of freight transportation. These include trucks on highways, railroads, barges on rivers, air freight, and pipelines.
See the Freight Investment Plan for more information about our existing freight system and planned investments.
Aviation
The Twin Cities region boasts a well-developed and mature aviation system that does not require continued expansion, but rather requires ongoing protection, maintenance, and limited enhancements. The region is served by one major commercial air service airport, Minneapolis-Saint Paul International Airport (MSP), and its six reliever airports owned and operated by the Metropolitan Airports Commission. The region is also served by two other general aviation airports owned and operated by local governments. All MAC-owned airports are part of the National Plan of Integrated Airports (NPIAS), in addition to South St. Paul Municipal Airport. Additionally, there are two designated seaplane bases, many bodies of water that can support seaplane operations, and multiple private turf runways in the region.
Prior to the pandemic in 2020, MSP Airport reached a new record for passenger enplanements at 19.8 million with more than 36 million total passengers in 2019. These record numbers of passengers were moved in the fewest number of aircraft operations since 1992, a year which saw only 10 million passenger enplanements. In addition to passenger activity, MSP saw 239,544 metric tons of cargo moved through the airport in 2019. Unlike passenger activity, dedicated cargo activity saw a modest increase at MSP during the pandemic due in part to the shift to more online sales with retailers like Amazon. These retailers continue to show growth in air cargo and delivery operations.
The Aviation System Plan is currently under development.
Summary of regional transportation investments
The plan is fiscally constrained, meaning that the plan identifies all transportation revenues that can reasonably be expected and are assumed to be available within the plan’s time frame, together with the proposed spending of those revenues. Those assumptions are structured around four categories:
- MnDOT metro state highway revenues and spending
- Regional transit revenues and spending
- Local government transportation revenues and spending
- Regionally allocated revenues
In addition to describing transportation revenue and spending, this plan documents regionally significant projects, like addition of a freeway lane or building a new transitway. See the Investments section of this document for further detail on this plan’s financial assumptions and listing of regionally significant projects.
Evaluation and performance
The Imagine 2050 Transportation Policy Plan uses a performance-based approach to measure success in meeting the region’s transportation goals and objectives. The measures will indicate where the region is meeting its transportation-related goals and objectives and what areas require greater emphasis and resources. The Met Council and its regional partners have selected performance measures that are clear, measurable, and closely tied to the plan’s goals and objectives.
The Imagine 2050 Transportation Policy Plan includes two main performance measures categories. Federal Performance Measures are federally required, shorter-term targets that the Met Council must track and report on. Federal Performance Measures includes topics like safety, reliability, bridge and pavement conditions, and system performance and reliability. Regional Performance Measures are longer-term evaluations that the Met Council will use to track how well the regional transportation system is meeting the Imagine 2050 goals.
Plan structure
The Transportation Policy Plan is a section of the Imagine 2050 plan, an integrated plan for shared regional systems. The Met Council develops regional plans for land use, housing, parks, water, and transportation systems. These plans use a shared set of values, vision, and goal statements, detailed in Imagine 2050. Underneath these goal statements, the Imagine 2050 Transportation Policy Plan contains objectives for the regional transportation system, further defined by policies that state the intent and approach to regional issues and implemented through specific actions.
Fiscal constraint
Federal regulations require the Imagine 2050 Transportation Policy Plan to demonstrate that projects identified in this plan can be implemented using reasonably available revenue sources. Projects listed in this plan’s Long-Range Highway and Transit Capital Projects Lists represent the fiscally constrained elements in this plan, deliverable by existing revenue sources documented in Regional Transportation Finance. The fiscally constrained element of this plan cannot be aspirational about projects without identified revenue sources, nor can it make assumptions about discretionary grants or future legislative or congressional actions. However, this plan does illustrate potential projects that are part of a longer-term vision that the plan’s policies and actions could support; these projects are not formally part of this fiscally constrained plan.
The Imagine 2050 Transportation Policy Plan is the region’s long-range plan for the region’s roadway, freight, transit, bicycle, pedestrian, and aviation systems. The plan is informed by the shared elements of Imagine 2050, state plans, system and corridor studies, and the conditions of funding programs. This plan receives a major update every 10 years, a minor update every five years, and specific amendments or modifications regularly as required by projects or policy change.
For investments that are federally funded or regionally significant, this plan informs the short-range planning process that develops the Transportation Improvement Program (TIP). The TIP is issued annually and includes a rolling four-year cycle of programmed projects. TIP projects include major local projects, projects awarded federal funds through the Regional Solicitation or competitive federal grant programs, and projects programmed by regional transit providers or the Minnesota Department of Transportation using their federal funding allocations. The Imagine 2050 Transportation Policy Plan provides investment direction that informs the structure, criteria, and measures in the Regional Solicitation.
Throughout these steps, the Met Council regularly seeks feedback from policymakers, technical stakeholders, residents, businesses, advocates, and community groups from throughout the region. This feedback arises through the TPP and TIP development, planning studies that provide new information and approaches, and transportation investment processes as projects are planned, designed, built, and operated. This feedback, alongside performance measurement and evaluation, informs continuous improvement of the plan and its implementing programs and investments.
Figure 1.1: Metropolitan transportation planning cycle
Engagement and plan development process
The Met Council strategically approaches public participation to meet the needs of the region. It is important to reach out to stakeholders from all backgrounds and perspectives to have well-thought-out policies that benefit everyone. Public participation is done holistically and comprehensively with the practice of collaboration and inclusion.
The Transportation Addendum to the Public Engagement Plan establishes a framework for the region’s stakeholders to influence both long-term transportation policy development and short-term transportation programming. It details the methods and strategies that the Met Council will use to engage a wide range of stakeholders, from policymakers and business interests to residents of the region. It also identifies specific ways those stakeholders can connect to the transportation decision-making process.
Partner agency engagement
This plan was developed with the experience and perspective of implementing partners. The Met Council implements few projects itself other than transit projects, working in partnership with cities, counties, state agencies, and nonprofit organizations to deliver transportation projects. Engagement with these partners is key in developing all aspects of this plan.
The Imagine 2050 Transportation Policy Plan Technical Working Group was formed underneath the Transportation Advisory Board’s Technical Advisory Committee (TAC) to assist with plan development and review. The Imagine 2050 TPP Technical Working Group consisted of 39 members, including all represented on the TAC’s Planning subcommittee (see Committee members), and additional members representing city, county, state, federal, nonprofit, and academic stakeholders. This group met 24 times over the course of two years to advise Met Council staff on engagement practice, setting goals and objectives, developing policies and actions, and drafting investment and goal-related plan narrative. The TAC received regular reports on Imagine 2050 TPP Technical Working Group discussion and seven informational presentations on development of Imagine 2050 plans since 2022.
The TAC, Imagine 2050 TPP Technical Working Group, Bicycle & Pedestrian Planning Technical Working Group, and Transit Planning Technical Working Group together provided over 2,600 comments on draft plan content in addition to in-meeting discussion.
Transportation Advisory Board
Providing a regional multimodal transportation system meeting the needs of many users requires coordinated planning among partners implementing the system. The Met Council works with its regional partners, including state agencies, cities, counties, and other stakeholders, to ensure regional transportation investments support the Imagine 2050 vision for the region, accommodate projected growth, and use public resources wisely and cost-effectively.
The Met Council serves as the federally designated metropolitan planning organization (MPO) for the Twin Cities region. Congress created MPOs to ensure that decision making for federally funded or regionally significant transportation investments are based on a continuing, cooperative, and comprehensive regional planning process.
The Met Council’s 16 members and chairperson are appointed by the Governor of Minnesota, a structure that predates current requirements that MPO governing boards include local elected officials, state and regional transportation agency officials, and transit agency officials. In our region, the Transportation Advisory Board (TAB), which was created under state statute to provide advice to the Met Council on regional transportation issues, serves as the conduit for local policymaker and agency input. TAB’s membership includes city and county elected officials, state and regional transportation agency leaders, and appointed citizens representing geographic districts and transportation modes. TAB is an integral part of the region’s transportation planning process and leads the solicitation, evaluation, and recommendation of projects funded with regionally allocated federal transportation funds.
Advisory Work Group
The Imagine 2050 Transportation Policy Plan Advisory Work Group was formed under the Met Council to discuss key plan issues. It was a focused group of Met Council members, Transportation Advisory Board members, and leaders representing state and transit agencies. This group met 15 times over the course of two years to provide Met Council staff with regional perspectives and local context during development of objectives, policies, and actions.
Listening sessions and development workshops
The early work to gather deeper feedback from stakeholders started in early 2023 with a series of listening sessions and interviews. The purpose of these interviews was to reflect on the 2040 Transportation Policy Plan’s successes and limitations and learn about what issues were most pressing for the region’s transportation system. These engagement sessions were both transportation partner stakeholders and community-based stakeholders. The engagement ultimately led to draft Imagine 2050 Transportation Policy Plan objectives that were then further discussed and refined within the broader plan development processes.
Once a working structure of goals and objectives were in place, the work began on drafting policies and actions. This was done through eight policy development teams structured around the plan’s goals and objectives. These teams include technical experts that made recommendations and reviewed content that eventually led to a draft list of policies and actions. This draft list was further shared with a wider audience of technical staff through a series of virtual and in-person workshops. The feedback from these workshops was used to create updated versions of the policies and actions that were then further discussed and refined within the broader plan development processes.
Community-based public engagement
Because the region is growing and the population is changing, public participation needs to be coordinated and deliberate. Those who have not been historically engaged in policy conversations with the Met Council are a key constituency and have been intentionally included in engagement for the Imagine 2050 Transportation Policy Plan.
In 2022, the Met Council initiated a three-year contract to support engagement with Black, Indigenous, and people of color (BIPOC), Hispanic, low-income, and other traditionally underrepresented communities.
That contract has supported efforts that have directly impacted the development of the Imagine 2050 Transportation Policy Plan including the Regional Travel Demand Management Study, the Transportation Needs in Daily Life Study, and the Imagine 2050 Transportation Policy Plan Goals, Objectives, Policies, and Actions.
Approaches
Each effort took different approaches to engaging traditionally underrepresented communities, including:
- Community events and intercept surveys
- Online surveys
- One-on-one and small group interviews
- Listening sessions
- Small group discussions
In community-based public engagement, we strive to prioritize quality over quantity. This creates deeper, more meaningful interactions that foster genuine connections and long-term commitment. The true value lies in the richness of the engagement, where individuals feel heard, valued, and actively involved. High-quality interactions build trust and collaboration. Quality-driven engagement is essential for nurturing resilient and vibrant communities.
Engagement on the Imagine 2050 TPP goals, objectives, policies, and actions
We broke this engagement into two phases, connecting with as many of the same groups and individuals as possible to create continuity across these areas that ground the Imagine 2050 Transportation Policy Plan. Phase 1 focused on the goals and objectives and phase 2 focused on the policies and actions.
Phase 1 engagement resulted in five themes to consider as we developed the goals and objectives.
- Equity is a top priority for many, but it needs to be more clearly defined.
- Safety is viewed by most community members as transit, rather than all modes.
- System maintenance brought up tensions between investing in existing infrastructure versus transforming for the future.
- Elevate climate change above and beyond naming climate in the Imagine 2050 vision.
- A multi-node future where community members imagine a future of many regional nodes.
Phase 2 engagement followed up with the proposed policies and actions and asked for community groups and individuals to respond and react. These themes emerged from community-based conversations.
- The housing / transportation connection is important and would benefit from explicit acknowledgement.
- Going deep on equity is seen as important to making progress on achieving the Imagine 2050 goals.
- Balance behavior change with technology change in the proposed policies and actions instead of relying on technology.
- Successful implementation relies on effective coordination across jurisdictions and sectors.
This engagement was all done ahead of drafting the Imagine 2050 Transportation Policy Plan, so the themes could be considered when drafting the content.
Study-level engagement
This valuable community input influenced and helped shape the foundational elements of the Imagine 2050 Transportation Policy Plan, while engagement at the study level brought a community-based lens to key study areas.
In particular, the Transportation Needs in Daily Life project brought forward community voices in a unique and impactful way. Participants’ willingness to share their personal stories has created a deeper understanding of the regional transportation system and, more broadly, of how to work better with our communities. We recognize that we must, in turn, share their stories in the most true and meaningful ways we can while making the feedback actionable.
Contributing plans and studies
The region uses statewide plans and regional planning studies to inform the policy direction and investment plans for the Imagine 2050 Transportation Policy Plan. This is part of the continuing planning process required under federal law. Regional planning studies typically explore a specific topic in detail and provide recommendations for consideration in the Imagine 2050 TPP development related to content like policies and actions, investment plans, performance evaluation, and project lists. These studies are regional in nature and are in addition to corridor-level or subregional planning work completed by regional implementing partners, which are not summarized here. Most of these contributing plans and studies include engagement with technical stakeholders as well as some engagement with policy stakeholders and community-based stakeholders. The following studies contributed to this plan development:
- Minnesota Statewide Multimodal Transportation Plan (Updated 2022)
- Minnesota State Highway Investment Plan (Updated 2023)
- MnPASS System Study, Phase 3
- Congestion Management Safety Plan, Phase 4
- Freeway System Interchange Study
- Twin Cities Highway Mobility Needs Analysis
- Intersection Mobility and Safety Study
- Congestion Management Process Policies and Procedures and Corridor Analysis Handbook
- Functional Classification Process Update
- Regional Safety Action Plan
- Urban Freight Distribution Study
- Transit Service Allocation Study
- Metro Transit Network Next Arterial Bus Rapid Transit Study
- Mobility Hub Planning Guide
- Regional Bicycle Transportation Network (RBTN) Bicycle Facility Guidelines and Measures
- Regional Bicycle Barriers Study
- Regional Truck Highway Corridors Study and Update
- Pedestrian Safety Action Plan
- Regional Travel Demand Management Study
- Electric Vehicles Planning Study
- Regional Transportation and Climate Change Multimodal Measures Study
- Travel Behavior Impacts of COVID-19
- Travel Behavior Inventory and On-Board Survey Programs
- Transportation Needs in Daily Life Study
- Maximum Mode Shift, a Vehicle Miles Traveled Reduction Study
- Equity Evaluation of Regional Transportation Investments
The plan also identifies new planning studies in the Work Program to start in 2024 and beyond that will inform future Transportation Policy Plan updates.
Public comment period
The Met Council released the Transportation Policy Plan for public comment on Aug. 15, 2024, and comments were accepted through Oct. 7, 2024, alongside Imagine 2050 and other system and policy plans. The Met Council held a public hearing to accept comments on the plan on Sept. 25, 2024.
We received approximately 400 comments on the Transportation Policy Plan, including comments substantively related to long-range transportation planning that were submitted about other Imagine 2050 plan sections. Met Council staff reviewed each comment, considered and made responsive changes, and provided responses. These changes were widely distributed to policy and technical stakeholders who participated in the Transportation Policy Plan development prior to considering its adoption. A summary of major themes and complete listing of comments and responses are available in the plan’s public comment summary.
Amendments and updates
The Imagine 2050 Transportation Policy Plan can be amended and is required to be updated at least every five years under federal law.7 The next interim five-year update ahead of the 2060 plan update is planned to be a minor update that maintains the general plan goals and objectives but updates any necessary policy direction, finance assumptions, actions, and work program.
Amendments and administrative modifications to the plan will be posted as separate documents that are self-contained with all the relevant information, so please check the Met Council website for any amendments or administrative modifications to this plan after its adoption. The following are examples of what is addressed in each type of plan change.
- Update: Inclusion of substantial policy direction modifications that will likely impact the fiscally constrained plan, including the incorporation of major revenue assumption updates and new funded project lists.
- Amendment: Addition or substantial change of any regionally significant project that is not selected through the Regional Solicitation process (see the Long-Range Highway and Transit Capital Project Lists for definitions). Inclusion of new revenues that do not substantially alter the policy direction of the plan but do impact the long-range project lists.
- Administrative modification: Inclusion of illustrative projects that are not included in the fiscally constrained plan. Updates to maps, figures, or policy direction that do not impact the fiscally constrained plan.
Approach to Regional Goals
The following sections describe the Imagine 2050 Transportation Policy Plan approach to the regional goals. The discussion on each goal includes the following sections: objectives, performance measurement, policies, work program, major topics, recent work, and examples of supporting work by partners.
Read the about the Regional Goals
Browse Transportation Objectives
Our region is equitable and inclusive
Equity is embedded in Imagine 2050 at different levels: as a value, as a goal, and in transportation specific objectives in the Imagine 2050 Transportation Policy Plan. Values are core beliefs or principles that guide the Met Council's work, our expectations of partnerships, and our policy and program development. The Met Council has identified equity in a core set of values that we believe are most important to the issues and opportunities that face the region, now and into the future:
Equity means that we value the people and communities of our region. Our region is economically and culturally vibrant. However, we recognize the harm and disparities that systemic injustices, including racism, have created.
We are dedicated to creating systems, policies, and programs that repair and heal past harms, foster an equitable future, and eliminate disparities. People in communities that historically and currently experience marginalization will be centered in this work in leadership roles.
Objectives
- Historically disadvantaged communities are better connected to jobs, education, and other opportunities.
- We repair and eliminate disparate and unjust impacts and harms to Black people, Indigenous people, and people of color.
- We better meet the transportation needs of people who have disabilities or limited mobility.
Performance measurement
Performance measures help evaluate how well the Imagine 2050 Transportation Policy Plan is addressing the region’s goals and objectives, as defined in this plan and Imagine 2050. The measures used to track performance for equity and inclusion in this plan are access to destinations, exposure to pollution, exposure to noise, and exposure to extreme heat. More on these measures can be found in the Imagine 2050 TPP Evaluation and Performance section.
Improving access for all modes (including alternatives to driving) is one step towards a more equitable and inclusive region. Automobiles currently offer the highest job accessibility by a large margin. The average resident can reach 50% of all jobs in the region in 20 to 25 minutes by car during the morning commute. By contrast, less than 6% of the region’s jobs can be reached by bike and transit in an hour. The transit investments in the 2050 Transportation Policy plan are expected to increase transit accessibility by 15% in 2050.
Performance measures also show that exposure to air pollution, noise, and extreme heat are often highest along heavily used roads and highways. Under existing conditions at least, these are frequently areas with higher percentages of low-income households and people of color. How policies influence the location and intensity of traffic on these facilities going forward will also influence the equity of our transportation network.
Policies
The Imagine 2050 Transportation Policy Plan sets five policies related to transportation equity and environmental justice. These policies and their supporting actions are detailed in Policies and Actions.
Policy 4. Conduct engagement activities and implement shared decision making with historically underrepresented communities throughout policy making, planning, and project development to ensure equitable distribution of the benefits and burdens of transportation investments.
Policy 5. Ensure communities and investments meet federal Americans with Disabilities Act standards and encourage partner government agencies to go above minimum standards to fully meet the needs of people who have a disability in infrastructure, services, communication, and engagement.
Policy 6. Implement strategies against gentrification and displacement caused by transportation investments.
Policy 7. Evaluate processes, policies, programs, and plans to ensure that community benefits and burdens from transportation investments are distributed equitably.
Policy 8. Implement investments that repair harms and impacts to historically underrepresented communities from past highway investments.
Additional policies or actions may be amended into the plan after the completion of work in progress from the Equity Evaluation of Regional Transportation Investments study or the upcoming Metropolitan Highway Harms study.
Work program
The Imagine 2050 Transportation Policy Plan identifies the specific work program items related to this goal area. More information on these items can be found in the work program.
The Metropolitan Highway Harms Study will identify and address the long-term harms caused by Minnesota's Metropolitan Highway System and propose mitigation investments for inclusion in the Imagine 2050 Transportation Policy Plan. Additionally, the Transportation Project Impacts to Disadvantaged Communities project aims to develop a methodology for assessing the benefits and harms of transportation projects on various demographics, addressing federal requirements such as environmental justice and Justice40, and incorporating community guidance to inform transportation policy and funding decisions. Finally, the Community Assessment and Project Public Engagement Guide, building on the Equity Evaluation of Regional Transportation Investment Processes Study and the framework and tool it produced, will provide a framework for early community engagement, ensuring equitable distribution of transportation benefits and burdens by mapping community assets, defining communities, and integrating their transportation needs into project planning, development, and decision making.
Major topics
Equity and inclusion are framed by several important concepts described below, including an equity definition for Imagine 2050, a racial equity framework, environmental justice framework, federal regulatory context, and past and ongoing transportation-related harms.
Equity definition
Imagine 2050 includes the following definition for equity:
Equity at the Met Council means that historically excluded communities – especially Black communities, Indigenous communities, and communities of color – have measurably improved outcomes through an intentional and consistent practice of adapting policies, systems, services, and spending so that they contribute to the repair of both historic and ongoing injustice.
Figure 1.2: Met Council racial equity framework

Racial equity framework
The Center for Urban and Regional Affairs at the University of Minnesota has used a racial equity framework to guide its work with communities and other stakeholders. The Met Council supports the continued use of this framework through Imagine 2050. The framework represents the Met Council’s commitment to the regional equity goal and value statement. It also provides expectations for how equity should be expressed and visible in policy language for the Met Council.
Environmental justice framework
The Met Council’s environmental justice framework, discussed in more detail in the Our Region is Equitable and Inclusive section of Imagine 2050, defines environmental justice as the right for all residents to live in a clean, safe environment that contributes to a healthy quality of life.
Environmental justice centers, but is not limited to, Black communities, Indigenous communities, communities of color, disabled communities, immigrant and refugee, and low-income communities who have and continue to experience a legacy of racism or other structural or systemic barriers that have resulted in environmental injustices, harms, and risks.
Through its regional values, the Met Council commits to conducting community-centered engagement, repairing past and ongoing harms, distributing benefits equitably, and preventing future burdens. Environmental justice at the Met Council requires necessary adaptations to Met Council services, requirements, policies, practices, processes, and decisions, starting with Imagine 2050, to support a healthy and safe region.
Federal regulatory context
The Biden-Harris administration undertook multiple equity-related actions, starting with the U.S. Department of Transportation's Equity Action Plan, which was released in January 2022 in response to Executive Order 13985. The plan focuses on expanding access to affordable transportation, supporting small, disadvantaged businesses, increasing community input in transportation decisions, and boosting federal equity investments. The Justice40 Initiative, established by Executive Order 14008, aims to direct 40% of federal investment benefits to disadvantaged communities, encompassing programs like Carbon Reduction and Safe Streets and Roads for All. Executive Order 14096 updated the definition of environmental justice to include people with disabilities; this order functions in tandem with the earlier Executive Order 12898 on environmental justice. Title VI of the Civil Rights Act ensures nondiscrimination in federally funded programs based on race, color, and national origin, and the Rehabilitation Act and the ADA protect the rights of people with disabilities. The U.S. Department of Transportation's 2022 Disability Policy Priorities emphasize multimodal accessibility, job access, vehicle accessibility, and robust enforcement of disability laws. More information on these federal initiatives can be found in the Environmental Justice section.
Past and ongoing transportation-related harms and need for action
The Met Council acknowledges the transportation system created by government decisions has excluded, unjustly harmed, and displaced some communities, and that many of these harms continue today. People who have suffered from a legacy of racism or other structural or systemic barriers include Black communities, Indigenous communities, communities of color, and people who have disabilities. Transportation should connect people to each other and meet their daily needs. Yet for some communities, transportation, or in some cases the lack of it, has created disconnection from destinations and formed barriers within communities.
This plan acknowledges these effects and pairs them with actions to address these injustices and create beneficial connections for these communities.
Race and transportation
Broader discrimination in society plays out in our transportation system along with other areas such as housing. Black people, people with disabilities, people of color, and people living in poverty have their own intersecting histories of erasure, discrimination, and disproportionate impacts related to transportation. As one example, transportation is intertwined in the history of Black Americans, beginning with the transport of enslaved Africans to this land hundreds of years ago. After slavery ended, segregation continued to restrict how Black Americans traveled and where they could live. The historic discriminatory land use patterns that affect transportation are discussed in Our Region is Equitable and Inclusive section of Imagine 2050. The Imagine 2050 TPP Evaluation and Performance section of this plan also discusses differences in travel by race, such as the higher use of transit by Black people, Indigenous people, and people of color in the region. The University of Minnesota report Advancing Transportation Equity: Research and Practice further outlines impacts of segregation and the inequities of an auto-dominated system in Minnesota.
Transportation-related disparities
Some of the known transportation-related disparities in the region include:
- The Life and Breath report analysis done in 2022 by the Minnesota Pollution Control Agency and the Minnesota Department of Health found that “the highest estimated rates of air pollution-related death and disease are found in neighborhoods with the largest percentage of Black, Indigenous, and people of color, low-income and uninsured residents, and people who live with a disability.”8 Vehicle traffic is a major source of air pollution, and Black people, Indigenous people, and people of color live in higher concentrations in closer proximity to busy roadways.
- Over 30 years after the Americans with Disabilities Act became law, people with disabilities continue to face ongoing challenges with inaccessible infrastructure and programs. While the region has made progress since 2018 in updating local ADA transition plans (discussed in the Pedestrian Investment Plan), significant work remains to transition the transportation system and public right-of-way to meeting the minimums required by the ADA.
- Black and American Indian people are disproportionately killed while walking in the region. 14% of pedestrians killed between 2016 and 2019 were Black, compared to being only 9.6% of the region’s population. 2.3% of pedestrians killed were American Indian, compared to being only 0.48% of the region’s population.9
- Historical impacts from highways such as I-94, I-35W, and Olson Highway are well documented by other local stakeholders. In addition, arterials act as barriers within communities.
- As mentioned above, the University of Minnesota report Advancing Transportation Equity: Research and Practice identifies structural inequities that affect transportation equity, such as the spatial segregation and related mismatch between housing locations and job locations, as well as an auto-dependent system, leading to disconnection and harms for some communities.
Engagement with communities
Inequitable outcomes stem from processes that have historically excluded people, devalued their needs, and denied them power in decision-making processes that affect them. While engagement alone is not equity, working with people in the community who are most affected is central to making processes and outcomes more equitable. The Our Region is Equitable and Inclusive section of Imagine 2050 includes more discussion about community-centered engagement.
Changing processes to be more equitable includes increasing the transparency of decision-making processes and who makes decisions, changing who leads the engagement, and changing who is centered in the work. Engagement work needs to be intentional and meet people where they are with communication that is approachable and understandable. Surveys and public comment periods may not be the best methods to hear from historically underrepresented groups. Those who lead the engagement ideally should be representative of the population they wish to reach.
Incentives for community members
Community members contribute their lived expertise to transportation-related engagement efforts, yet the status quo has been that they are asked to volunteer their time while agency or consultant staff are paid for their involvement. This practice has been changing. The U.S. Department of Transportation publication Promising Practices for Meaningful Public Involvement in Transportation Decision-Making identifies providing financial incentives or reimbursements as one example for building more representative engagement into transportation planning processes. This could be scaled to the level of involvement and range from gift cards for survey or focus group participation to stipends for more ongoing contributions. The eligibility of these costs for federal funds can vary and should be verified before implementing any of these types of activities.
While some agency regulations or practices or state laws may need to change to support broad implementation of this practice across the region for both ongoing advisory groups and project-specific engagement, community members have indicated it is an important and needed evolution of practice.
Recent work by the Met Council
In the Equity Evaluation of Regional Transportation Investment Processes study, the Met Council in partnership with its community-based Equity Policy Group (EPG), developed a framework and tool for evaluating equity within transportation project initiation, funding, planning, and development processes. The framework and tool are being piloted on selected investment processes and following its finalization, the Council will offer regional training sessions for technical staff and community members on evaluating processes and implementing changes through using the Transportation Equity Evaluation Framework and Tool.
The Met Council study on Transportation Needs in Daily Life, completed in 2024, emphasizes understanding transportation challenges faced by vulnerable groups such as the unhoused, people with disabilities, LGBTQIA+ individuals, and older adults, while also addressing impacts and injustices experienced by Black people, Indigenous people, and people of color.
Supporting work by partners
MnDOT’s Advancing Transportation Equity Initiative
MnDOT’s Statewide Multimodal Transportation Plan (2022) includes a commitment to healthy equitable communities and improving equitable outcomes. Key themes through the plan are as follows:
- Eliminate burdens and reduce structural inequities for disproportionately impacted groups.
- Reduce transportation and housing costs for the most burdened.
- Support a diverse workforce through transportation.
- Includes analysis on transportation equity, environmental justice, and Title VI.
In addition to supporting the equity elements of the Statewide Multimodal Transportation Plan, the agency’s Advancing Transportation Equity initiative has conducted recent research on equity:
- Centering the Margins: The Transportation Experience of Underserved Communities (2023)
- Advancing Equity in Accessibility and Travel Experiences: The Role of Gender and Identity (2023)
- Equity in Performance Measurement (2022)
- Advancing Transportation Equity: Research and Practice (2019)
City of Minneapolis Racial Equity Framework for Transportation
The city’s Transportation Action Plan called for the creation of a racial equity framework for use in a transportation context. This was supported by other city work, like the city’s Strategic Racial Equity Action Plan, and other city plans.
City of Saint Paul Rondo Inheritance Fund
The city’s Inheritance Fund program provides downpayment assistance or homeowner rehabilitation funds for low-income residents from the Rondo neighborhood to help build wealth through homeownership in the city for direct descendants of people who owned property that was taken for the construction of I-94.
Human Toll: A Public History of 35W
This community collaboration with researchers at the University of Minnesota, the Hennepin History Museum, and the Sabathani Community Center collected oral histories on the impacts I-35W had on people living in south Minneapolis along the corridor.
ReConnect Rondo
This Saint Paul nonprofit organization has been working since 2016 with the community and government agencies on restorative investments for the Rondo neighborhood including a land bridge over I-94 and cultural district.
Our communities are healthy and safe
Transportation safety is part of public health. Traffic crashes have direct impacts when they result in death or serious injuries. Beyond those effects, people feeling safe and comfortable while traveling can improve mental health and social connection. As such, transportation can be considered a key social determinant of health. Social determinants of health are nonmedical factors – including economic stability, education, health care access and quality, social and community context (including discrimination), affordable and stable housing, and neighborhood and built environments – that influence health outcomes. Transportation uniquely crosses over all these areas since it offers access to these important needs.
Elevating health and safety as a regional goal comes at a time when life expectancy in the U.S. has decreased compared to the early 2000s and lags behind other countries,10 and fatalities and serious injuries from traffic crashes have increased since the COVID-19 pandemic began. Coordinating with partners across areas such as land use, housing, and other services is crucial for improving how transportation can support public health and safety.
Objectives
- People do not die or face life-changing injuries when using any form of transportation.
- People feel safer, more comfortable, and more welcome when using any form of transportation.
- We mitigate and avoid harms to people caused by nearby transportation infrastructure and use (for example, air quality, noise, light).
- People are better connected to community and cultural resources that support their physical, emotional, and mental well-being.
- People can increase physical activity with more opportunities to walk, roll, or bike.
Performance measurement
Performance measures help evaluate how well the Imagine 2050 Transportation Policy Plan is addressing the region’s goals and objectives, as defined in this plan and Imagine 2050. Transportation safety is a measure which is required to be tracked by the federal government, while public health measures are tracked regionally for the purposes of this plan. The measures used to track performance for safety and public health in this plan are: fatalities and serious injury rate on roadways; transit safety performance; travel share by mode; and air pollutant emission levels. More on these measures can be found in the Imagine 2050 TPP Evaluation and Performance section.
Since 2020, fatalities and injuries along the region’s transportation system have been increasing. Policies will need to reverse this trend to achieve the objective that people do not die or experience life-changing injuries when using the transportation system.
The Met Council forecasts that regional air pollutant levels will significantly decrease between 2025 and 2050, largely due to increased fuel efficiency and cleaner burning combustion engines over the next 30 years. The Met Council also projects that a combination of improvements to the transit system and demographic changes will create some shifts from automobile travel to transit usage and more active forms of transportation such as biking and walking.
Policies
The Imagine 2050 Transportation Policy Plan sets six policies related to safety and public health. These policies and their supporting actions are detailed in Policies and Actions.
Policy 9. Plan for and invest in transportation facilities that complement existing and planned land use and are dignified and comfortable for all users.
Policy 10. Work to eliminate fatalities and serious injuries from traffic crashes on the transportation system by 2050 through implementation of the Safe System Approach.
Policy 11. Emphasize and prioritize the safety of people outside of vehicles in the transportation right-of-way.
Policy 12. Provide safe, secure, and welcoming transit facilities for all users.
Policy 13. Use transportation investments and priorities to reduce negative health impacts influenced by the transportation system.
Policy 14. Incorporate culturally appropriate placekeeping and placemaking into transportation projects, infrastructure, and right-of-way.
Some of the safety-related actions may be further influenced by work done as part of the Regional Safety Action Plan that is scheduled to be completed in mid-2024. This could include connections to high-injury streets identified in the region through crash data analysis and systemic risk factors.
Work program
Health is a new focus area for the Met Council in planning considerations. We have partnered with the University of Minnesota’s Center for Transportation Studies on a series of workshops related to the Imagine 2050 Transportation Policy Plan goals. The aim is to help identify needed future research and planning-related work. Public health is one workshop focus that will identify needs that the Met Council and partners can address.
One challenge with addressing health connections with transportation is more clearly identifying critical destinations that contribute to public health, such as grocery stores, healthcare facilities, parks, and other everyday destinations. The work program includes a project to define, inventory, and map essential destinations to aid local and regional partners to connect populations to these destinations and improve public health outcomes. The work could also include expanding accessibility analysis to include these essential destinations. This work may be done in partnership with other agencies, such as MnDOT.
On safety, Met Council is planning to develop a Safer Connections to Transit program to ensure safe year-round access to transit for people who are walking, rolling, or biking. Additional work program items may emerge from programmatic recommendations that have not yet been completed as part of the Regional Safety Action Plan.
Major topics
Traffic safety
Arriving safely at destinations or home should be an expectation of a reliable, safe transportation system. Yet every year, too many people die or are seriously injured in traffic crashes involving vehicles. Over the 2018-2022 period, an annual average of 152 people died and 786 people were seriously injured while traveling on roadways in the Twin Cities.11 In addition to these immediate impacts, crashes create other potential effects such as medical and other bills or changes in employment.
Minnesota has supported a goal of zero deaths from traffic crashes for a long time with work through the Minnesota Toward Zero Deaths program, which is a partnership between the Minnesota Departments of Transportation, Health, and Public Safety with participation from local agencies. At the national level, the work toward reaching zero deaths from traffic crashes is now being framed in a Safe System Approach, and work to implement this approach is growing in Minnesota and the region.
Safe System Approach
The Safe System Approach, promoted by the U.S. Department of Transportation, is an important shift in safety planning and implementation. It provides a more holistic approach to addressing traffic safety as a system rather than as individual problems or solutions.
Figure 1.3: Safe System Approach principles and elements12
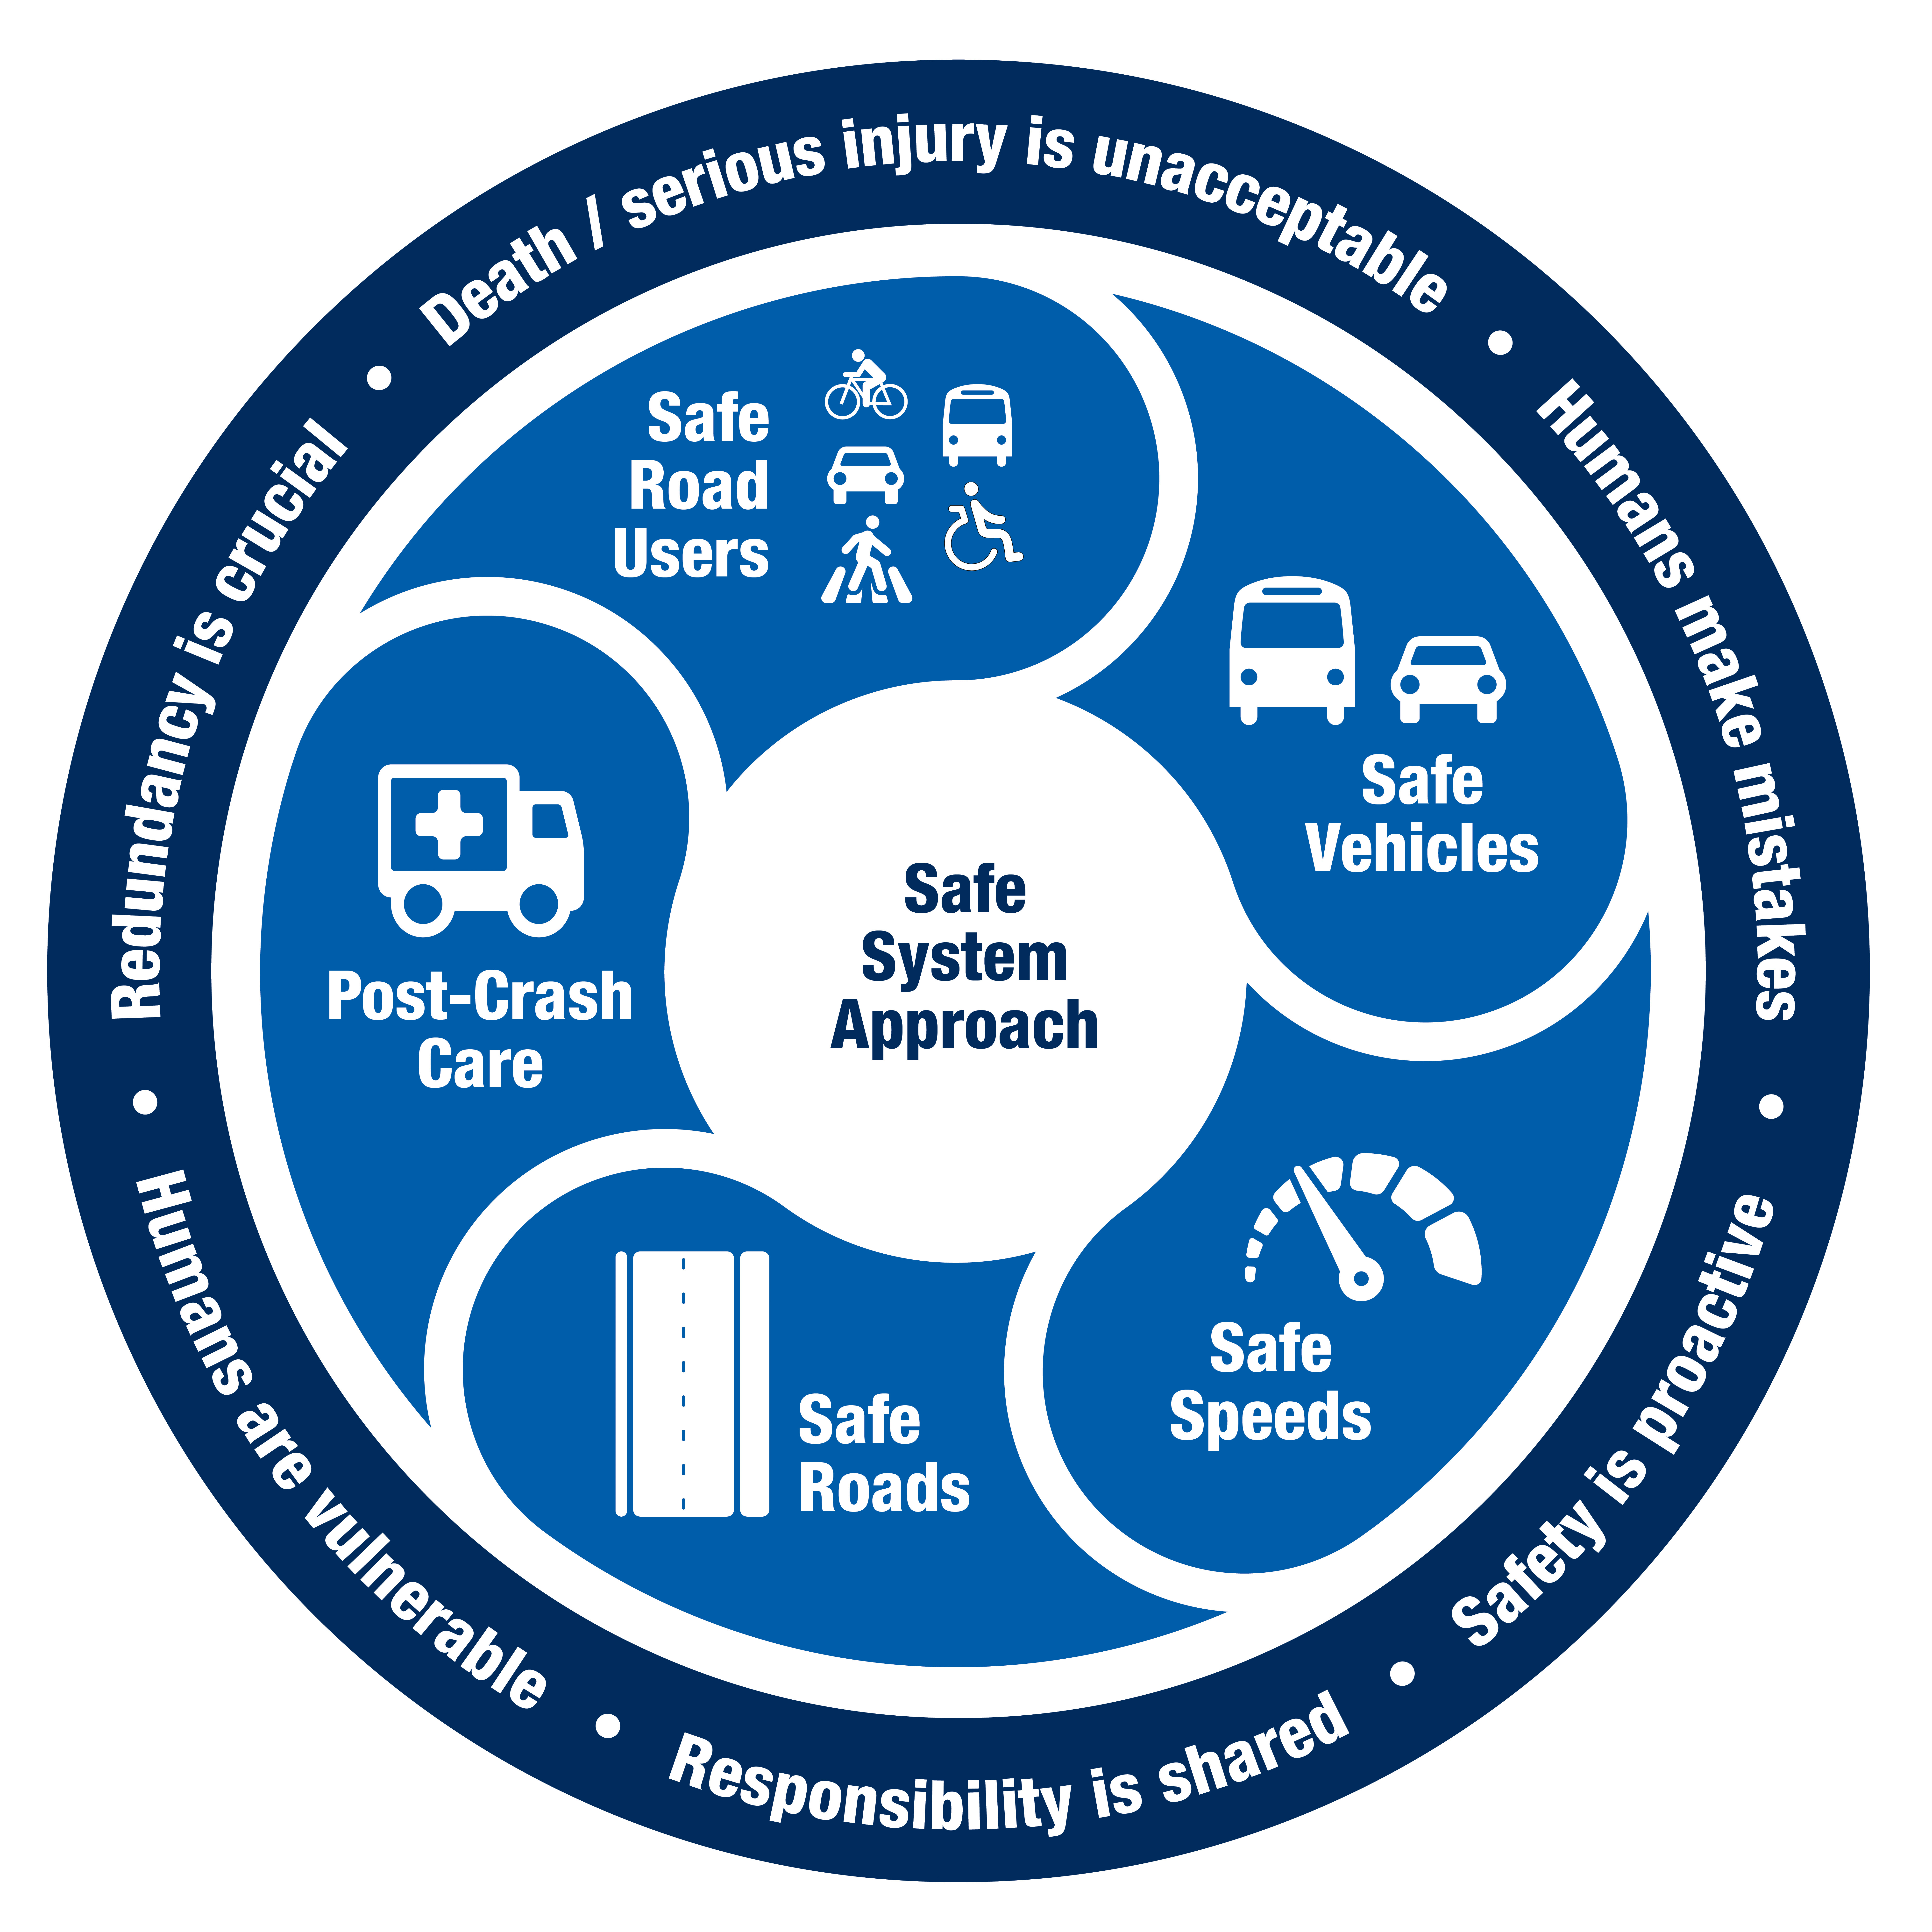
The Safe System Approach reframes how to address traffic safety with core principles and elements that incorporate these areas. The Federal Highway Administration highlights that “the Safe System Approach requires a culture that places safety first and foremost in road system investment decisions.”
Safe System Approach principles
As outlined in Figure 1.3, the Safe System Approach has six principles:
- Death/serious injury is unacceptable. This approach prioritizes crashes that result in death or serious injuries. The goal is to eliminate these impacts, not eliminate every crash.
- Humans make mistakes. We can’t educate and enforce our way to reliably perfect human behavior. The transportation system needs to be designed and operated so that mistakes don’t result in death or serious injury.
- Humans are vulnerable. Whether traveling outside or inside vehicles, people can take only so much physical impact from a crash with a vehicle. The transportation system needs to be centered on these human limits that cannot withstand the dangers a vehicle-dominant system presents.
- Responsibility is shared. Everyone responsible for the transportation system needs to work to prevent crashes that cause death or serious injury. This includes system designers and operators as well as vehicle manufacturers.
- Safety is proactive. Rather than belatedly fixing issues related to fatalities or serious injuries after they happen, a proactive system uses tools to identify risks and take mitigation steps to prevent these from happening.
- Redundancy is critical. Redundancy in the transportation system means that if one thing goes wrong, other elements are in place to provide proactive protection against death and serious injury.
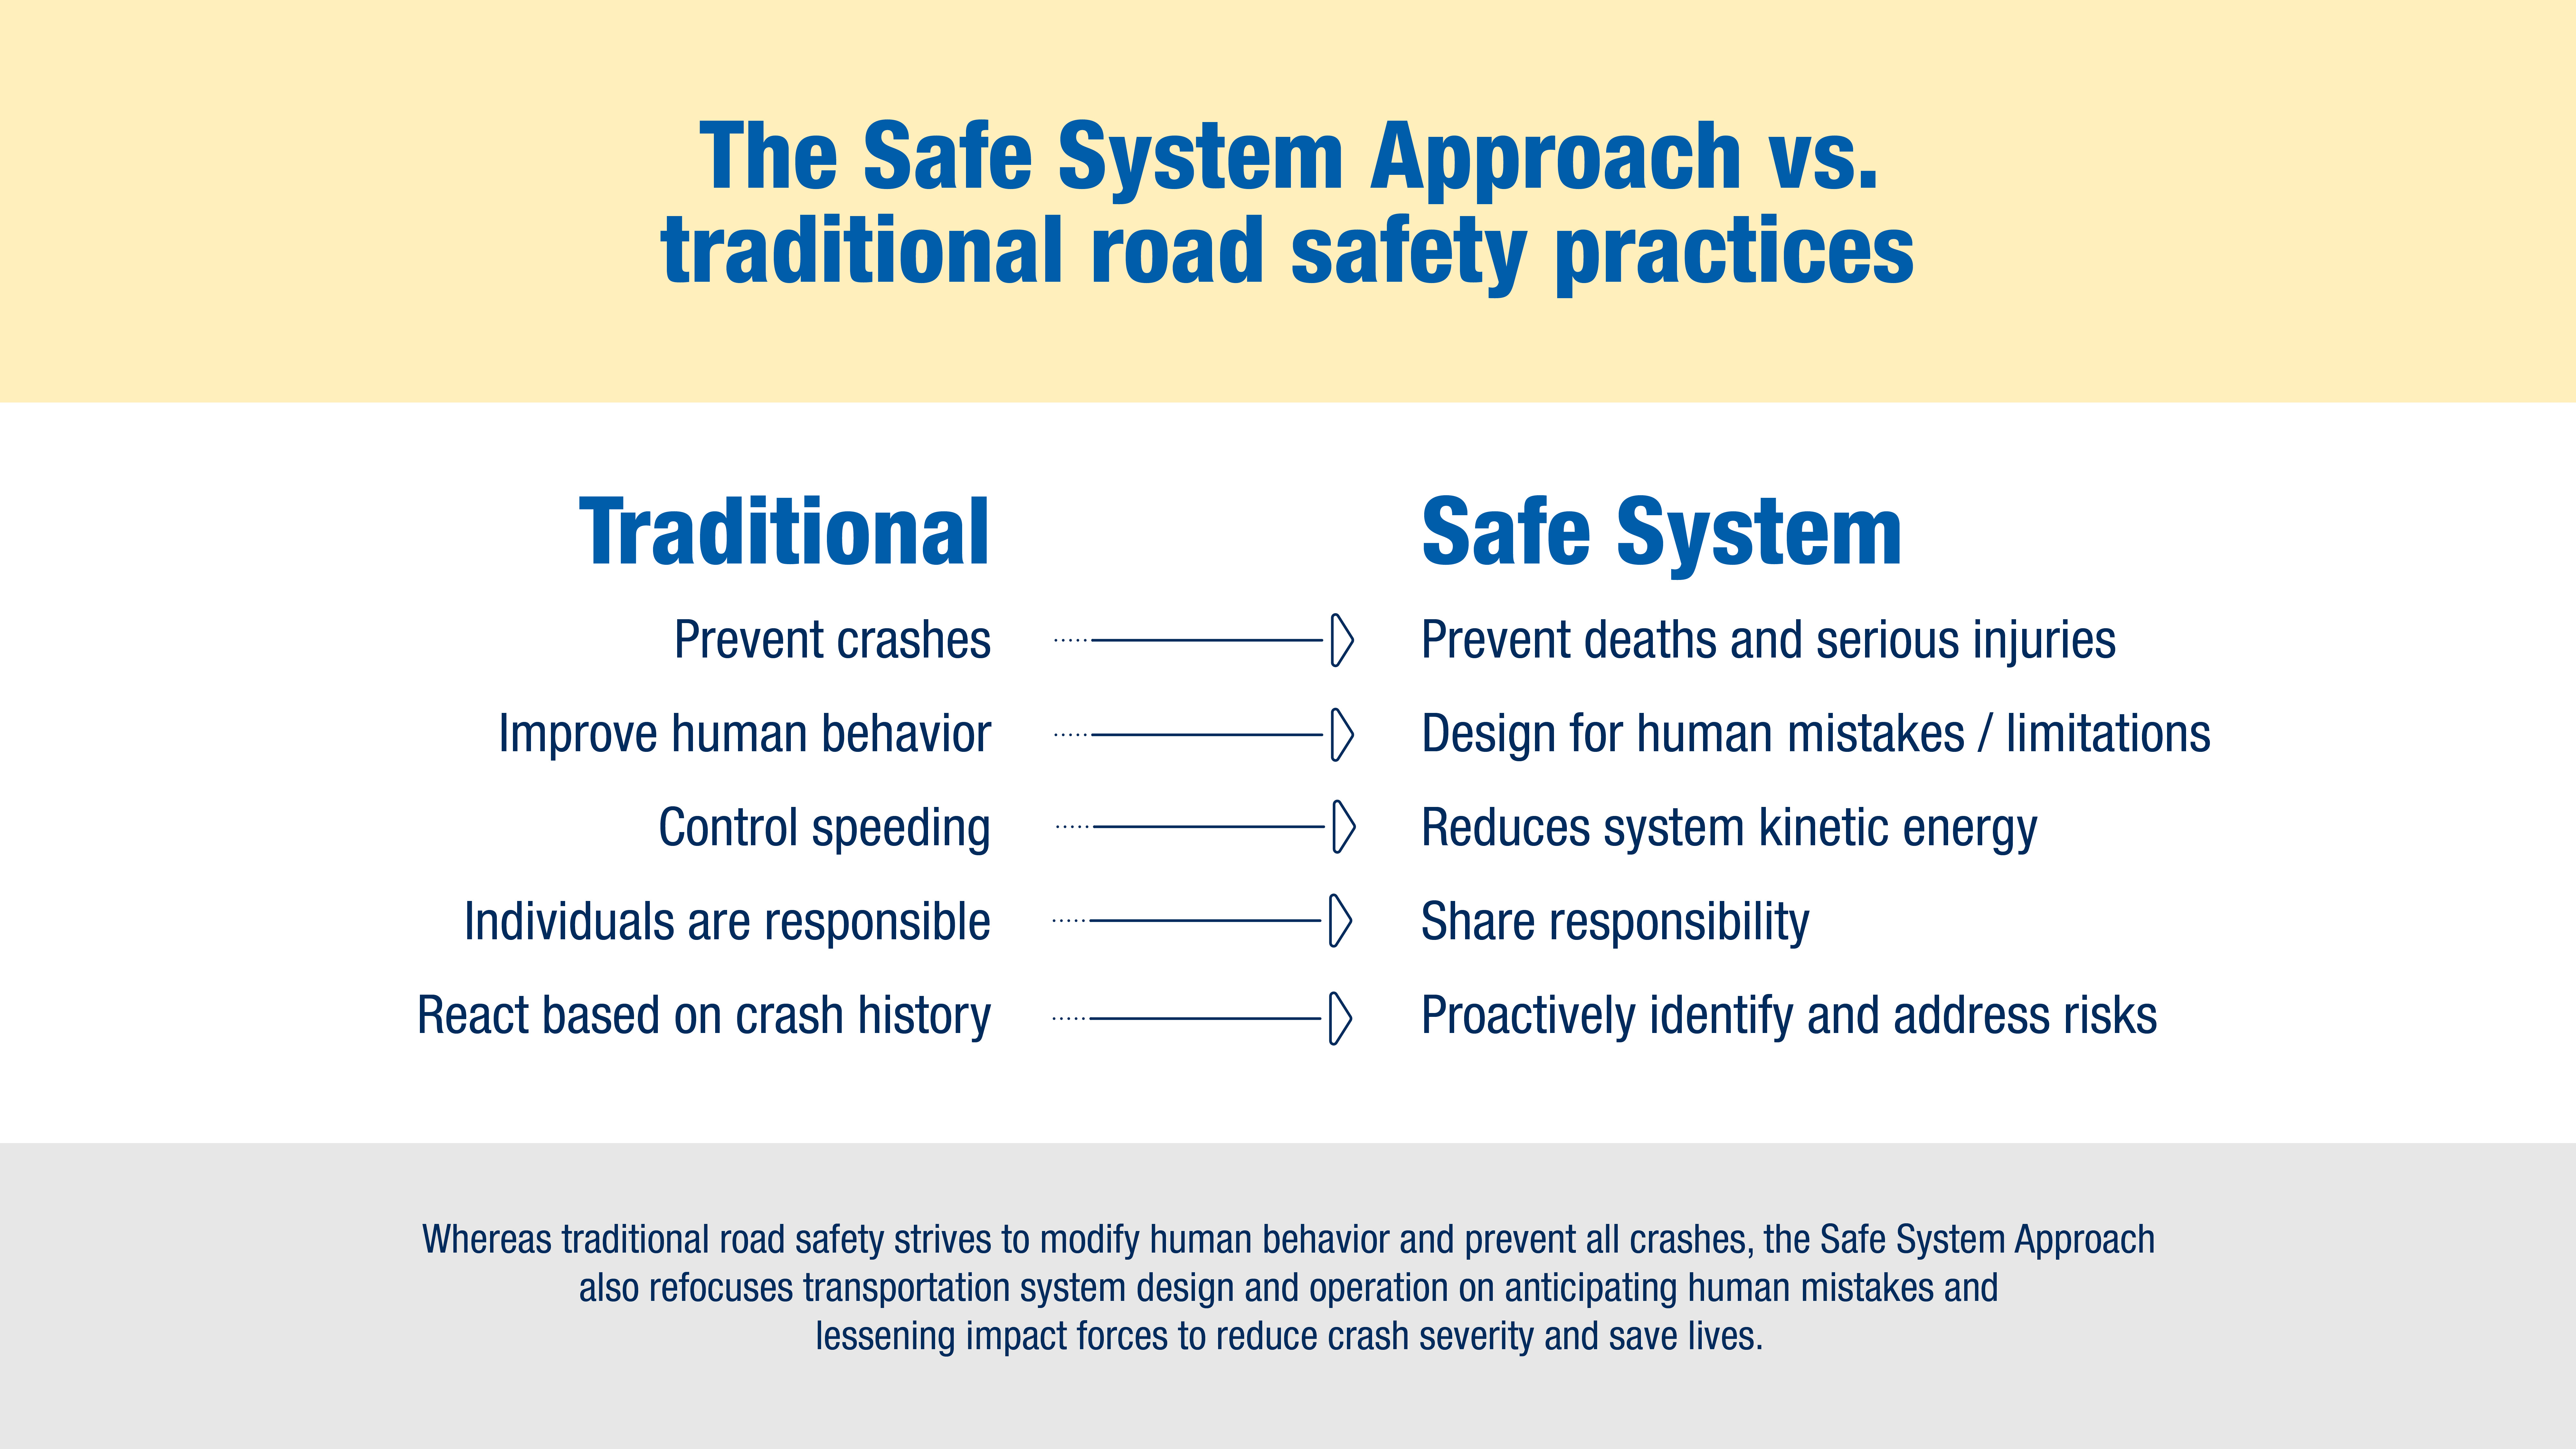
The Federal Highway Administration provides a summary of the shifts from more traditional safety work to using a Safe System Approach, as illustrated in Figure 1.4.
Figure 1.4: Safe System Approach vs. traditional safety practices13
Safe System elements
The Safe System Approach includes five elements in a holistic context.
Safe speeds
As speeds of vehicles increase the likelihood of crashes becoming fatal rises considerably, at 25 MPH, 90% of pedestrians are likely to survive a crash, while at 50 MPH less than 50% are likely to survive. Reducing speeds helps in three important ways:
- Reduces the impact forces in a crash
- Provides additional time for drivers to stop
- Improves visibility
Managing speeds is a key aspect of the Safe System Approach14. Part of managing speed is ensuring that target speeds are appropriate for the roadway type and context. This is a big difference from more traditional approaches that focused more on exceeding speed limits.
Recent developments have helped restrict high-speed driving, including:
- City speed limits. Since 2019, cities can voluntarily set speed limits on city streets based on a safety, engineering, and traffic analysis. The Cities of Minneapolis and Saint Paul worked jointly to lower their speed limits in 2020, and some other cities in the region have followed, including St. Louis Park. The two cities provided common promotional materials to residents in each city to build awareness of the changes.
- Speed safety cameras. Cameras that can document speeding drivers are considered a proven safety countermeasure by the Federal Highway Administration. In 2024, the Minnesota Legislature authorized the cities of Minneapolis and Mendota Heights to pilot speed safety camera systems and directed MnDOT and the Minnesota Department of Public Safety to pilot these systems in construction work zones.
- Advanced vehicle technology. The National Transportation Safety Board has called for intelligent speed assistance to be implemented in all new vehicles. It also recommends research and guidelines for implementing this technology as an interlock on vehicles for drivers who repeatedly speed. Passive intelligent speed assistance technology alerts speeding drivers, while active forms of it either make it more difficult to exceed speed limits or prevent drivers from exceeding the limit.
Lowering and enforcing speed limits are not the only tools; other changes are needed to roads and the surrounding environment to provide appropriate guidance to drivers.
Figure 5. Depiction of a “20 is plenty” ad poster from cities of Minneapolis and Saint Paul15

The design and operation of roadways can help reduce the severity of crashes and influence behavior, especially drivers.16 The Collaborative Sciences Center for Road Safety, a National University Transportation Center with several university partners including the University of North Carolina and the University of California, notes that road design should consider current and planned land use contexts so that the most likely travelers are safely accommodated.17 The center also cautions against assuming design manuals will automatically help address needed safety treatments since all included practices are not based on evidence of actual safety impacts; it recommends focusing on reducing risks to road users based on vulnerabilities.18
In January 2024, the Federal Highway Administration released its Safe System Roadway Design Hierarchy, which covers infrastructure countermeasures that can effectively reduce deaths and serious injuries from traffic crashes. The report is intended to be a tool to align the countermeasures and strategies used to apply the Safe System Approach of not accepting deaths and serious injuries. The report frames the existing Proven Safety Countermeasures in terms of how each one addresses this design hierarchy.
Safety applies not only to the occupants in vehicles, but also those traveling outside vehicles. Unfortunately, current vehicle safety ratings do not address safety for people outside of the vehicle. The regulation and design of vehicles can be used to reduce the severity and frequency of crashes to improve safety for everyone.
Technology can assist with safety, but it should not be relied on as the only solution, for example, thinking autonomous vehicles will solve safety issues. The Collaborative Sciences Center for Road Safety cautions against assuming that technology alone will solve the problem. The center encourages focusing on the basic principles, which apply at the local level: “Work with communities to manage travel speeds and reduce the number of vehicles on our roads through changes to built environments, policies, social norms, message framing, and incentives."17
While this element of the approach may feel out of the realm of state and local agencies, there are opportunities at times to comment to the National Highway Traffic Safety Administration on vehicle regulations. Using influence as safety stakeholders can be a strategy in addition to focusing on areas where agencies have more control and responsibility over implementation.
The increasing size and weight of vehicles sold in the U.S. have led to concerns about safety impacts, especially for people walking and bicycling.19 Some local communities in the U.S., such as Washington D.C., are considering addressing larger and heavier passenger vehicles, such as increasing taxes on those vehicles. Newer vehicles often have blunter and higher front ends. These impact pedestrians more severely than smaller cars and trucks do because the point of impact is higher on the human body. The Insurance Institute for Highway Safety published research in 2023 that showed larger vehicles were 45% more likely to cause death in crashes with pedestrians.20
The Collaborative Sciences Center for Road Safety notes in their list of the top Safe System implementation pitfalls that all too often, shared responsibility is equated with equal responsibility. Yet the power to change the transportation system is unequal, as is the role in physical impacts in a crash. Drivers and pedestrians and bicyclists do not share equal responsibility since drivers of vehicles cause the impact. Users of the transportation system do not share the same power to change the system that engineers and elected officials may have. Some road users, such as pedestrians and bicyclists, are also operating within a system that has, for a long time, often not been designed to adequately meet their needs. The transportation system needs to focus on reducing impacts to the most vulnerable users in settings where vehicles present dangers.
Emergency first responders are critical for people involved in crashes to ensure they get the medical care they need promptly, and this is more of a challenge in rural areas. This element also encompasses any needed traffic incident management, the forensic analysis done at crash sites, and other work.
Use of Safe System Approach
Regional studies should incorporate the Safe System Approach and understanding in their work, including prioritizing crashes that would result in death or serious injury and addressing all modes. In November 2023, the Federal Highway Administration released a report on the Safe System Approach for the Urban Core that includes checklists for application at the policy, program, and project levels along with case studies.
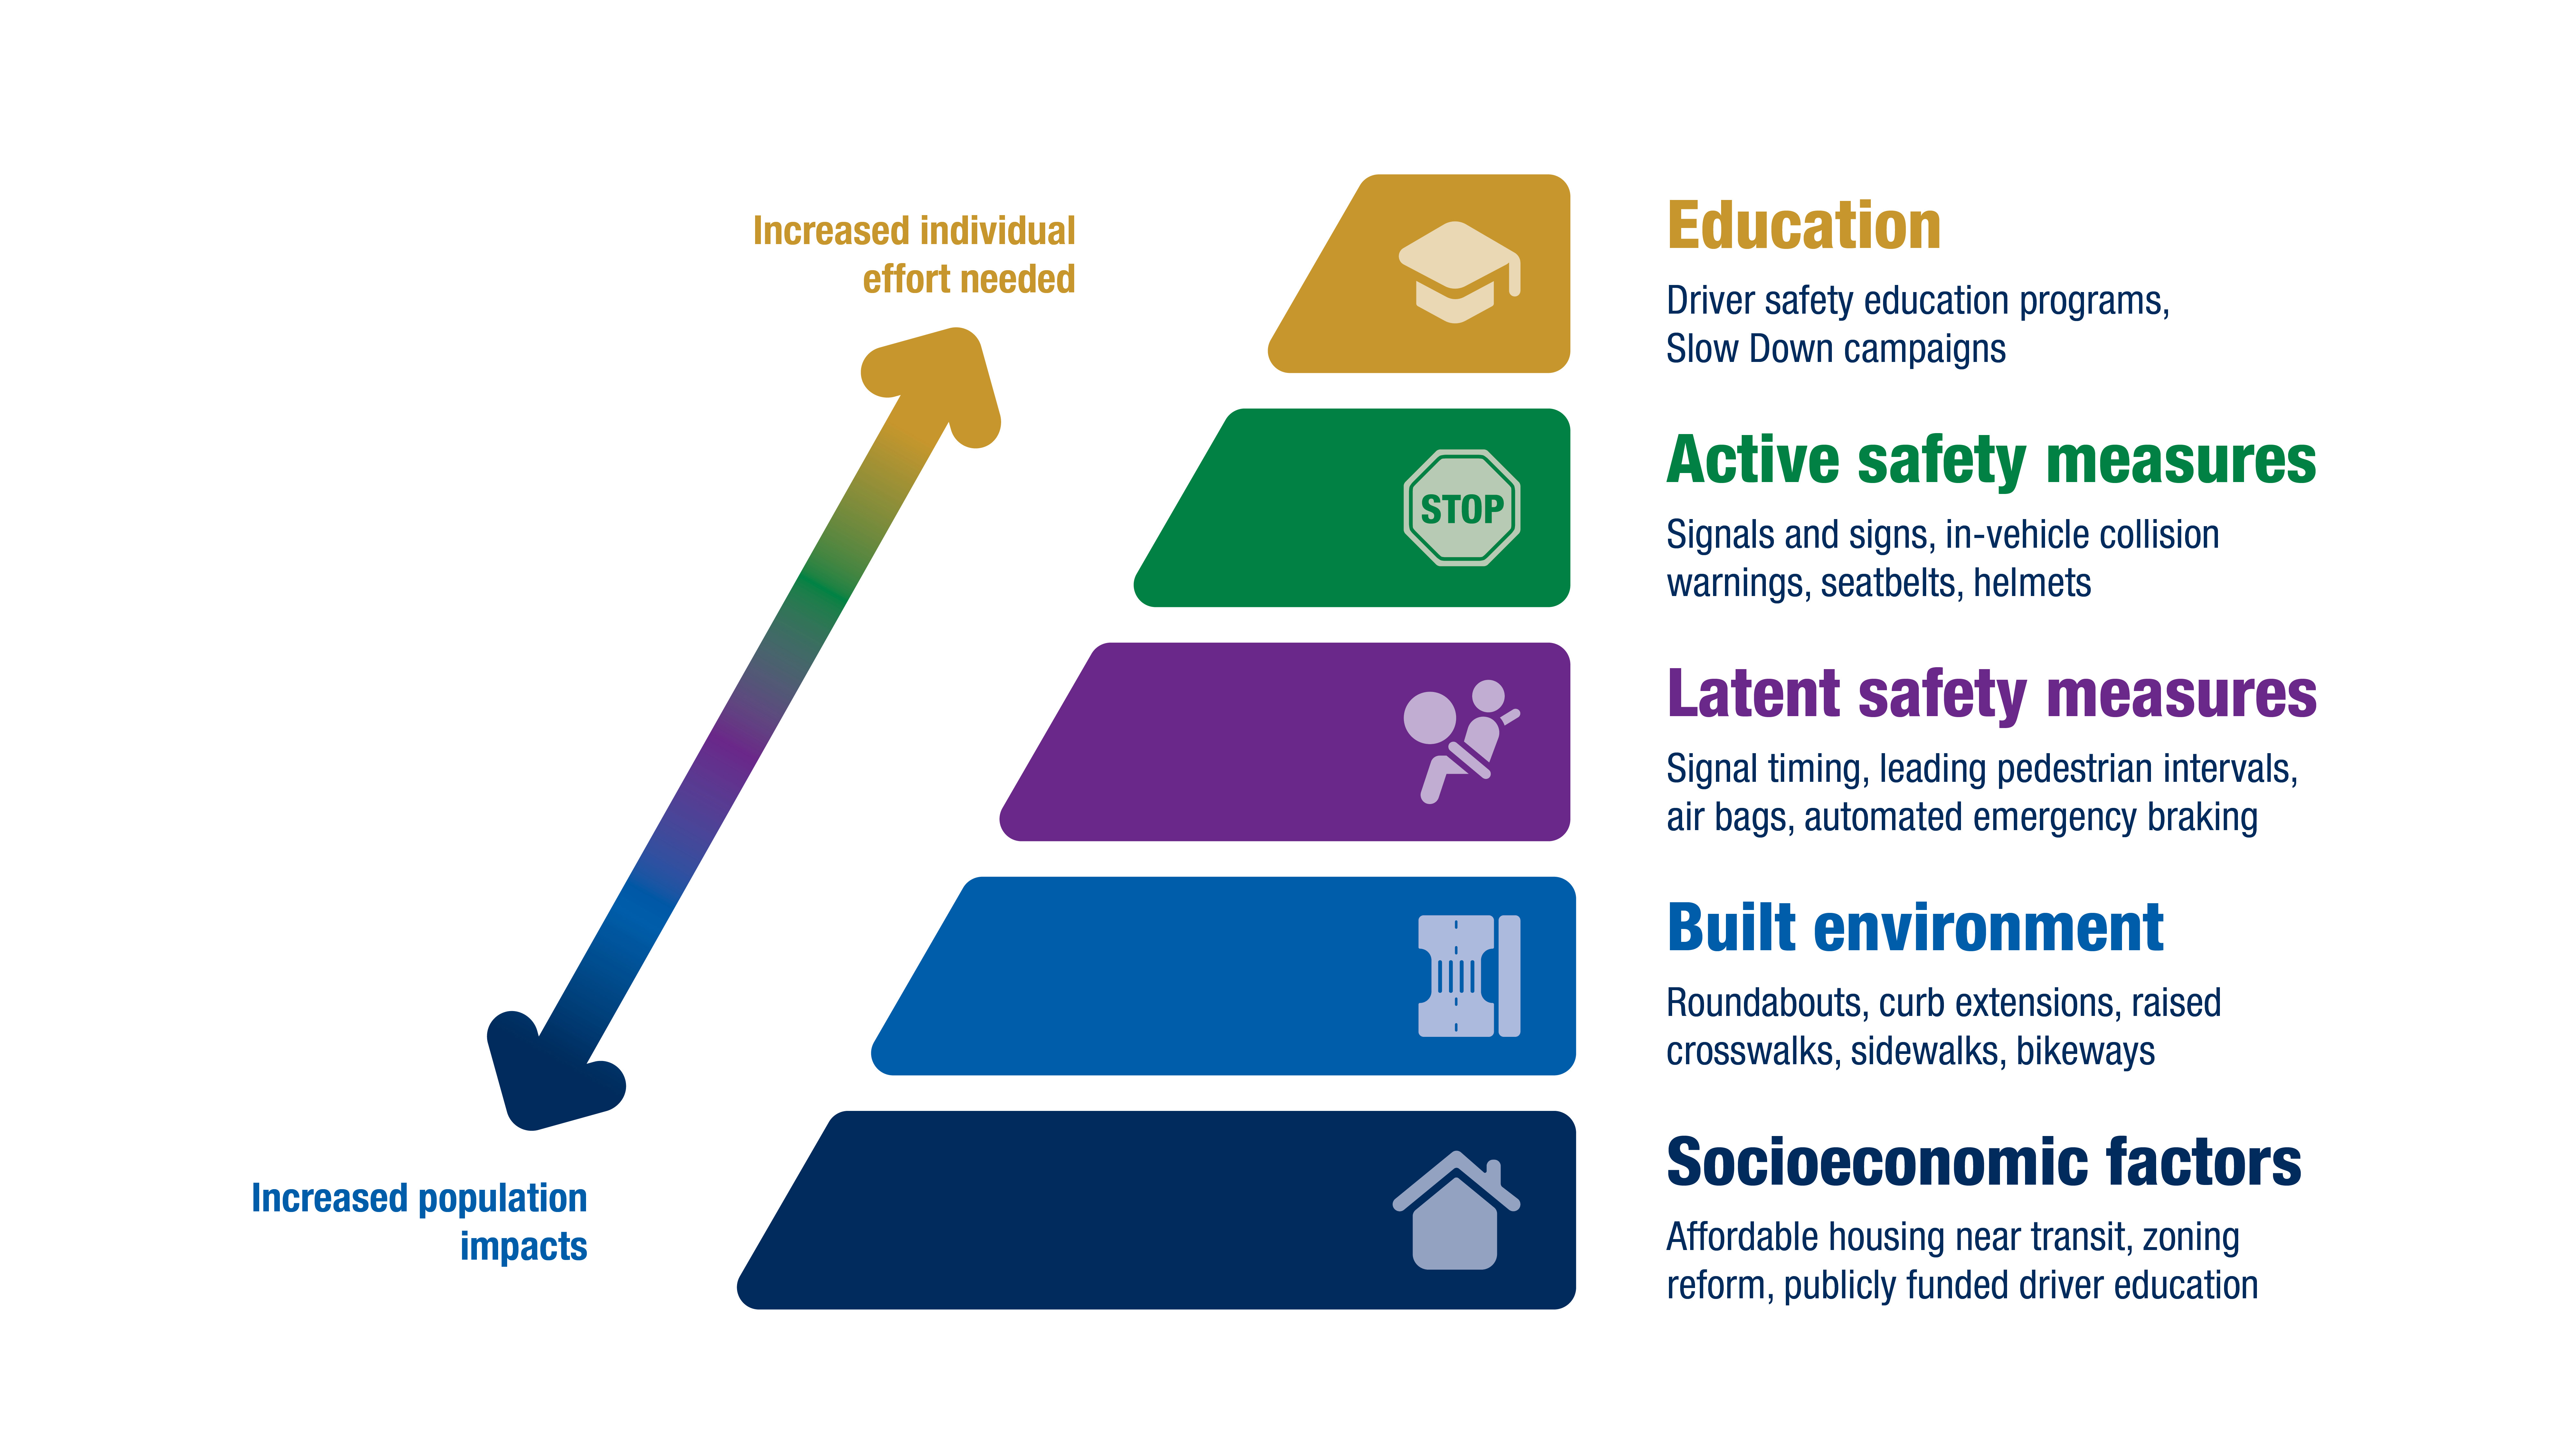
Integration of public health with Safe System Approach
Incorporating a public health framework in transportation safety could be helpful in addition to using a Safe System Approach. Recent research proposed a Safe System pyramid to better connect public health principles with transportation safety work.21 Five tiers build this pyramid approach, beginning with socioeconomic factors that are addressed by approaches such as better connecting housing with transit, reforming policies to support reducing vehicle miles traveled, and incorporating safety features in commercial vehicle fleets to more broadly affect health of the population. Changes to the built environment and built-in safety measures such as automated speed enforcement and vehicle standards form the middle tiers. The remaining two tiers focus more on individual effort such as following signals and signs and education campaigns; these are less effective at population-wide levels from a public health perspective. This approach recognizes that impacts from vehicle speeds are the primary cause of injury in traffic crashes that need to be prevented for health outcomes.
Figure 1.7: Safe System Approach pyramid
Safety, comfort, and belonging while traveling
Feeling safe, comfortable, and welcome while traveling means a wide range of things to different people – varying widely depending on intersections of race and ethnicity, gender, age, and disability, and other aspects of people’s identities. Facilities beyond traditional transportation infrastructure can be crucial for safety and comfort, especially for people walking, rolling, biking, and riding transit. (Facility design for these modes is discussed more in each modal investment plan.) These facilities include shade, places to sit and rest, public restrooms, drinking fountains, and eyes on the street from people who may be of assistance when needed.
One of the most challenging areas for addressing safety, comfort, and belonging while traveling in the U.S. and the Twin Cities region is disparities across race and ethnicity. As an example, in the early years of the COVID-19 pandemic, harassment of and hate crimes against Asian Americans increased dramatically in the U.S. In Saint Paul in 2021, a community group volunteered to patrol the Frogtown neighborhood near light rail stations and provide escorts for Asian American people to and from the light rail to help provide more of a sense of safety for them.22 The fear felt by many Asian Americans during this time and its effects on travel was brought up by participants in the Met Council’s Transportation Needs in Daily Life study. One focus group participant among caretakers in Anoka County said:
“There were a lot of Asian people that were targeted during COVID. My parents were stuck in the house and totally didn’t want to go anywhere. I would have to encourage [my parents] and say we’re going to the park we always go to. There’s not that many people, but my dad is always very alert. He wants to go where people can see us. It’s sad that they felt they couldn’t go and enjoy their walk. That’s where I come in as a caregiver and say ok let’s go, I’m here.”
Analyses of enforcement data show that people of color experience a disproportionately higher likelihood to experience traffic stops on roads or enforcement on transit. At the request of the Minnesota Legislature, the University of Minnesota Law School conducted the 2003 Minnesota Statewide Racial Profiling Study.23 It found that “drivers of color are overrepresented among those stopped; overrepresented among those searched; and underrepresented among those found to have contraband on their person or in their vehicle as a result of being searched.”
Unfortunately, the 2003 report is the most recent analysis available at a statewide or regional level. Minnesota does not require local police departments to collect traffic stop data including race, so there is not a consistent database to use for routine analysis on potential racial disparities across jurisdictions. Current federal funding promotes the development of statewide data collection and programs to reduce racial disparities in traffic stops. In 2021, the Bipartisan Infrastructure Law increased funding to the National Highway Traffic Safety Administration and flexibility for grants under the federal Section 1906 program to prohibit racial profiling and reduce disparate impacts from traffic stops. This federal funding is an opportunity to address the issue across both the region and the state.
While regional or statewide analysis is hampered by the lack of consistent data, analysis has been done of some local agencies individually. In 2015, Metro Transit analyzed its police incident data by race and found disparities in its treatment of people of color. In 2023, the U.S. Department of Justice and the U.S. Attorney’s Office released an investigative report of the Minneapolis Police Department. As part of this report, they reviewed traffic and pedestrian stop data for the City of Minneapolis for potential racial disparities. This analysis found that Black and Native American people were stopped disproportionately to their population. The analysis also found that traffic stops differed by the predominant racial demographics of neighborhoods; mostly white neighborhoods had fewer minor traffic stops when compared to neighborhoods with more people of color.24
In 2021, Ramsey County changed its traffic stop policies and practices to decrease nonpublic-safety traffic stops such as expired tags or minor equipment violations to reduce racial disparities and focus on public safety issues. The county’s analysis found that Black drivers were four times more likely to be stopped than white drivers for these types of violations. After the changes were implemented in some local police departments within the county, the county found that Black drivers experienced a 66% decrease in nonpublic-safety traffic stops, and the changes did not have an effect on crime in the county.25
The Met Council’s Transportation Needs in Daily Life study highlighted disparities in experiences. The study policy recommendations included repairing and eliminating harms and injustices toward Black people, Indigenous people, and people of color. The study noted these groups “face more safety issues while traveling because of historically discriminatory attitudes and policies embedded in society” and in transportation-adjacent areas like policing, regardless of if they are walking, riding transit, biking, or driving.
Experiences while traveling and choices made for traveling can be very different based on gender and sexual orientation. The Met Council’s Transportation Needs in Daily Life study heard from women who shared stories of harassment, abuse, or violence when they traveled. People who are part of the LGBTQ+ community can also experience verbal or physical harassment or violence while traveling. Personal safety and security concerns lead some of them to restrict travel, especially at night. As part of the daily needs study, one focus group participant among Asian youth in Ramsey County said:
“I guess just being a woman and visibly queer makes it much harder to travel on the bus or train. Because you can be subject to lots of harassment. At night you should not be on the train because of creepy people. Particularly this one night on the train I was in the back, against the wall, these two guys got on. The older guy was beating the younger guy up. I looked around for the number to call or text, but I couldn’t see it.”
Men can also have personal security concerns, but they tend to be significantly lower than those experienced by women. MnDOT released a study in 2023, “Advancing Equity in Accessibility and Travel Experiences: The Role of Gender and Identity,” that found that intersectionality is key when considering gender. Other characteristics such as race, age, and family role intersect with gender with different outcomes and needs. The study also found that nonbinary people “have worse subjective well-being outcomes” than either women or men.
In addition to considerations outlined in the Pedestrian Investment Plan, people with disabilities may have greater needs for supportive facilities such as public restrooms and places to rest. The Twin Cities Public Transit and Human Services Transportation Coordinated Plan from 2020 identified the lack of accessible public restrooms, shelters, and benches along transit routes as a challenge for people with a wide range of medical conditions or disabilities. The plan identified the need for coordination on access or provision of these services as a strategy to address the needs of people with disabilities. As with many other considerations for people with disabilities, such as curb ramps, the broader public would also benefit from these supportive services along transportation routes. For people with cognitive disabilities, clear wayfinding and communication can be especially important for travel.
Transportation benefits for public health
Transportation provides access to places and services that support physical and mental health.
Access to destinations and people
Transportation fundamentally is a means to the end of connecting us to the places and people we want and need to reach to live our lives. It enables us to do what matters the most in our lives. Transportation supports health by providing access to a wide range of needs and services, including:
- Affordable, fresh, and culturally appropriate food
- Health care services such as doctors, therapists, and pharmacies
- Supportive services such as religious or spiritual services and places
- Community support groups such as sobriety or grief meetings
- Education and employment
- Social and recreational activities such entertainment, parks, and connections with family, friends, and community members.
 Physical activity
Moving supports both physical and mental health.
In 2015, the U.S. Surgeon General released a call to action to promote walking and walkable communities in recognition of the important role walking plays in public health. Walking provides numerous health benefits, including:
- Decreased risk of cardiovascular disease
- Lower blood pressure
- Maintenance of mobility for those with arthritis
- Improved happiness and relief from anxiety and depression
Bicycling also provides many of the same benefits. With the increase of electric-assist bicycles, more people have access to bicycling than before. Electric-assist bicycles support people with chronic health conditions who may not have been able to reliably or comfortably bicycle without them. Many transit riders can reach the recommended levels of physical activity through their regular walking or biking to connect to transit service and destinations.
Mental health
Communities that are more walkable support social connectedness where it can be easier to talk with neighbors and others.26 In 2023, the U.S. Surgeon General highlighted the impact that increases in loneliness are having on Americans’ mental and physical health and called for, among other things, communities designed to promote social connections.
These social connections don’t always have to be close. Research has shown that weaker ties to people, such as someone a person might frequently chat with at the grocery store in their neighborhood, are also important in maintaining a sense of social connectedness.27 Having more of a mix of types of daily interactions is associated with increased happiness.
Dr. Yingling Fan at the University of Minnesota mapped emotions associated with trips people made in the Twin Cities region. Her research discovered that people who biked or walked reported feeling happier more often. Considering how the spaces we move through make us feel can help create better conditions for well-being.
Transportation impacts to public health
Negative impacts from transportation affect our health in many ways, through air and noise pollution, traffic crashes, and creating barriers for communities. In addition, transportation intersects with public health in situations where the core causes are outside of the transportation system, but they play out on the transportation system, such as for people who are unhoused and seek shelter on transportation right-of-way or transit. In all cases, impacts can be disproportionate for people of color, and/or who live in poverty or are disabled.
 Lack of access to destinations
Many people experience a lack of access to the destinations for primary needs in daily life. This can result in isolation (especially during winter), delays in receiving health care and other needed services, insufficient amounts of nutritious and fresh food, and underemployment or unemployment.28,29,30
 Air pollution
Exposure to traffic-related particulates in air pollution is associated with increased risks for dementia, asthma, cardiovascular and heart disease, chronic obstructive pulmonary disease (COPD) and other respiratory diseases, and breast and lung cancer.31
Recent research has acknowledged that air pollution impacts from transportation are not just from exhaust emissions. Tire and brake particles, which are currently unregulated, are contributing to heart and lung disease.32 A shift to electric vehicles may help address emissions from exhaust but will not address the unregulated health impacts from these pollutants, and the increased weight for electric vehicles accelerates tire wear and, consequently, particle pollution.33
In 2022, the Minnesota Pollution Control Agency and the Minnesota Department of Health released the updated report Life and Breath: Twin Cities Metro Area. It estimated annual health impacts of air pollution by ZIP code for the seven-county region. The analysis found that although overall air quality has improved, the region continues to have health impacts from fine particles (PM2.5) and ozone pollution. These impacts continue to be disproportionate for neighborhoods with larger percentages of residents who are Black, Indigenous, people of color, people who have low incomes, people who do not have health insurance, and people with disabilities.
All of the metro region is within an Environmental Protection Agency-designated attainment area for carbon monoxide (CO), for coarse particulate matter (PM10) and for all other transportation-related air pollutants regulated by the Clean Air Act. Until September 24, 2022, parts of the region had been in nonattainment or in maintenance areas for one of the above pollutants, and analysis was performed under the Federal Transportation Conformity Rule to determine conformity of the Imagine 2050 TPP and TIP to the Clean Air Act. While conformity analysis is no longer required, the Minnesota Pollution Control Agency continues to monitor air pollution throughout the region and compare it to federal standards.
People are also exposed to harmful air pollution from other sources than transportation, and this can make it more challenging to be outdoors, especially to walk, roll, and bike and for people who are unhoused.
Minnesota set records for poor air quality in 2023, according to the Minnesota Pollution Control Agency (MPCA), which issues air pollution alerts for the state. The state had 52 days with air quality alerts in 2023. Of these, 13 were orange level alerts, and 9 were red level alerts. Orange and red levels are considered unhealthy, and recommendations include limiting time spent outdoors. Smoke from Canadian wildfires contributed to 16 alerts in 2023.
With the climate crisis, wildfire smoke is likely to continue as a potential health hazard from the increased frequency and length of wildfires due to changes in the climate. Reducing trips during these events is a recommended mitigation to lessen the combined impact with traffic pollution and reduce exposure to smoke. However, people who have fewer transportation and economic choices are less likely to be able to work from home or make other modifications, so they are more vulnerable to health risks from exposure to the smoke.
The region could think differently about the interaction with public health and the transportation system by considering transit facilities as locations for efficient distributions of needed supplies to higher-risk people. As an example, when smoke from the 2023 Canadian wildfires reached New York City, the State of New York distributed free high-quality N95 masks to the public in high-traffic areas such as transit stations and state parks to help people protect themselves from negative health impacts caused by breathing in the wildfire smoke.
 Heat impacts
Our built and natural environments affect heat. As heat waves are expected to increase, our built environments need to be more resilient to extreme heat to support the increased impact the heat has on health. One example highlighted in the Met Council’s work on extreme heat is that asthma attacks can be triggered by extreme heat, and more severe asthma attacks can be related to heart attacks. Residents of neighborhoods that are hotter due to more pavement and buildings that hold heat with less green space to help cool can be subject to increased health conditions from extreme heat. Increasing tree canopy is one strategy to help counter impacts from heat.
 Noise
Noise
Noise exposure from traffic increases risks for heart attacks, cardiovascular disease, strokes, sleep disturbances, and cognitive issues.34 While noise walls related to highways are one potential mitigation, busier arterials may still have higher levels of noise that can’t be addressed with noise walls. In many communities, significant portions of multifamily housing are sited on these busier arterial roads, subjecting their residents to increased noise.
Mental health and community connections
Traveling by any mode can be associated with stress and anxiety for some people. When walking, rolling, or bicycling, people can feel more exposed to the dangers of vehicle traffic, weather, or fearful for personal security. Drivers can feel stress in different contexts, including some from traveling at increased speeds on highways, in congestion during rush hours, in interactions with aggressive drivers, or after crashes. As part of the Met Council’s Transportation Needs in Daily Life study, one participant in a focus group for Latino caregivers in Ramsey County talked about the stress associated with driving:
“Previously, I didn’t drive. I had panic attacks, okay? I would [get stressed] in my shoulders and my head. After three years, I started driving but I wouldn’t drive far because I crashed on the freeway. But after five years, I took a course in Maplewood Mall. I would think to myself ‘How am I going to get to work? How am I going to get to work?’ This was an enormous stress for me. Truly. The truth is that I was losing sleep [over it].”
Transportation infrastructure has been responsible for disruption of social and community connections at different scales. The commonly cited example from the Twin Cities is the construction of I-94, which destroyed the predominately African American Rondo neighborhood in Saint Paul. The community in Saint Paul has been working to try to get the damage repaired in some forms, including a possible lid over the interstate in the Rondo area. This is far from the only highway that disrupted communities in this region. In 2024, the Met Council will begin a study on the harm done in the region by freeways.
 Traffic crashes
Deaths and serious injuries from traffic crashes are the most direct impact of the transportation system on health. Impacts from serious injuries can lead to lifelong consequences for some people. Traffic safety was previously discussed in more detail.
Lack of affordable housing
One of the core requirements for overall health and well-being includes shelter. While providing shelter is not a primary purpose for transportation, vehicles are often used as places of shelter for people experiencing insufficient affordable housing options.
The region currently lacks a coordinated strategy for affordable housing, including shorter-term shelter, across local jurisdictions. As a result, people may either seek shelter on transit vehicles or camp in public right of way along highways and streets. The Minnesota Homeless Mortality Report 2017-2021 from the Minnesota Department of Health found that residents who are unhoused have a death rate that is three time higher than the general population.
Metro Transit’s Homeless Action Team has been working for several years to help connect people who are seeking shelter on transit with needed services. In 2023, funding from the state legislature supported the creation of the Transit Service Intervention Project for Metro Transit. In this project, Metro Transit contracted with 10 community-based organizations to expand the outreach to better connect people to needed services, like those related to housing or addiction.
Learning from COVID-19 to support public health
The onset of the COVID-19 pandemic in early 2020 highlighted many of the known issues at the intersections of transportation and public health. Fundamentally, transportation enables the spread of illnesses through connecting people across space, especially with airborne viruses such as COVID-19.
The COVID-19 pandemic highlights that transportation needs to be better designed to help minimize the spread of infectious diseases while supporting our connectedness and health. The climate crisis is also associated with increased risks of future pandemics, so learning from COVID-19 can prepare the region for future possibilities. Potential implications for the transportation system include:
- Better ventilation and filtration are key for indoor spaces, including transportation facilities, to reduce transmission of airborne infectious diseases. Far-UVC light technology can help disinfect air in spaces, both indoor and concentrated outdoor ones. Applications of these technologies can improve health for people using transportation facilities and at sites of transportation-related employment. In addition, improving indoor air quality for all buildings can also help mitigate health effects of outdoor air pollution from transportation since the majority of our exposure to outdoor air pollution happens while we are indoors.35 Air pollution also needs to be reduced at the source rather than solely relying on indoor air quality mitigation.
- The significant shift to telework, flexible work, and holding remote or combined in-person and online events increased opportunities for some people with disabilities who had previously been excluded. Maintaining remote participation options for work, recreation, social interactions, and government participation provides a venue for protecting public health while expanding opportunities for participation for a wider range of people. Reducing the need to travel also helps address the need to reduce vehicle miles traveled.
Recent work by the Met Council
Public Health
The connection between public health and transportation is a new area of focus for Imagine 2050. As a result, previous work on this topic has been limited but is expected to increase.
Safety
The Met Council has completed multiple safety-focused plans and studies since the last update to the Transportation Policy Plan. The Pedestrian Safety Action Plan aimed to enhance pedestrian safety by identifying high-risk roadway characteristics and locations, regardless of recent crash history, and targeting improvements in these areas to reduce injuries and fatalities. Key findings indicate that pedestrian crashes are more likely on roadways with specific features: lower speed limits and two-lane undivided roads in rural areas; moderate speed limits and traffic volumes with transit presence in suburban areas; and lower speed limits with higher traffic volumes and transit presence in urban areas. More details are available in the Pedestrian Investment Plan
The Intersection Mobility and Safety Study looked to investigate ways to improve the efficiency and safety of principal arterial intersections in the Twin Cities metro by identifying high-need intersections and providing local agencies with implementation strategies. The study's analysis showed significant benefits from previous intersection improvements, with annual delay and safety benefits of $1 million and $7 million respectively. The study highlighted the effectiveness of both at-grade and grade-separated projects in addressing high-need intersections based on mobility, safety, multimodal elements, and equity performance measures. More details are available in the Highway Investment Plan.
The Met Council will complete a Regional Safety Action Plan by the end of 2024. The goal is to build a foundational safety plan for the region to aid local partners. The work of this plan will include the following major elements.
- Identify high-injury streets with concentrations of fatal or serious crashes.
- Proactively analyze systemic risk factors for crashes involving bicyclists or motorists.
- Include information on countermeasures and programmatic recommendations.
- Identify higher-priority corridors for safety.
- Help communities create safety action plans to apply for federal Safe Streets and Roads for All grants.
- Amend recommendations into the Imagine 2050 Transportation Policy Plan as appropriate.
Supporting work by partners
Public health
Minnesota state agencies have played a supportive role in connecting transportation and public health.
- MnDOT’s Statewide Multimodal Transportation Plan (2022) includes a commitment to healthy, equitable communities and improving health with transportation using a Health in All Policies approach throughout planning, programming, inventory, and project delivery. The plan also includes other actions like supporting options for walking, biking, rolling, improving air quality and reducing noise related to transportation, and measuring elements like air quality, the proportion of people who walk or bike, and multimodal access to destinations.
- The Met Council worked with the Minnesota Department of Health and the Public Health Law Center on a Healthy Community Planning project that was designed to elevate public health challenges in the region.
- The Minnesota Department of Health works with transportation through its Statewide Health Improvement Partnership that supports active living, along with other planning and program work to encourage walking and bicycling to support healthy communities. This partnership funds work done by many city and county public health departments to support walking and biking. The department has hosted Walkable and Bikeable Communities workshops across the state and provides technical support for local agencies and communities working to improve conditions for walking and biking.
- The Minnesota Pollution Control Agency works to help reduce transportation-related emissions from greenhouse gas emissions, along with working to address air, water, and land pollution and climate.
Safety
Improving traffic safety requires work from many partners in different disciplines and at all levels of government.
- The National Roadway Safety Strategy was released in January 2022 by the U.S Department of Transportation and sets a vision of zero roadway fatalities, adopts the Safe System Approach, and identifies priority actions to reduce fatalities and serious injuries.
- The cornerstone of the state’s traffic safety work centers in a partnership with the Minnesota Departments of Health, Public Safety, and Transportation for the Toward Zero Deaths program. In 2023, the state legislature created the statewide Advisory Council on Traffic Safety to advise the commissioners of these three state agencies and the governor on policies, programs, and services related to traffic safety, encourage research on safety topics, and review grants related to traffic safety. Local agencies participate in both of these partnerships.
- The Minnesota Department of Transportation has multiple plans and programs which directly touch on traffic safety.
- The Statewide Multimodal Transportation Plan includes strategies, actions, and performance measures for transportation safety.
- The Strategic Highway Safety Plan guides the state’s safety programs and policies. It identifies the key, data-driven focus areas and strategies to help reduce deaths and serious injuries from crashes on the transportation system. This plan sets the long-term state goal of zero deaths and serious injuries from traffic crashes.
- The Vulnerable Road Safety User Assessment includes data analysis and strategies for pedestrian and bicyclist safety and is considered an addendum to the Strategic Highway Safety Plan. This work identifies a high injury network and systemic analysis for MnDOT-owned facilities to identify higher risk areas.
- District Safety Plans within MnDOT will look at regions within the state. In addition, other planning work such as corridor plans and system plans include safety elements.
- County-level road safety plans are currently funded by MnDOT and implemented by the counties’ public works departments. Initially the plans were done between 2008 and 2013 with plan updates beginning in 2016. These plans develop prioritized lists of safety projects for county roadways with systemic analysis.
- Some cities have also already completed safety plans as well. Minneapolis developed the 2023-2025 Vision Zero Action Plan to guide its work, and the city received a $20 million implementation grant for systemic infrastructure improvements through the federal Safe Streets and Roads for All discretionary program. Saint Paul also completed a Safety Action Plan for the city in 2023 and was awarded a nearly $16 million implementation grant from the same federal program in 2024. MnDOT is also funding pilots for city road safety action plans.
- Through the federal Safe Streets and Roads for All discretionary program, other cities and counties in the region have received funding to develop city safety action plans. Recent recipients of these planning grants include Apple Valley, Bloomington, Brooklyn Park, Columbia Heights, Cottage Grove, Eagan, Edina, Elk River, Fridley, Hastings, Hennepin County, Hopkins, Monticello, New Brighton, Shakopee, St. Louis Park, West St. Paul, and Woodbury.
Our region is dynamic and resilient
Transportation needs to be dynamic, so we can adapt to changing needs and provide people with more choices and access. We need to create and maintain transportation resilience, so we can withstand and recover from disruptions to how people and goods move throughout the region. And we need those transportation choices to be reliable and affordable.
Objectives
- People and businesses trust that transportation infrastructure and services will withstand and recover quickly from natural and human-caused disruptions.
- People have better travel options beyond driving alone to meet their daily needs, with a focus on improving travel times, reliability, directness, and affordability.
- People have more predictable travel times when traveling on highways, with a focus on reducing excessive delays.
- People and businesses can rely on predictable and cost-effective movement of freight and goods.
Performance measurement
Performance measures help evaluate how well the Imagine 2050 Transportation Policy Plan is addressing the region’s goals and objectives, as defined in this plan and Imagine 2050. The Dynamic and Resilient goal area includes measures that are required to be tracked by the federal government, with additional measures to be tracked regionally for the purposes of this plan. The measures used to track performance for a dynamic and resilient system in this plan are bridge and pavement condition, system reliability, congestion mitigation, transit asset management, infrastructure vulnerability to extreme heat and flooding, and critical bridges. More on these measures can be found in the Imagine 2050 TPP Evaluation and Performance section.
According to recent measures, travel time reliability has increased since the COVID-19 pandemic. Travel time reliability measures the proportion of auto travel that incurs typical travel times. It indicates how predicable auto trip times are. A higher percentage means more consistent travel times and a lower percentage means more inconsistent travel times. Before COVID, travel time reliability was around 75%. Since the pandemic, travel time reliability has risen above 90%, but has been slowly dropping in 2022 and 2023. It is important to continue monitoring this measure to see the longer-term post-COVID-19 travel trends.
Another measure of reliability is the average weekday delay per capita. The Met Council’s travel model estimates that the median auto delay per traveler is just under 9:45 minutes per day. That means that over the course of an entire day, congestion adds about 9:45 minutes of extra travel time for automobile travel. This delay stays relatively constant in 2050, even with forecasted population gains. The Met Council forecasts that median weekday delay per capita will be just over 10 minutes in 2050.
Policies
The Imagine 2050 Transportation Policy Plan sets 17 policies related to transportation choice, reliability, and resilience. These policies and their supporting actions are detailed in Policies and Actions.
Policy 1. Maintain a robust and current set of data, maps, plans, processes, and applications to support regional transportation planning.
Policy 2. Ensure the region has funding to achieve our goals.
Policy 3. Asset management activities and investments must also seek to advance regional goals and objectives.
Policy 15. Plan and implement a complete bicycle network including local networks that connect to the Regional Bicycle Transportation Network alignments to provide connections between regional destinations and local bicycle networks.
Policy 16. Identify, prioritize, and improve locations where network gaps or physical barriers (like rivers, freeways, and rail corridors) may impede nonmotorized travel.
Policy 17. Provide regional funding and tools to support planning and implementation for pedestrian travel at the local level.
Policy 18. Use a variety of transit service types to match transit service delivery to meet residents’ daily needs based on transit markets.
Policy 19. Plan for, invest in, and implement a network of transitways to expand access to reliable, frequent, high-capacity transit services.
Policy 20. Coordinate transit service delivery and operations to create a high-quality rider experience.
Policy 21. Use travel demand management to plan, fund, and promote multimodal travel options and alternatives to driving alone.
Policy 22. Provide high-quality connections within and between modes of transportation.
Policy 23. Implement a Complete Streets approach in policy, planning, operations, and maintenance of roads.
Policy 24. Plan for and invest in first/last-mile freight connections between major freight generators and the regional highway system.
Policy 25. Provide transportation options and transit advantages on roadway corridors with delay and travel time reliability issues.
Policy 26. Focus highway mobility investments on corridors with high levels of existing delay and travel time reliability issues.
Policy 27. Identify and implement activities and investments that will mitigate current or anticipated climate or weather-related impacts.
Policy 28. Pursue opportunities to minimize disruption and nonrecurring delay from weather, security, and traffic incidents.
Work program
The Imagine 2050 Transportation Policy Plan identifies the specific work program items related to this goal area.
Choice
Expanding travel choices is already a strong, existing theme in previous work programs, including a regional sidewalk inventory study. In this plan, this work is expanded include identification of pedestrian and bicycle overpass and underpass improvements, creation of a microtransit policy framework, updating the arterial rapid transit network, and developing a typology of Complete Streets sensitive to land use context to support functional classification.
Resilience
In response to increased need and focus on resilience, the work program includes completing and maintaining a Resilience Improvement Plan tailored to the needs of the region, and an analysis of the regional roadway network to identify where system redundancies are needed to improve resilience to disruptions.
Reliability
The work program will build on existing studies related to system reliability with new work, including travel demand management implementation guidance and frameworks, study of urban pavements, an update to the regional freight study, identification and prioritization of transit advantages investments, and investment in traffic management technologies to mitigate congestion.
Major topics
The goal of a dynamic and resilient region has context centered around three focus areas: providing transportation choices, being resilient to disruptions in transportation, and building a system that is reliable to users.
Choice
The core purpose of transportation is to provide access to the places people and goods need to reach. These needs vary by geography and a person’s circumstances, for example, whether they have a car available, are traveling with passengers, or have limited mobility. The region needs to provide travel choices that recognize people’s dynamic needs.
We are still learning from the lasting changes brought on by the COVID-19 pandemic, which highlighted how dynamic our travel needs are. The onset of the pandemic caused a significant part of the workforce to transition to telework. Years later, many workers continue to work in hybrid or remote environments. Fewer office trips have changed the operational characteristics of highways and transit.
Limited access without a vehicle
Many people in the Twin Cities region lack choices to meet their evolving travel needs. According to the University of Minnesota Accessibility Observatory, the average Twin Cities resident had access to 1,265,953 jobs within 30 minutes by auto36 in 2021, ranking ninth in the nation. This contrasts with only having access to 20,370 jobs by transit37 within 30 minutes (13th in the nation) and 22,460 jobs by low-stress biking within 30 minutes (10th in the nation).38
Figure 1.8: Jobs with in a 30-minute commute
![]()
As a result, people who do not have a car, or people who want options other than driving, have fewer opportunities to participate in the region’s economy. Improving the variety of travel choices should improve our region’s ability to attract and retain talent and businesses.
The disparate access between people who drive and people who ride transit negatively impacts transportation equity in the Twin Cities. About 55% of transit riders in the region are Black, Indigenous, or people of color,39 compared to these racial identities being 30% of the regional population.40 Less access to destinations by transit relative to driving means Black people, Indigenous people, and people of color have lower access to destinations, as a higher percentage of people with these racial identities use transit.
Access to nonwork destinations also matters. Only about 21% of total trips in the region are for work commutes. The majority of trips are for a variety of other purposes (see Figure 1.9). Only 19% of transit trips are for peak-hour work commutes, and only 33% are for commutes at all (see Figure 1.10).41 People use transit for a wide range of other needs, including for errands, education, socializing, and health care.
Figure 1.9: Trip purpose from the 2021 Travel Behavior Inventory household survey, all forms of transportation
![]()
Figure 1.10: Trip purposes from the 2022 transit on-board survey
![]()
Improving the menu of travel choices
The region’s current transportation and land use are largely oriented around private automobiles, but there are substantial opportunities for growth in other modes. A large portion of auto travel throughout the region consists of trips that are relatively short. In 2023, the Met Council studied mode shift potential of existing travel demand. The study found that about 25% of current auto trips in the region could feasibly shift to walking, biking, or transit with competitive travel times.42 People will not consider these modes unless they are timely, reliable, direct, safe, and affordable.
Transit
In the decades prior to the COVID-19 pandemic, transit use saw substantial growth as the system underwent expansions, primarily in transitways and suburban express markets. The region’s transit ridership grew from about 65 million in 1995 to over 98 million in 2015, a 50% increase in 20 years.
Regional transit ridership was down over 50% during the first few years of the pandemic, but ridership is growing again as service is being restored to pre-pandemic levels. Over 35% of the region’s transit ridership takes place on the growing network of transitways that are being implemented, an indication of the impact of significant investments in improving the system. As of early 2024, Metro Transit’s high-frequency and bus rapid transit routes have recovered a combined 78% of their pre-pandemic ridership, while other Metro Transit local routes have recovered 51% of pre-pandemic ridership.
The region’s development patterns are also changing in response to this demand. Since 2009, 34% of regional development has been permitted along high-frequency transit. This includes 53,200 multifamily units that represent 40% of the region’s total. As of 2023, an additional 36,900 units of multifamily housing are planned to be near high-frequency transit, with 47% of all planned developments located near high-frequency transit.43
Regional investment in fast and frequent service on transitways, paired with transit advantages, will make transit more timely, direct, and reliable for more people. See the Transit Investment Plan for descriptions of the opportunities to invest in improved transit.
What are "transit advantages"?
Transit advantages are features or equipment that allow transit to travel faster than general traffic, including:
Transit-only street segments
Bus-only shoulders and lanes
High-occupancy vehicle (HOV) lanes and managed lanes
Ramp-meter bypasses
Traffic signal queue jumps
Transit signal priority
Curb extensions
Bicycling, walking, and rolling
Safe, direct, and reliable infrastructure for bicycling, walking, and rolling provides people in our region another choice for short-distance trips. The Twin Cities region is nationally renowned for its bicycling infrastructure. PeopleForBikes, a nonprofit bicycle policy and trade organization, consistently ranks Minneapolis and Saint Paul as two of the best large cities for biking. In 2023, Minneapolis topped the chart as the best large city to bike in, and Saint Paul ranked seventh.44
While our region can celebrate these successes, it comes with recognition that bicycling, walking, and rolling remain challenging in most of the region. There are many barriers to traveling these ways and continued improvement can reduce these barriers for potential users.
This plan sets policies that will guide those infrastructure investments through the Regional Solicitation, active transportation sales taxes, and other funding programs. How our region approaches land use policy, described in Imagine 2050, is also a key part of creating and improving places to support more walking, rolling, and biking trips.
The Met Council maintains two major planning tools for improving bicycling in the Twin Cities:
- The Regional Bicycle Transportation Network sets investment priorities for a seamless network of regional bikeways. The network advances a variety of principles to make biking a more attractive and realistic transportation choice for people in the Twin Cities.
- The Regional Bicycle Barriers identifies physical barriers to bicycling in the region, such as waterways, railroads, and certain highways. Identifying these areas helps transportation partners discover opportunities to remove barriers and prioritize investments.
This plan supports improved access and safety while bicycling, walking, and rolling through updates to planning tools, direction to invest in All Ages & Abilities and Complete Streets infrastructure, and direction to coordinate across project and jurisdiction boundaries.
What do “All Ages & Abilities" and "Complete Streets" mean?”
All Ages & Abilities is an approach to bicycle infrastructure design that meets the needs of a broad range of users. Instead of designing primarily for confident bicyclists, this approach seeks to accommodate users across age, race, and income groups traveling for a variety of reasons.45
Complete Streets is an approach to designing and operating streets to improve safety for all users, sensitive to surrounding land use and a street’s function. These projects include elements that reduce crash risks and make streets more comfortable for use by all forms of transportation.
The Imagine 2050 Transportation Policy Plan also makes a key commitment to improving bicycling, walking, and rolling in the region through adoption of the Safe System Approach, a framework for prioritizing safety investments and identifying shared responsibilities. Primarily described in the Our Region is Healthy and Safe goal, an important part of improving the attractiveness of this choice is making sure people feel safer, more comfortable, and more welcome when bicycling, walking, and rolling.
See the Bicycle Investment Plan for more information on major issues related to bicycling. See the Pedestrian Investment Plan for further description of major issues related to walking and rolling.
Travel demand management
Travel Demand Management is strategies, programs, and incentives that inform and encourage the use of sustainable transportation options. These initiatives inspire new travel habits and support the most efficient use of the transportation system. Travel demand management has proven benefits as well:
- A detailed study, Travel Demand Management: An Analysis of the Effectiveness of TDM Plans in Reducing Traffic and Parking, measured trip generation at nine typical office buildings in the Minneapolis-St. Paul region. It found that office buildings that implemented travel demand management plans generate, on average, 34% to 37% less traffic and need 17% to 24% fewer on-site parking spaces than Institute of Transportation Engineers’ predicted rates.46
- The Atlanta Clean Air Campaign's Cash for Commuters offered drive-alone commuters a daily cash incentive ($3/day) for using an alternative mode (carpool, vanpool, transit, bike, walk) for up to 90 days. An independent evaluation showed that the incentive caused 1,800 commuters to switch modes, resulting in 1,300 fewer vehicle trips and 30,000 less VMT on the region's highways. More importantly, over 70% of incentive recipients continued their new commute mode after the subsidy lapsed, and half were still using a nondrive-alone mode one year later.47
These examples, among many others, demonstrate that people want and are willing to make different travel choices if they are supported with resources to feel confident.
See the Travel Demand Management Investment Plan for a description of related investment opportunities.
Resilience
The Imagine 2050 Transportation Policy Plan frames transportation resilience as withstanding natural and human-caused disruptions. The regional approach to building resilience in responses to these disruptions is detailed in Policies and Actions.
Natural disruptions are forces of nature that occur without human input, including:
- Seasonal flooding
- Typical winter storms
- Wildlife migration
Human-caused disruptions are a result of human action, regardless of scale of time, including:
- Security (for example, criminal activity or terrorism)
- Negligence (for example, failure to maintain bridge safety)
- Extreme weather events and heat resulting from human-caused climate change
- Nonrecurring congestion when related to major incidents.
During natural and human-caused disruptions, transportation infrastructure and services should continue operating continuously so long as safety and health are not impaired. After disruptions, transportation infrastructure and services should recover quickly with minimal repair needed.
Changing precipitation
The Fifth National Climate Assessment includes a summary of anticipated risks and impacts to transportation in Midwest states like Minnesota. It says that Midwest states will experience extreme rainfall events that can disrupt roadways, sidewalks, trails, railroads, and waterways.48 In addition, changes in salt use may lead to earlier bridge corrosion and widening cracks.49
Extreme heat
Extreme heat poses many threats to transportation, from physical infrastructure disruptions to direct impacts on people. The Fifth National Climate Assessment summarizes extreme temperature impacts across forms of transportation:50
- Walking, biking, and rolling: Heat exposure can adversely impact health and encourage people to shift trips to vehicles and transit to avoid heat.
- Aviation: Extreme heat can cause runway damage, flight disruptions, and increased bird strikes.
- Roadways: Extreme heat can increase pavement buckling, create unsafe heat conditions for roadway workers, and demand more frequent maintenance.
- Rail: Extreme heat can cause rail buckling, prompt speed restrictions, and sag power lines.
The Met Council’s Climate Vulnerability Assessment (2018) summarized climate-related impacts in Minnesota, including a likely increase in the number of heat waves in future summers. Additionally, the Met Council maintains a dataset estimating land surface temperature across the region.
Infrastructure renewal, repair, and replacement
Resiliency includes ensuring that infrastructure and systems do not deteriorate or become obsolete, so infrastructure remains safe and reliable. For example:
- A road with a lot of potholes will be difficult for drivers to navigate, cause vehicle damage such as flat tires or broken axles, and pose injury risk to bicyclists, which can negatively affect reliability.
- A bridge that is due for replacement may have a travel restriction for certain vehicle types and force freight vehicles to divert miles out of the way to find an alternate route.
- A bus that is older and past its useful life is more prone to breaking down.
- A road that was built 50 years ago may not meet minimum accessibility standards for people who have disabilities, requiring them to navigate an unreliable crossing or make a significant detour.
The Imagine 2050 Transportation Policy Plan supports projects that renew, repair, and replace transportation infrastructure to allow for effective travel. These projects are an opportunity, and expected, to advance Imagine 2050 goals, including the Our Region is Dynamic and Resilient goal:
- Pavement and rail maintenance keeps or improves travel time reliability for drivers, transit riders, bicyclists, and freight users.
- Bridge reconstruction can prevent disruption to travel due to restriction, collapse, or flooding, and remove crossing barriers to improve travel choice.
- Roadway reconstruction can improve reliability for all forms of transportation using that roadway, such as accessibility improvements for people with disabilities, transit advantages like floating bus stops, and intersection features that reduce crashes and related traffic disruptions.
- Transit fleet replacement can maintain or improve transit service reliability and expand the range of affordable travel choices.
See the Highway Investment Plan and Transit Investment Plan for specific approaches to infrastructure renewal, repair, and replacement activities.
Highway reliability
When travel times are unpredictable, people and businesses in the region pay additional costs in lost time to participate in our regional economy. The Imagine 2050 Transportation Policy Plan recognizes the need for all forms of transportation to be reliable so people and businesses can perform everyday tasks without worrying that transportation infrastructure and services will fail them. This plan identifies a few ways that travel reliability potentially impacts the region’s outcomes.
Roadway congestion and delay
Most people in the Twin Cities region will likely still drive for most of their trips. In 2020, delay per commuter in the Twin Cities was comparable to other similarly sized metropolitan areas across the nation.51 In 2021, the region had the ninth-highest job accessibility by vehicle in the United States,52 and has consistently been ranked in the top ten for several years.
However, the region must continue to address excessive travel delays to retain our high standard of living and regional, economic competitiveness. That’s why the Met Council, Minnesota Department of Transportation, counties, and cities are partnering to address the worst areas of excessive delays and unpredictable highway travel, alongside access improvements for all forms of transportation.
The Twin Cities Highway Mobility Needs Analysis found that delay per person would increase by 33% by 2040 if highway mobility funding ceased to continue. The analysis found that increased investment in highway mobility could decrease delay per person, increase job accessibility, deliver travel-time cost- savings, minimize freight bottlenecks, and reduce transit delays for transit users using these same highways.
The Highway Investment Plan defines when investments are needed to address congestion, and it describes the region’s layered approach to prioritizing the most cost-effective, lowest-impact investments first.
Freight reliability
Our regional economic competitiveness relies on a transportation system that supports the needs of both businesses and consumers.
This plan seeks to help businesses transport freight and goods more reliably and cost effectively through roadway, bridge, and system management investments, including:
- Focused investments to address excessive highway delays.
- Managed capacity improvements, such as managed lanes that allow access for certain vehicles during congested times for a fee.
- Resilience investments that ensure transportation infrastructure and services will withstand and recover quickly from disruptions.
- Parallel, redundant options so deliveries are not disrupted by detours.
Recent work by the Met Council
Choice
The Transit Service Allocation Study looks to guide regional investments for transit service by facilitating discussions, understanding mobility needs, and evaluating expansion scenarios in the region to meet expected population and job growth in the Twin Cities to 2040. The Metro Transit Network Next Arterial Bus Rapid Transit Study focused on the nearer term expansion of the arterial bus rapid transit network. The study identified three new arterial bus rapid transit routes that are now being planned and implemented.
The Mobility Hub Planning Guide created a document to aid in the planning and implementation of mobility hubs to support better connections between transit and other modes of travel in the region.
The Regional Bicycle Transportation Network (RBTN) Bicycle Facility Guidelines and Measures and Regional Bicycle Barriers Study further refines and aids the identification and expansion of the RBTN established by the Met Council in 2014 to better build out the regional bicycle system to connect residents to regional jobs, recreation, and commercial areas.
The Regional Travel Demand Management (TDM) Study reviewed ways to increase travel options, reduce single-occupant vehicle use, and improve regional livability by identifying and implementing effective TDM strategies. The study refined approximately 100 potential strategies down to six key recommendations, each with detailed action steps, emphasizing equity and leveraging a variety of funding sources to support implementation.
Resilience
Addressing transportation resilience will be more important as risks rise with the increasing impacts from climate change and deferred maintenance. The Met Council’s 2018 Climate Vulnerability Assessment identified localized flooding risks, including transportation assets vulnerable to flooding. Future efforts on this topic will focus on implementing a resilience improvement plan and identifying needed system redundancies to better withstand unforeseen incidents. More on these future efforts can be found in the Imagine 2050 TPP Work Program.
Highway Reliability
The Freeway System Interchange Study, Twin Cities Highway Mobility Needs Analysis, and Intersection Mobility and Safety Study all further refine highway mobility and reliability needs in the region and build on previous studies to ensure the system remains reliable for regional travel.
The Regional Truck Highway Corridors Study and Update and Urban Freight Distribution Study updated freight corridors in the region, and expand the Met Council’s understanding of future freight trends and needs to ensure the regional freight system remains efficient and able to prepare for changes in regional and local freight patterns.
Supporting work by partners
State work
The Minnesota Department of Transportation is a key partner for improving multimodal choices, transportation system resilience, and highway reliability in the Twin Cities. Supporting work includes:
- The Congestion Management Safety Plan, Phase 4
- Research projects such as:
- An ongoing update to the Metro District Freight Plan
- The draft state Resilience Improvement Plan for transportation
We lead on addressing climate change
The transportation sector is the leading emitter of greenhouse gases in the U.S and in Minnesota. Transportation contributed 25% of all greenhouse gas emissions in Minnesota in 2020 (Figure 7).53 The electricity generation sector had been the leading contributor to greenhouse gas emissions; however, this sector has reduced greenhouse gas emissions faster than the transportation sector.
Greenhouse gas emissions from travel come from a fundamental relationship between two factors: the amount of travel and the type and efficiency of fuel used. The region’s response in the Imagine 2050 Transportation Policy Plan is organized around objectives that address transportation greenhouse gas emissions, access to lower emission fuel sources, and how much we travel.
Figure 1-11: Greenhouse gas emissions by economic sector, Minnesota, 2005-2020
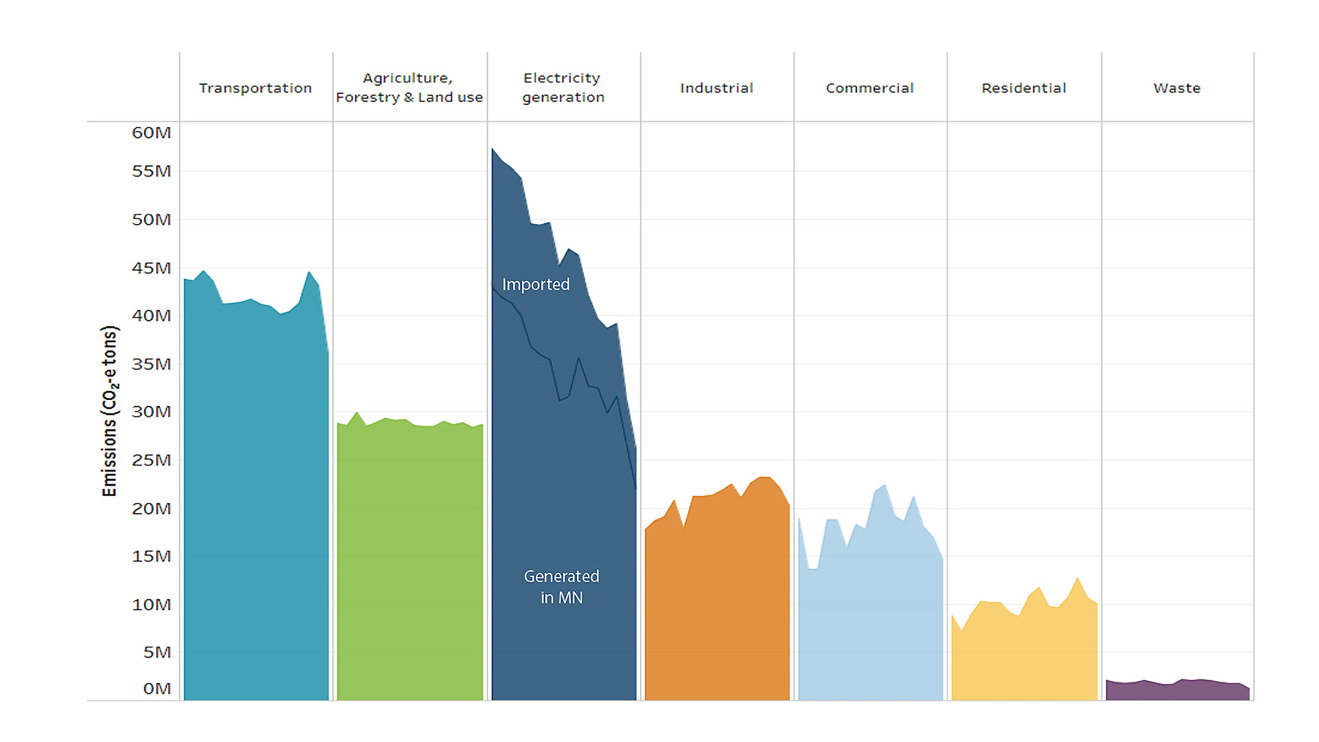
Objectives
These objectives will guide how transportation can help the region lead on addressing climate change impacts:
- The region’s transportation system minimizes its greenhouse gas emissions.
- People have more reliable access to zero emissions vehicle infrastructure.
- By 2050, the region reduces vehicle miles traveled by 20% per capita below 2019 levels.
This goal addresses mitigation (reduction) of greenhouse gas emissions. The Our Region is Dynamic and Resilient goal addresses how we adapt to ensure our communities and systems are resilient to climate impacts.
Performance measurement
Within the Twin Cites metro area, we forecast declining greenhouse gas emissions from on-road emissions between 2025 and 2050. These are expected to decline 27% due to continued improvements in fuel efficiency and a growing share of electric vehicles. This plan’s modeled investments are estimated to add to greenhouse gas emission 0.2% over this time period. The modeled investments include larger-scale transit and highway investments. Smaller investments in these categories and for electrification, bicycling, walking, and rolling reflected in this plan are not captured in our regional model and their impact is not reflected in these estimates of the plan’s contributing or mitigating effect to climate change.
Vehicle miles traveled per capita between 2025 and 2050 are forecasted to decrease by 3% absent the investments evaluated in the regional model. These investments are estimated to increase vehicle miles per capita by 0.4%.
Policies
The Imagine 2050 Transportation Policy Plan sets three policies related to transportation climate mitigation. These policies and their supporting actions are detailed in Policies and Actions.
Policy 29. Ensure the availability, visibility, and accessibility of electric vehicle charging infrastructure.
Policy 30. Evaluate and mitigate the greenhouse gas impacts of transportation plans and projects.
Policy 31. Prioritize projects that reduce vehicle miles traveled (VMT) through sustainable transportation options.
Work program
The Imagine 2050 Transportation Policy Plan work program identifies specific tasks to implement this goal, such as:
- Planning for a public electric vehicle charging system that serve all users
- Better understanding the co-benefits of achieving vehicle miles travelled reduction
- Improved methods for estimating the change in greenhouse gas emissions from various transportation investments
- Evaluating and sharing best practices across agencies.
These work program items may also lead to additional work that will support the implementation of new tools and methods for implementing the Policies and Actions.
Major topics
The context for transportation and climate change is focused on three topics: transportation’s contributions to greenhouse gas emissions, zero-emission vehicle access, and vehicle miles traveled. Other less significant considerations are also addressed in this section.
Transportation’s contributions to greenhouse gas emissions
Greenhouse gas emissions from the transportation sector are largely the result of burning fossil fuels to propel vehicles, but also include emissions that result from the manufacturing and disposal of vehicles, and the construction and operation of roads and other transportation facilities.
A decline in emissions of 18% was seen in Minnesota since 2005, largely through increased fuel efficiency and reduced travel during the early years of the COVID-19 pandemic. In 2020, the transportation sector in Minnesota contributed approximately 36 million CO2-equivalent tons of greenhouse gas emissions, or 25% of all greenhouse gas emissions in Minnesota.
Light-duty trucks, which includes many sport-utility vehicles (SUVs) and minivans, and passenger cars comprise 55% of transportation emissions (Figure 8). Along with heavy-duty trucks and other smaller contributors, surface transportation represents 76% of transportation’s emissions. As a result, the most effective tactics for addressing greenhouse gas emissions are to target these travel modes.
Figure 1-12: Transportation sector greenhouse gas emissions, Minnesota, 2020
![]()
Note: Greenhouse gas emissions from the transportation sector are mostly from burning fossil fuels resulting in, most importantly, carbon dioxide. Relatively smaller amounts of methane and nitrous oxide also result from air conditioning hydrofluorocarbons. These smaller contributors are converted to carbon-dioxide equivalents based on their impact on the climate so that all of these can be reported together as carbon-monoxide equivalents, CO2e.
Zero emission vehicle access
MnDOT’s State Multimodal Transportation Plan includes a commitment to ensure that all new light-duty vehicles registered in Minnesota are zero-emission vehicles by 2035. This could lead to approximately 45% of all light-duty vehicles in Minnesota being zero-emission vehicles by 2035 and 65% by 2040. This plan builds on that commitment at the regional level. There are some external challenges to zero emission vehicle expansion including:
- Affordability and equitable access
- Global supply chain and implications for fair labor and environmental practices
- Implications for the sustainability of transportation system funding currently from fuel taxes
The region cannot directly address these challenges. However, the following describes key trends and opportunities for regional investment in zero emission vehicle access.
Trends
While population and vehicle miles traveled have grown in Minnesota, the greenhouse gas emissions from transportation declined 18% from 2005 to 2020, according to GHG data produced by the Minnesota Pollution Control Agency.54 This is largely due to reduced vehicle miles traveled and air travel during the COVID-19 pandemic, but longer-term improvements are due to improvement in vehicle fuel efficiency including through improved internal combustion engines, and hybrid, plug-in hybrid electric vehicles (PHEV), and battery electric vehicle (BEV) technologies. While each of these has and will continue to contribute greatly to reducing greenhouse gas emissions, BEVs are uniquely capable of approaching zero tailpipe emissions within the light-duty passenger cars and light-duty trucks categories.
Figure 1.13: More electric cars by 2030

Sales of plug-in hybrid and battery electric vehicles have grown from 200,000 vehicles in the U.S. in 2016 to an estimated 1.6 million in 2023, an eight-fold increase in 7 years55. Automakers are making large investments in the production of battery electric vehicles and their batteries, and some even committing to phasing out internal combustion engine vehicles. Estimates are that, by 2030, greater than two-thirds of global car sales could be electric vehicles as purchase prices fall below that of internal combustion engine vehicles as early as 2026.56
Greenhouse gas emissions from Minnesota’s power sector have dropped 40% over the last 10 years. Currently carbon-free sources (for example, solar, wind, nuclear, hydropower) produce 52% of Minnesota’s electricity.57 Given this mix of electricity generation, battery electric vehicles have 78% less life-cycle greenhouse gas emissions than gasoline vehicles.58 With Minnesota’s commitment to 100% clean energy by 2040, electric vehicles present an even greater opportunity to reduce greenhouse gas emissions over internal combustion-based fuel sources.
Opportunities
The public sector needs to support electrification with public charging infrastructure, public information, technical support to local agencies, and vehicle-purchase support. The region’s most important role lies in planning for a more reliable, equitable, and complete public charging system.
Although 80% of charging is currently done at home, lack of reliable public charging is one of the biggest barriers for most people considering the purchase of a BEV. Many people do not have easy access to charging at home (for example, multifamily homes, homes with limited off-street parking). People who do have easy access for charging at home need to know they can charge in public when traveling or when otherwise needed. The Met Council’s Electric Vehicle Planning Study found that, to reach 100% decarbonization in the transportation sector by 2050, 200,000 additional public charging plugs could be necessary, depending on several factors including the amount of fast charging.
The private sector and other nongovernment actors have invested in public charging across Minnesota. Currently the Twin Cities metro region has 1,176 charging ports available. Often more than one exists at an individual location and 174 of these are fast-charging ports.59 We can expect to see continued growth in public chargers; however, it will not meet the needs to accelerate BEV adoption.
This objective focuses on passenger cars and light-duty trucks due to potential scale to reduce greenhouse gas emissions, availability, and near cost parity. However, other sectors are making improvements as well, including efforts to electrify buses and heavy-duty trucks. Aviation, long-haul heavy-duty trucks, and marine applications are most likely to require other decarbonization technologies such as hydrogen and renewable liquid fuels.
Metro Transit has put eight battery electric buses into operation and in 2023 was awarded a Low or No Emission grant for procurement of 12 new battery electric buses and the chargers to support them. An example of a zero-emission bus transition plan is available on Metro Transit’s website. Metro Transit has set a target that at least 20% of 40-foot bus replacements purchased between 2022 and 2027 will be electric. About 33.3% of all transit rides in 2023 were taken on electrically powered transit vehicles including the Green Line and Blue Line light rail lines.
Vehicle miles traveled
MnDOT’s State Multimodal Transportation Plan includes a target to reduce vehicle miles traveled per capita (per person) 14% by 2040 (since 2019). This is equivalent to a 20% reduction by 2050. This target is a measure of how well our society is providing options other than driving alone (for example, carpooling, telework, riding transit, biking, walking, and rolling). The target is intended to encourage people to use a more sustainable mode of travel for some of the trips they normally take throughout the year or accomplish some of the same trips through online activities. The target is not intended to ask people to forgo trips they want to take. Several cities and counties in our region have also committed to reducing the number of vehicle miles traveled.
This plan builds on state planning to apply a regional perspective on vehicle miles traveled reduction that fits the context and approach the region is planning for. The Imagine 2050 Transportation Policy Plan is focused on how we travel and what mode of transportation we use. How far we travel on a typical day is governed by the distance between where we are and where we want to go. Land use planning has a large impact on these distances and relevant policy is described in detail in the Land Use Policy Plan.
Trends
Vehicle miles traveled typically grows with the population. More people often means more vehicle miles traveled; however, the amount of vehicle miles also depends upon the travel behavior of those people. Vehicles miles traveled is influenced by individual decisions such as what modes people take (for example, single occupancy vehicles, buses, carpools), how far they travel, and how many daily trips they make. Figure 1.14 compares the growth rate of the population since 2010 with the growth rate of vehicles miles traveled. The graph below shows that the percent growth of vehicles miles traveled closely followed population growth until 2020, when travel dropped during the pandemic. The Met Council forecasts that by year 2050, vehicle miles traveled will continue to grow with population, but at a lower rate due to things like demographic changes (for example aging population, smaller household sizes).
Figure 1.14: Change in population and vehicle miles traveled since 2010 with 2050 forecast (MPO area total)
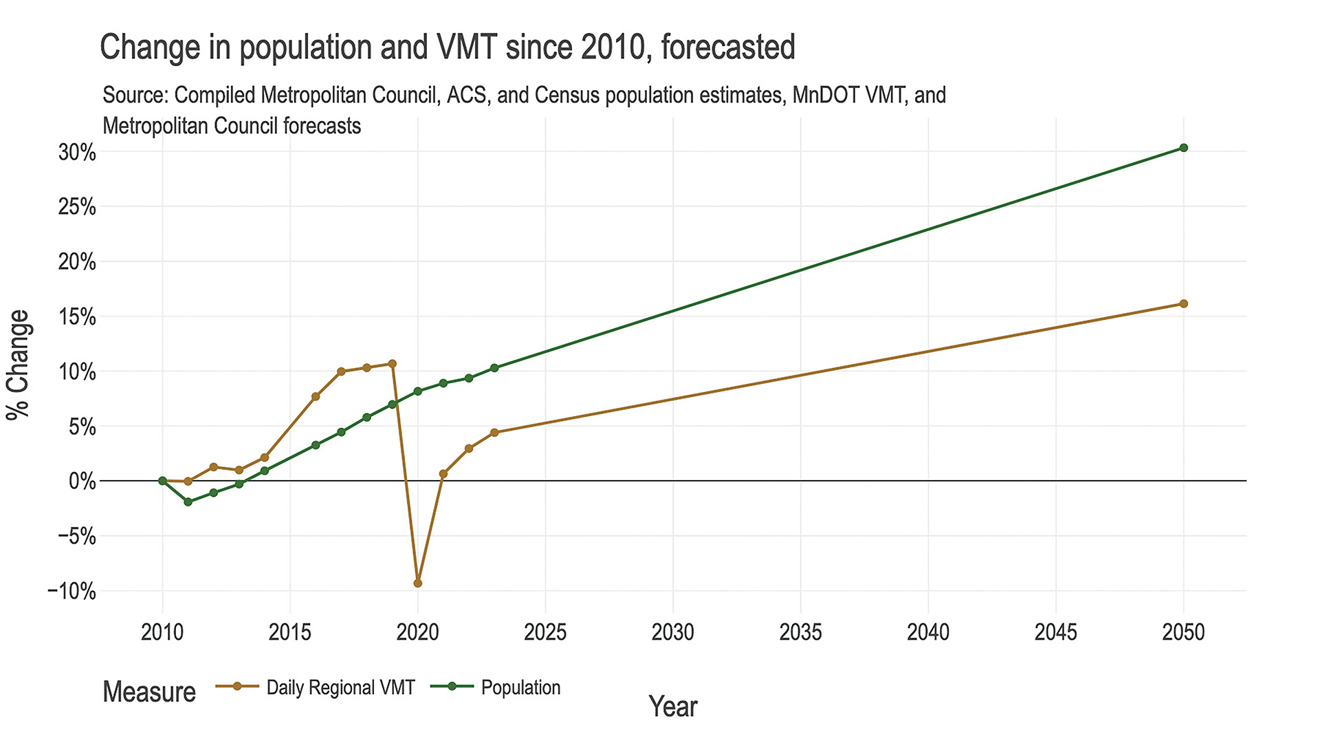
Transit ridership has recovered gradually since the COVID-19 pandemic began in 2020. A total of 53.2 million rides were taken on public transit in the Twin Cities metro region in 2023. This is a 16% increase in total ridership over 2022, which itself was a 23% increase over 2021 numbers. Ridership increases were seen on every service in the region. Growth was also seen on every mode in the regional system. This trend continues to show encouraging and consistent signs of recovery for the system. As service restoration and improvements continue, this number is expected to continue to improve.
This gradual recovery has varied by service type. Bus rapid transit and local bus routes have recovered more robustly than express bus service, which has been heavily impacted by ongoing telework trends. In general, the region plans to return to pre-COVID levels of transit service by 2025 with further expansion beyond the major projects identified as resources allow.
The region has invested in growing the network of transitways over the past two decades and will continue to plan, design, and build them throughout the region. While these transitways serve existing centers of housing, jobs, goods, and services, there is often an opportunity for additional economic development near the transit stations. From 2009 to 2022, the region saw $16.4 billion in development along high frequency transit routes.
Additional opportunities for expanding transit services, particularly bus rapid transit, are described in the Transit Investment Plan.
Opportunities
Reducing vehicle miles traveled is the most direct path to reducing greenhouse gas emissions. Each mile of vehicle travel reduced directly reduces fossil fuel consumption and the resulting greenhouse gases. It complements electrification and supports further and faster decarbonization of the transportation sector. The Met Council’s Maximum Mode Shift Study estimated that 25% of current private vehicle trips could feasibly and competitively switch to these more efficient modes, but because these were the shortest trips in the region, they represent only about 4.5% of VMT. The study also found that significant infrastructure improvements have the potential to increase feasible and competitive mode shift opportunities to 50% of trips and 16.5% of VMT.
This plan includes investments and specific plans that address transit, biking, and pedestrians. Improving these modes of travel, and their relative advantage compared with driving alone, reduces the need to drive alone and reduces the resulting VMT and greenhouse gas emissions.
Travel demand management describes a wide range of strategies that support the most efficient use of the transportation system by making personal travel options more flexible, understood, or convenient. The Imagine 2050 Transportation Policy Plan includes a new travel demand management plan; one of the goals of travel demand management is to reduce vehicle miles traveled. These strategies can include promoting travel options like transit, biking, walking, and ridesharing. They can also help reduce trips altogether through strategies like telework. This new plan was largely informed by the Regional Travel Demand Management Study.
Large highway expansion projects can lead to added driving by making driving trips relatively more attractive or by encouraging development that is auto dependent. But highways also serve less GHG-intensive modes of travel, and expansion projects often include infrastructure investments in these other modes as part of the larger project. Less GHG-intensive modes include transit, biking, walking, and rolling and are especially important in highways with more direct land access. So this plan prioritizes mobility investments by measures of excessive delay and reliability to focus expansion only where it is most needed. Highway investments are pointed toward shifting the relative advantages toward less carbon-intensive modes of travel by investing in transit advantages (for example, managed lanes that give an advantage to transit riders and carpoolers), complementary changes to highways where bus rapid transit routes are being developed, and safer and more efficient intersections and roads for those biking, rolling, and walking.
Other opportunities
Electrification and reduction of VMT noted above present the most immediate and largest opportunities to reduce greenhouse gas emissions. These strategies are especially well suited to address 55% of transportation’s greenhouse gas emissions that come from passenger cars and light-duty trucks. However, international, national, and state goals call for an economy-wide reduction of greenhouse gas emissions to net zero. These goals do allow for small amounts of greenhouse gas emissions to continue to be generated. These remaining greenhouse gas emissions must be only the most difficult to address and offset with technology and land management practices that remove carbon from the atmosphere. Other strategies are necessary to drive deeper and faster reduction of greenhouse gas emissions.
Heavy-duty freight and aviation produce 19% and 6% of greenhouse gases within the transportation sector, respectively. Some of these needs can be filled with BEVs. Hydrogen vehicles and distribution systems are being developed, which may fill needs that are more difficult to electrify. Biofuels are also being developed. However, questions remain about their ability to reduce greenhouse gas emissions, land and water use, and how they compete with food production needs.
Figure 1.15: EV owners of today are not the EV owners of tomorrow

The U.S. Department of Energy has selected the Heartland Hydrogen Hub, including multiple clean hydrogen projects from Xcel Energy, for award negotiations to receive up to $925 million. The award will serve as a catalyst for a future hydrogen ecosystem in the Upper Midwest.
Footnote: 60
E-commerce as a share of retail purchases has grown 11% per year nationally since 2010 and is expected to continue growing at a similar pace. E-commerce’s share of overall retail sales was 15% in 2023. By 2050, e-commerce may account for nearly 35% of total retail activity, according to the Urban Freight Distribution Study (insert link). The study also found that e-commerce deliveries create less than one percent of VMT, and only about 1.4% of greenhouse gas emissions, as compared with personal shopping trips, resulting in a net reduction in VMT and greenhouse gas emissions. Major investments in electrification will lead to even greater efficiency and further reductions in greenhouse gas emissions. Opportunities to take further advantage of e-commerce in replacing personal shopping trips and related climate mitigation strategies are addressed in the Imagine 2050 TPP Freight Investment Plan.
Smaller contributors to greenhouse gas emissions such as off-highway, railroad, marine, buses, motorcycle, and recreational vehicles will benefit from a mix of strategies mentioned earlier, as well as others. These add up to 10% of transportation’s greenhouse gas emissions. Greenhouse gas emissions from natural gas transmission and air conditioning are also estimated to sum to 10% of greenhouse gas emissions within the transportation sector. However, these emissions are not within the scope of a metropolitan planning organization to address.
Transportation does have influence over greenhouse gas emissions captured in other sectors of the economy, including the embedded greenhouse gas emissions in steel and concrete used to build and rebuild our transportation infrastructure. Encouraging lower GHG-embedded materials is within the purview of the transportation sector. Encouraging the use of electric, and maybe someday hydrogen, construction equipment can also reduce transportation’s contribution to climate change. At what times of day and at what rates electric vehicles are charged can influence the greenhouse gas emissions that result from the electricity generation sector and are influenced by transportation planning and investments.
Other work to support decarbonization strategies includes planning within each area of work, considering climate impacts in decision-making processes, and coordination and technical support among different levels of government, nonprofit organizations, and the private sector.
Recent work by the Met Council
The Electric Vehicles Planning Study lays the groundwork for the electrification of the region’s passenger vehicle fleet by studying the technical background and supportive actions regional partners can take, the investment needed to build and run a charging system, the positive impacts on climate change and public health, and the hurdles we face in adopting the technology.
The Maximum Mode Shift, a Vehicle Miles Traveled Reduction Study estimates the maximum amount of mode shift possible given existing transportation infrastructure, land use, and travel patterns. The outcomes of the study can then help guide infrastructure and services investment to support that behavioral change, while filling the gaps in the transportation system to make even greater shifts possible.
Other studies that discuss the expansion of travel choices that support a reduction in VMT were previously discussed under Our Region is Dynamic and Resilient.
Supporting work by partners
Our efforts to reduce greenhouse gas emissions are supported by our partners at the national and state level.
National work
In 2023, the U.S. Departments of Energy, Transportation, Housing and Urban Development, and the Environmental Protection Agency released the U.S. National Blueprint for Transportation Decarbonization. This framework of strategies and actions to remove all emissions from the transportation sector by 2050 recognized the need for coordinated action within the areas of improving community design and land-use planning, increasing options to travel more efficiently, and transitioning to zero-emission vehicles and fuels.
Infrastructure Investment and Jobs Act and Inflation Reduction Act
These laws created significant new federal funding programs that are implemented at the state, regional, local, and even household levels.
In 2021, Congress passed the Infrastructure Investment and Jobs Act, also known as the Bipartisan Infrastructure Law. This legislation included traditional transportation funding and created several new formula programs and competitive opportunities for GHG reduction by state and local agencies.
- Carbon Reduction Program: To reduce greenhouse gas emissions Minnesota will receive approximately $20.9 million with an annual increase of approximately 1.9%. Approximately $6M-$8M of these funds are allocated to the Twin Cities metro region and are discussed under the investment plan.
- Charging and Fueling Infrastructure Grant: Provides competitive funds to states, metropolitan planning organizations, Indian Tribes, counties, and cities to implement public EV charging in communities and along Alternative Fuel Corridors. This program is further discussed under the investment plan.
- National Electric Vehicle Infrastructure: This formula program provided MnDOT with $68 million over five years to install EV fast chargers across Minnesota along corridors that specifically serve longer trips including designated Alternative Fuel Corridors. This program includes many specific requirements and MnDOT is actively implementing this program. The Twin Cities metro region can expect to see five charger locations, each with at least four fast charger ports.
In 2022, Congress passed the Inflation Reduction Act, which included incentives for businesses and individuals to invest in a wide range of clean energy strategies including within transportation. This legislation also created the Climate Pollution Reduction Grants Program. Through this grant program, the U.S. Environmental Protection Agency has provided Minnesota and the Twin Cities metropolitan statistical area (including 11 counties within and surrounding the Metropolitan Planning Organization area covered by this plan) with $4 million and $1 million, respectively, to develop and implement ambitious plans for reducing greenhouse gas emissions and other harmful air pollution. These plans make those entities covered by each plan eligible for nationally competitive implementation funds of $4.6 billion.
State work
In 2007, Minnesota’s Next Generation Energy Act set its first GHG reduction goals to reduce economy-wide greenhouse gas emissions by 80% from 2005 to 2050.
In 2019, MnDOT released the Pathways to Decarbonizing Transportation Report. This report included action items MnDOT would pursue and showed how a mix of strategies could reach GHG reduction goals of 80% and 100% by 2050.
In 2020, MnDOT established a Sustainable Transportation Advisory Council of general public experts to make recommendations to the MnDOT Commissioner on strategies that help the agency reduce internal and general carbon pollution from transportation. This advisory council makes annual recommendations and includes work groups in the areas of Fueling and Powering and Reducing VMT and Improving
MnDOT published the 2021 Minnesota EV Assessment to document BEV market trends, strategies to increase BEVs, and actions the state can take to meet its BEV adoption and carbon reduction goals.
The 2022 Minnesota’s Climate Action Framework set a vision that includes economywide carbon neutrality across the state by 2050, as well as resiliency and equity. Measures of progress for transportation included reducing GHG from the transportation sector 80% by 2040, decreasing vehicle miles traveled 20% per capita by 2050, and reaching 20% electric vehicles on the road by 2030.
Chapter 5 of MnDOT’s 2022 Statewide Multimodal Transportation Plan includes commitments to decrease annual greenhouse gas emissions from the transportation sector by 80% by 2040, ensure that all new light duty vehicles registered in Minnesota are zero emission vehicles by 2035, and reducing the number of vehicle miles traveled across Minnesota per capita 14% by 2040 (analogous to Minnesota’s Climate Action Framework). This statewide plan guides MnDOT’s work and is the policy plan that guides all transportation planning in Minnesota.
MnDOT is working to implement 2023 state legislation to evaluate major highway-lane-expansion projects and intersection-to-interchange grade-separation projects on state highways (Transportation GHG Emissions Impact Assessment). These projects must include sufficient mitigation to meet state goals for greenhouse gas emissions and the VMT reduction. Minnesota Statute 161.175 states that projects must comply with this requirement effective February 1, 2025, before entering the Transportation Improvement Program.
Local work
Many local governments have developed or are developing climate action plans, including:
We protect and restore natural systems
Historically, regional planning viewed land, water, air, and other elements as resources and materials to be managed for human use. The Imagine 2050 plans seek to shift our region’s approach to natural systems by recognizing the intrinsic value of natural resources and ecosystems.
“Natural systems” includes the physical and chemical properties that comprise land, air, and water and their associated natural cycles, as well as ecosystems and the connections among various physical features, natural cycles, and human society.
Transportation uses land throughout the region in ways that impact natural systems, including:
- Pollution from transportation reduces environmental quality, and transportation infrastructure can collect pollutants on impervious surfaces.
- Transportation infrastructure disrupts wildlife through habitat loss, degradation, and fragmentation, disruption of natural topography and migration routes, and noise and light pollution.
Objective
This objective will guide how transportation can help protect and restore natural systems:
- The region’s transportation system protects, restores, and enhances natural systems (for example, air, water, vegetation, and habitat quality).
Performance measurement
Performance measures help evaluate how well the Imagine 2050 Transportation Policy Plan is addressing the region’s goals and objectives, as defined in this plan and Imagine 2050. Because protecting and restoring natural systems is a new goal area for the region, performance measures will continue to be developed in the future as there are no federally required measures for this goal area. The measure used to track performance for protecting and restoring natural systems in this plan is tracking the proportion of the region covered in impervious surfaces for roadways. Another measure, transportation stormwater conveyance systems in the region, is identified to be studied in the future. More on this measure can be found in the Imagine 2050 TPP Evaluation and Performance section.
Policies
The Imagine 2050 Transportation Policy Plan sets two policies related to transportation and natural systems. These policies and their supporting actions are detailed in Policies and Actions.
Policy 32. Prioritize projects that reduce total impervious surface coverage or minimize right-of-way needs.
Policy 33. Use existing transportation rights-of-way and transportation project development to protect and restore natural systems.
Work program
The Imagine 2050 Transportation Policy Plan does not identify work program items specific to this goal area; however, several work program items related to Complete Streets, air quality, and climate mitigation have inherent relationships to this goal area.
Major topics
Environmental quality
Air quality
Poor air quality can have detrimental effects on people and wildlife. This plan primarily addresses air quality impacts of transportation through the Our Communities are Healthy and Safe goal, which describes the impact on people of air pollution from all sources, including transportation.
Water quality
Pollution from transportation can reduce water quality. As such, there is a substantive existing regulatory framework to address this issue.61 Transportation infrastructure, such as roads, paths, and transitways, are large networks of impervious pavement. As a result, water cannot filter through to the ground when it collects on pavement. When water collects, such as during snow melt or rain events, it picks up oils, debris, and other pollutants on its way to stormwater infrastructure.62
Research supporting the Imagine 2050 Water Policy Plan identifies four contaminants of concern in our region: chloride, nutrients, PFAS, and volatile organic compounds.63 Transportation can be a source or concentrator of chloride and nutrients, primarily phosphorus. Salt and other solutions that help address snow and ice run off into water bodies and lead to higher chloride levels in water across the region,64 which cannot be effectively removed.65 Falling leaves, organic debris, and fertilizers that collect on roadways concentrate phosphorus in stormwater discharge into lakes, streams, and rivers.66
The Imagine 2050 Transportation Policy Plan advances water quality improvement through capital and operations actions identified in the Policies and Actions section. Some related actions include:
- Encouraging green stormwater infrastructure.
- Prioritizing projects that minimize impervious surfaces.
- Related research, training, and technical assistance.
Wildlife disruption
Transportation infrastructure has a wide range of disruptive impacts on wildlife:
- Transportation infrastructure fragments natural habitats, which can increase vehicle-animal conflicts.67 There are opportunities to incorporate native planting practices, roadway landscaping and vegetation, and other avoidance and mitigation measures.
- Tree removal for construction projects reduces shade for both people and animals and reduces habitat. Restoration of the tree canopy carries a regrowth lag.
- Noise68 and lighting69 from major roads as well as other forms of transportation (for example, air travel, railroads) can disrupt animal behavior patterns.
The Imagine 2050 Transportation Policy Plan seeks to improve transportation-wildlife interaction through actions identified in the Policies and Actions section. Some related actions include:
- Encouragement of varied plantings within transportation rights-of-way when appropriate.
- Priority for projects that avoid impacts or mitigate above and beyond project impacts.
- Support for related research.
Restoration
Transportation investments present opportunities for improvements beyond travel needs. For example, many implementing partners have considered or implemented road diets, reducing a four-lane roadway to a three-lane roadway primarily for related safety benefits. The remaining right-of-way can be repurposed for other uses, like adding trees, pollinator gardens, green stormwater infrastructure, or a variety of other enhancements.
This plan identifies related restoration activities for implementing partners to consider, such as:
- Maintaining or expanding plantings within transportation rights-of-way, like trees, bushes, grasses, and planted buffers.
- Incorporating habitat and natural features in stormwater management.
- Increasing use of native plantings and pollinators in project landscaping.
These actions are further detailed in Policies and Actions. Some related actions, particularly related to tree cover, appear with actions related to climate resiliency and Complete Streets.
Recent work by the Met Council
The Met Council has created multiple tools to track natural systems in the region to aid in regional and local planning work. The Met Council’s Community Development division has led mapping initiatives to track urban heat impacts, tree canopy, and flood risk in the region as parts of the 2018 Climate Vulnerability Assessment. The Met Council is also implementing the findings found in the Climate Action Work Plan, which guides internal actions in the Met Council and supportive actions for external regional partners.
Supporting work by partners
State work
State agency partners have existing technical assistance on natural systems restoration available for implementing partners. Examples include:
- The Minnesota Department of Natural Resources’ Guidelines for Managing and Restoring Natural Plant Communities along Trails and Waterways
- The Minnesota Board of Water and Soil Resources’ Wetland Restoration Guide
- The Minnesota Pollution Control Agency’s Smart Salting training program
- The Minnesota Pollution Control Agency’s Minnesota Stormwater Manual
Where goals meet
Imagine 2050’s goals intersect with each other in many ways. The following section will detail how each goal area interacts and intersects with each other in the context of transportation.
Our region is equitable and inclusive
Our communities are healthy and safe
All our region’s residents live healthy and rewarding lives with a sense of dignity and well-being. Many health and safety issues identified with transportation intersect with equity. The impacts often disproportionately affect people of color, people with disabilities, and people with lower incomes.
Our region is dynamic and resilient
In Imagine 2050, our region meets the opportunities and challenges of choice, access, and affordability faced by our communities. Choice, access, and affordability of transportation modes can make big differences in the lives of people who have been excluded in many ways.
We lead on addressing climate change
We are mitigating transportation greenhouse gas emissions and have adapted to ensure our communities and systems are resilient to climate impact. Climate change will most impact those who already bear the brunt of inequities, so their needs should be a starting point.
We protect and restore natural systems
We protect, integrate, and restore natural systems through transportation projects to protect habitat and ensure a high quality of life for the people of our region. An Indigenous worldview sees everything as connected rather than people being separate from nature. Minnesota’s non-Indigenous people are increasingly learning from the traditional ecological knowledge of the Indigenous people and Tribal Nations that share the state’s geography.
Our communities and healthy and safe
Our region is equitable and inclusive
Imagine 2050 calls for racial inequities and injustices experienced by historically marginalized communities to be eliminated and all residents to feel welcome, included, and empowered. This goal directly intersects with ensuring communities are healthy and safe, since transportation impacts or access barriers can contribute to many of these inequities and injustices.
Our region is dynamic and resilient
In Imagine 2050, our region meets the opportunities and challenges faced by our communities and economy relating to issues of choice, access, and affordability. Having choices for how to travel supports health by ensuring walking, rolling, and biking can be easily done across different types of communities. Having choices also supports people being able to choose the travel mode that feels safest to them.
We lead on addressing climate change
Imagine 2050 has a goal that we have mitigated greenhouse gas emissions and have adapted to ensure our communities and systems are resilient to climate impact. Climate change, including impacts from transportation greenhouse gas emissions, relates to health impacts from increased heat effects, flooding, and other extreme weather impacts, among other effects.
We protect and restore natural systems
In Imagine 2050, we protect, integrate, and restore natural systems to protect habitat and ensure a high quality of life for the people of our region. The health of natural systems is connected to people holistically. One example is how transportation impacts water quality, while people rely on clean water for drinking water and recreation.
Our region is dynamic and resilient
Our region is equitable and inclusive
Improving access to jobs, healthcare, groceries, and other daily needs – especially for people in disadvantaged communities – can help us achieve this equity goal.
Our communities are healthy and safe
Projects that repair, replace, and renew infrastructure to improve system resilience and reliability are an opportunity to upgrade infrastructure safety features and mitigate health impacts to advance this health and safety goal.
We lead on addressing climate change
Transportation resilience contributes to the climate goal by adapting to anticipated climate and weather-related impacts and expanding multimodal choices to encourage low-carbon transportation that mitigates climate impacts.
We protect and restore natural systems
Improvements to stormwater and ice management can advance the natural systems goal through reduced discharge impacts on waterways.
We lead on addressing climate change
Our region is equitable and inclusive
Climate change mitigation actions may have reparative benefits for those who have historically been disproportionately harmed by the placement of highways and other transportation decisions. Many climate mitigation actions in the transportation sector can reduce negative public health impacts, reduce costs of transportation, and provide greater access to transportation. There are also opportunities to target co-benefits and fully engage communities historically left out of decision making with climate actions.
Our communities are healthy and safe
Climate change mitigation actions have large benefits for public health, especially in reducing pollution and encouraging walking, rolling, and bicycling. More people using transit has direct safety benefits (for example, fewer crashes and injuries), and more people walking, rolling, and biking can normalize interactions with drivers.
Our region is dynamic and resilient
Our transportation systems have historically relied too heavily on burning fossil fuels to move people and goods. New technologies and greater use of more efficient travel modes (for example, transit, walking, rolling, and biking) can reduce our contribution to climate change. Reducing transportation emissions is an important part of the global effort to mitigate climate change. Without collective action to reduce the severity of climate change, the region’s needs for climate adaptation and resilience will be larger and costlier.
We protect and restore natural systems
Our natural systems benefit from many of the actions we take to reduce our contribution to climate change. Benefits of these actions to natural systems can include fewer pollutants in water runoff from roads, less impervious surface areas devoted to transportation, and opportunities for land uses that absorb less new land for development.
We protect and restore natural systems
Our region is equitable and inclusive
Air quality is a primary concern for equity, with transportation pollution disproportionately impacting Black, Indigenous, and people of color and low-income populations. Our goal is to improve air and water quality for all creatures that breathe in our environment and rely on water for life.
Our communities are healthy and safe
Improvements to support natural systems — such as green stormwater infrastructure, plantings within the transportation right-of-way, and maintenance of tree canopy — can additionally benefit livability, reduce heat exposure, and provide access to green space.
We lead on addressing climate change
Actions that affect natural systems are inherently linked to the impacts of climate change. Actions that can mitigate the impacts of transportation on air quality have co-benefits of greenhouse gas mitigation.
Our region is dynamic and resilient
Stormwater and ice management strategies can have dual benefits in reducing waterway impacts described here and also advancing system reliability and resilience.
Investments
The investments in this plan can be described through the funding assumptions for revenues and spending, the investment plans and their associated content, and the major projects.
Funding
The plan is fiscally constrained, meaning that the plan identifies all transportation revenues that can reasonably be expected and are assumed to be available within the plan’s time frame, together with the proposed spending of those revenues. Recent actions taken by both the State of Minnesota and the federal government have increased the availability of and access to transportation revenues, presenting a significantly different financial outlook than anticipated in past plans. The region’s current financial outlook and plan offer a level of revenue availability, investment, and financial stability – particularly for transit, bicycle, and pedestrian investment – that was not available under past transportation finance plans.
In 2023, the Minnesota Legislature provided increases in traditional sources of regional transportation funding including the gas tax, vehicle registration tax, motor vehicle sales tax, and state general funds dedicated to transportation. They also included new transportation revenue sources, most notably a new regional sales tax for transit, active transportation (walking, biking, rolling), and county transportation. In addition, local governments received the proceeds from a new statewide delivery fee, along with dedicated taxes from the sales of auto repair parts for transportation investment purposes.
The 2021 federal Infrastructure Investment and Jobs Act (IIJA), also referred to as the Bipartisan Infrastructure Law (BIL), increased the traditional federal formula funding programs for highways and transit along with creating new competitive funding programs. Many of the new federal competitive programs address goals such as safety, community connectivity, climate change, resiliency, and multimodal investments that lacked specific funding programs under previous federal acts.
These new federal programs offer opportunities for increased transportation investment addressing these goals. The plan does not estimate or predict how much federal competitive funding the region will receive under these new programs but identifies them as significant opportunities for receiving additional funding. Increases to federal formula funding programs due to the IIJA are included in the plan revenue estimates.
The plan’s finance assumptions are structured around four categories:
- MnDOT metro state highway revenues and spending
- Regional transit revenues and spending
- Local government transportation revenues and spending
- Regionally allocated revenues
Additional opportunities for state and federal funding exist that are not assumed in the plan; they are described later. The share of these revenue sources across the Imagine 2050 planning horizon is shown in Figure 1.16. More details are available in Regional Transportation Finance.
Figure 1.16: Chart of Twin Cities transportation revenue by purpose, 2025-2050
![]()
MnDOT metro state highway revenues and spending
This funding category includes all revenues allocated to MnDOT’s metro district for capital and operating spending on the state highway system owned and operated by MnDOT in the metro area. The MnDOT metro district’s estimated state highway revenues are about $807 million in 2025 and almost $33 billion from 2025 to 2050. MnDOT’s primary sources of revenue for state highways are state highway user taxes and federal revenues designated from the Highway Trust Fund, which is funded primarily by federal fuel taxes.
MnDOT’s metro district uses metro state highway revenues to build, maintain, and operate the state highway system in the metropolitan region. MnDOT metro’s spending on these highways can also include some spending for transit, bicycle, and pedestrian improvements that happen within the highway corridor. MnDOT’s spending is broken into two broad categories: highway capital spending, and planning, operations, and maintenance spending. After accounting for debt service costs, MnDOT generally has determined to allocate its remaining available statewide revenues approximately 74% to highway capital spending and 26% to planning, operations, and maintenance spending. By 2028, MnDOT Metro District will have about $600 million available for state highway capital spending, growing to almost $1.4 billion annually by 2050. Around $24 billion in total metro highway capital funding is available from 2025 to 2050.
Regional transit revenues and spending
Regional transit revenues include all revenues used by regional transit providers – Metro Transit, Met Council contracted services, Metro Mobility, and the suburban transit providers – to operate, maintain, and build the region’s bus and transitway systems. The estimated total regional transit revenues are about $1.7 billion in 2025 and around $54 billion from 2025 to 2050. Transit receives revenues through a variety of sources, with over 50% of the funding provided through two major taxes – the new regional transportation sales and use tax and the state motor vehicles sales tax. Other sources include state general fund and bonds, passenger fares, federal funds (both formula and discretionary), county sales tax and regional rail authority property taxes, and regional transit capital property tax.
Regional transit spending is generally broken into operations and capital spending for both the regional bus and transitway systems. The regional transit spending from 2025 to 2050 is anticipated to be 65% on bus operations and capital, 16% on existing transitway operations and capital, and 15% on expansion transitway operations and capital. After accounting for those planned costs, about 4% of the total 2025-2050 revenues, or $2.3 billion, are remaining for opportunities for additional investment.
Local government transportation revenues and spending
Federal transportation planning regulations require the region’s long-range plan to account for all transportation revenues and spending expected in the region over the period of the plan. That includes federal revenues used by local units of government – counties, cities, townships – on local roads, bicycle, and pedestrian systems. The regional plan must also account for revenue and spending on regionally significant projects on the metropolitan highway system (such as projects that add capacity and interchange projects on minor and principal arterials). Local governments own and operate a variety of roadways including local streets collectors, minor arterials, and a very few principal arterials. Because the majority of local transportation spending does not involve federal funding or regionally significant projects, it generally is not covered in detail in the regional plan.
Local transportation revenues come from a variety of sources including county and city state-aid allocations from the state highway user tax revenues; federal revenues distributed through the Regional Solicitation and other competitive federal funding programs; county transportation sales tax; county wheelage tax revenues; or property taxes, special assessments, or fees allocated to transportation purposes by the local government. Beginning in 2024, local governments receive funds from a new Transportation Advancement Account created by the 2023 legislature. This account receives the proceeds from a phased-in dedication of the state sales tax on auto parts and a new state retail delivery fee. Metro area counties will also receive 17% of the new regional transportation sales and use tax. Local government transportation revenues will total more than $2 billion annually in 2025 and $80 billion 2025 to 2050.
Local government transportation spending is the largest area of transportation spending within the region, accounting for almost half of all regional transportation spending. Local transportation spending includes spending by the metro counties, cities, and townships. Local governments identify their investment goals and priorities in their local comprehensive plans and transportation plans, and they often vary greatly based on local context and need.
Local government transportation spending is somewhat unique in that it has typically been more flexible than other sources to cover a wide variety of transportation improvements, including roads, active transportation, and transit.
Local government transportation spending decisions are made at the local level, and spending and projects are identified through local comprehensive plans, capital improvement programs, and annual budgeting processes. Details on local government transportation spending are not included in this plan, though the regional goals, objectives, policies, and actions are meant to guide local transportation planning and decision making. Local projects are an important investment component to helping the region achieve its long-range goals and objectives.
Regionally allocated revenues
Under federal law, large metropolitan areas receive a share of the state’s federal formula funds for project selection through the designated metropolitan planning organization. The Met Council, in partnership with the Transportation Advisory Board, administers the project selection process for these funds. The project selection process for the region’s federal funds is known as the Regional Solicitation.
Including recent federal law changes, the regionally allocated revenues are made up of four primary sources: the Surface Transportation Block Grant program (including transportation alternatives); Congestion Mitigation and Air Quality improvement program; Carbon Reduction program; and the Promoting Resilient Operations for Transformative, Efficient, and Cost-saving Transportation (PROTECT) program. Together, these funds total about $125 million annually and $3.1 billion 2025 to 2050.
The recent state law changes also authorized that 5% of the new regional sales tax be provided to TAB for allocation to active transportation purposes. This allocation will provide about $25 million in 2025 and $910 million from 2025 to 2050, meaning there are about $4 billion in regionally allocated revenues available from 2025 to 2050.
The regionally allocated revenues have a spending structure that is largely determined by the Regional Solicitation. Over the past decade, the Met Council and TAB have distributed the available regional federal funds approximately 55.5% to roadway projects, 30% to transit and travel demand management projects, and 14.5% to bicycle and pedestrian projects. Any individual two-year solicitation distribution can vary from this based upon the funding priorities as determined by TAB. In recent years, “unique projects” that do not clearly align within the modal categories have also received $4 million every two years.
The Regional Solicitation typically awards funds three to four years in advance of the expected project construction to allow time for detailed project development after the funding award. Following the 2024 solicitation, the region’s federal funds will have been awarded through calendar year 2029. The funding assumptions in this plan for 2025 to 2029 include these awarded projects in the revenue assumptions for transit and local government revenues. State highways typically have not received federal funding awards. A portion of the new federal revenues available from the Carbon Reduction program, PROTECT program, and the regional transportation sales and use tax for active transportation from 2025 to 2029 have not yet been awarded. These funds along with the federal funds available after 2029 will be allocated in future solicitations.
The project selection process for future federal and regional active transportation funds will be determined by a Work Program item called the Regional Solicitation Evaluation. The Regional Solicitation evaluation will happen over two years (2024-2025) and will develop a new solicitation design to be in place for a 2026 Regional Solicitation. The intent of this evaluation is to assure that the structure and design is closely tied to and meant to achieve the goals and objectives identified in the regional plans, including the Imagine 2050 Transportation Policy Plan.
Other revenues
There are other opportunities for funding that are not directly addressed in the assumptions of this plan but may impact the region’s transportation spending.
- Discretionary state funding programs like Corridors of Commerce, bonding programs such as the local bridge improvement program, or specific project earmarks are often authorized every two years by the Legislature, but the funding amounts and projects are not known in advance. The metro area has historically received funding from these sources.
- Discretionary federal funding programs like Rebuilding American Infrastructure with Sustainability and Equity (RAISE) program and Safe Streets and Roads for All (SS4A) are awarded to projects through nationally competitive programs. Many of these federal discretionary programs directly address the goals and objectives of this plan and the metro area has a strong history of receiving grants through these types of competitive funding programs.
Investment plans
The Imagine 2050 Transportation Policy Plans uses investment plans to identify the investment approach that puts goals, objectives, policies, and actions into implementation for each type of transportation investment. These investment plans are included as separate documents, sometimes with additional supporting documents. Table 1.1 summarizes the investment discussions included in each plan.
| Investment Plan | Investment Discussions |
|---|---|
| Highway Investment Plan |
|
| Transit Investment Plan |
|
| Freight Investment Plan |
|
| Bicycle Investment Plan |
|
| Pedestrian Investment Plan |
|
| Travel Demand Management (TDM) Investment Plan |
|
The plan also includes an Aviation System Plan that is required under state law. The Aviation System Plan includes its own objectives, policies, and actions and serves a different role than the investment plans listed above.
Major projects
One of the purposes of the Imagine 2050 Transportation Policy Plan is to document capital projects that the region plans to invest in through the life of the plan (included as part of the fiscally constrained plan). Under federal law, this must include, at a minimum, projects that are deemed “regionally significant.” The Federal Highway Administration defines regionally significant projects as those that serve regional transportation needs that would normally be included in the modeling of a metropolitan area’s transportation network, including at a minimum all principal arterial highways and all fixed guideway transit facilities that offer an alternative to regional highway travel.
The Imagine 2050 Transportation Policy Plan defines regionally significant projects as follows.
For highways, regionally significant projects include the following project types on principal arterials:
- Adding or removing a lane (for example general-purpose lane, managed lane, an entirely new roadway, or continuous auxiliary lane that extends more than one interchange or intersection).
- Constructing a new interchange on an existing or developing freeway, adding or removing a new ramp movement at an existing interchange.
For transit projects, regionally significant projects include:
- Adding a new transitway including arterial bus rapid transit, highway bus rapid transit, dedicated bus rapid transit, light rail, commuter rail, or modern streetcar.
- Adding or removing one or more transitway stations, including extending existing transitways (does not include minor station relocations that are part normal planning and engineering).
- The addition of a permanent park-and-ride facility (not leased) with a capacity of 250 or more stalls.
Projects that do not meet these criteria will generally not be deemed regionally significant, but exceptions will be assessed on a case-by-case basis by an interagency consultation group. Bicycle, pedestrian, and travel demand management projects are generally not considered regionally significant. In addition, projects selected through the Regional Solicitation that are regionally significant are programmed directly into the four-year Transportation Improvement Program.
Highway projects
Table 1.2 represents all planned regionally significant highway projects in the region. Programmed projects are in the Transportation Improvement Program and non-regionally significant highway projects are mapped in the Highway Investment Plan. Each of these is fiscally constrained. The Highway Investment Plan shows additional projects that are part of a longer-term vision and not formally part of this fiscally constrained plan. This list only includes those projects that meet the definition of regionally significant and fall into mobility categories of interchanges, managed lanes, and targeted regional capacity. The projects can be seen on a map in Figure 1.17.
| Category | Route | Project Description | Estimated Cost70 | Timeframe |
|---|---|---|---|---|
| Interchange | US 169 at MN 282/Scott CSAH 9 | In Jordan, construct interchange, rehabilitate bridge. | $49,000,000 | 2025 |
| Targeted Regional Capacity | I-35W at Cliff Rd. | In Burnsville, northbound only, fill gap in fourth lane to connect upstream and downstream fourth lanes. | $80,000,000 | 2025 |
| Targeted Regional Capacity | I-394 at Louisiana Ave. | In St. Louis Park, eastbound only, fill gap in third general purpose lane to connect upstream and downstream third general purpose lanes. | $5,000,000 | 2025 |
| Interchange | I-35E at Ramsey/Anoka CR J | In Lino Lakes, add access to and from the north to complete access here. | $11,000,000 | 2025 |
| Interchange | MN 65 from 99th Ave. to 117th Ave. | In Blaine construct interchanges at 99th Ave., 105th Ave., 109th Ave., and 117th Ave. | $195,500,000 | 2026 |
| Interchange | MN 36 at Washington CSAH 17 (Lake Elmo Ave.) | In Grant and Lake Elmo construct an interchange. | $40,000,000 | 2026 |
| Interchanges, Managed Lanes | MN 252 from MN 610 to I-94 and I-94 from MN 252 to 4th St. N. | In Minneapolis, Brooklyn Center, and Brooklyn Park construct interchanges at 66th Ave. N., Hennepin CSAH 109 (85th Ave. N), and Brookdale Dr., improve safety and mobility on/across MN 252 and I-94. | To be determined | 2028 |
| Interchange | MN 610 at East River Rd. | In Coon Rapids add interchange access ramps. | $35,000,000 | 2027 |
| Interchange | MN 13 from W of Quentin Av to east of Nicollet Av | In Savage and Burnsville construct grade separation and reconstruction. | $140,408,000 | 2027 |
| Interchange | MN 65 at Anoka CSAH 116 (Bunker Lake Blvd) | In Ham Lake and Blaine construct an interchange. | $36,625,500 | 2028 |
| Interchange | Hennepin CR 81 at Bass Lake Rd. | In Crystal construct an interchange in coordination with Blue Line LRT extension. | To be determined | 2025-2035 |
| Interchange | MN 36 at MN 120 | In North St. Paul and Oakdale construct an interchange. | To be determined | 2029-2050 |
| Interchange | MN 5 at Hennepin CR 4 (Eden Prairie Rd.) | In Eden Prairie, construct an interchange. | To be determined | 2029-2050 |
| Interchange | MN 65 from 85th Ave. to 93rd Ave. | In Spring Lake Park and Blaine, construct two interchanges. | To be determined | 2029-2050 |
| Managed Lanes | I-494 from US 169 to east of MN 77/24th Av | In Bloomington and Richfield complete managed lanes addition. | $350,000,000 | 2026 |
| Managed Lanes | I-35W from Mississippi River to Ramsey County Rd C | In Minneapolis and Roseville add managed lanes. | To be determined | 2029-2050 |
Figure 1.17: Map of long-range regionally significant highway projects, 2025-2050

Transit Projects
The Metropolitan Council (including Metro Transit), local governments including cities and counties, and suburban transit providers worked together to develop the list of transit projects included in the fiscally constrained plan (Table 1.3). The list includes only those projects for which potential funding sources, transit mode, and route alignment are identified in the plan. The region will add transitway projects to this list through future plan updates and amendments as needed. For multi-year projects with expenditures prior to or across multiple time frames, this list includes the total estimated project cost, including already spent funds. Transitway projects may include park-and-ride investments that would otherwise be separately considered regionally significant, but no other new regionally significant park-and-ride projects are planned. The projects can be seen on a map in Figure 1.18.
| Category | Route | Project Description | Estimated Cost | Timeframe |
|---|---|---|---|---|
| Transitway System | METRO Green Line Extension | 15-mile light rail extension of the Green Line with plans to include 15 new stations between Minneapolis and Eden Prairie. | $2,860,000,000 | 2025-2035 |
| Transitway System | METRO Blue Line Extension | 13-mile light rail extension of the Blue Line with plans to include 11 new stations between Minneapolis and Brooklyn Park. | $1,539,900,00071 | 2025-2035 |
| Transitway System | METRO Gold Line | 10-mile dedicated bus rapid transit line with plans to include 21 new stations between Saint Paul and Woodbury. | $505,000,000 | 2025-2035 |
| Transitway System | METRO Purple Line | 10- to 12-mile dedicated bus rapid transit line with plans to include 12 new stations between Saint Paul and Maplewood. | $400,000,00071 | 2025-2035 |
| Transitway System | METRO B Line Arterial Bus Rapid Transit | 12-mile arterial bus rapid transit line with 33 planned stations between St. Louis Park and downtown Saint Paul. | $65,000,000 | 2025-2035 |
| Transitway System | METRO E Line Arterial Bus Rapid Transit | 9-mile arterial bus rapid transit line with 34 planned stations along University Ave./4th St., Hennepin Ave., and France Ave. between the University of Minnesota and Southdale. | $68,000,000 | 2025-2035 |
| Transitway System | METRO F Line Arterial Bus Rapid Transit | 15-mile arterial bus rapid transit line with 32 planned stations between downtown Minneapolis and Northtown Transit Center along Nicollet Mall, Central Avenue, 53rd Ave., and University Ave. | $98,000,000 | 2025-2035 |
| Transitway System | METRO G Line Arterial Bus Rapid Transit | 13-mile arterial bus rapid transit line with 32 planned stations between Little Canada and the Dakota County Northern Service Center through downtown Saint Paul to mainly along Rice Street and Robert Street. | $82,000,000 | 2025-2035 |
| Transitway System | METRO H Line Arterial Bus Rapid Transit | 16-mile arterial bus rapid transit line along the Como/Maryland corridor between downtown Minneapolis and Sun Ray Transit Center on the east side of Saint Paul. | $118,000,000 | 2025-2035 |
Figure 1.18: Map of long-range transit capital projects, 2025-2050
![]()
Plan Requirements
State-required transportation system plan
The Met Council is required by state law (Minn. Stat. 473.145-146) to prepare a comprehensive development guide for the seven-county metropolitan area, including Anoka, Carver, Dakota, Hennepin, Ramsey, Scott, and Washington counties. This Imagine 2050 Transportation Policy Plan fulfills state requirements for land and air transportation in that plan, as well as transportation-related state requirements to plan for climate change mitigation and adaptation (Minn. Stat. 216H.02).
Federally required metropolitan transportation plan
The Imagine 2050 Transportation Policy Plan fulfills federal requirements for a long-range metropolitan transportation plan (23 USC § 134 and 49 USC § 5303) for a region in air quality attainment. In addition to the seven-county metro region, this plan addresses federal requirements for areas of Wright and Sherburne counties identified by the U.S. Census as part of the Minneapolis-Saint Paul urban area. Figure 13 describes the Met Council’s transportation planning areas.
Figure 1.19: Met Council transportation planning areas
![]()
The preparation of this plan has been funded in part by the U.S. Department of Transportation, Federal Highway Administration, and Federal Transit Administration. The contents of this document reflect the views of the authors who are responsible for the facts or accuracy of the data presented herein. The contents do not necessarily reflect the official views or policies of the U.S. Department of Transportation. The report does not constitute a standard, specification, or regulation.
Federal planning factors
This plan was developed through a continuous, cooperative, and comprehensive planning process that addresses factors required by federal regulation (23 CFR § 450.306). Table 1.4 indicates the goal area generally associated with each planning factor, with the detail of work under these goal areas described in Policies and Actions.
| Planning Factor | Equitable & Inclusive | Healthy & Safe |
Dynamic & Resilient |
Climate Change | Natural Systems |
|---|---|---|---|---|---|
| Support the economic vitality of the metropolitan area, especially by enabling global competitiveness, productivity, and efficiency. | |||||
| Increase the safety of the transportation system for motorized and nonmotorized users. | |||||
| Increase the security of the transportation system for motorized and nonmotorized users. | |||||
| Increase accessibility and mobility of people and freight. | |||||
| Protect and enhance the environment, promote energy conservation, improve the quality of life, and promote consistency between transportation improvements and state and local planned growth and economic development patterns. | |||||
| Enhance the integration and connectivity of the transportation system, across and between modes, for people and freight. | |||||
| Promote efficient system management and operation. | |||||
| Emphasize the preservation of the existing transportation system. | |||||
| Improve the resiliency and reliability of the transportation system and reduce or mitigate stormwater impacts of surface transportation. | |||||
| Enhance travel and tourism. |
![]() Picture icons indicate primary,
Picture icons indicate primary, ![]() Picture icons indicate secondary, and
Picture icons indicate secondary, and ![]() Picture icons indicate limited or no connections to each planning factor.
Picture icons indicate limited or no connections to each planning factor.
1 Metropolitan Council. (2023). The Regional Forecast: Population and employment in the Twin Cities region in 2050, 2023 update. The-Regional-Forecast-Update-2023.aspx
2 Metropolitan Council. (2024). 2021 Travel behavior inventory household survey, 2024. https://metrocouncil.org/Transportation/Performance/Travel-Behavior-Inventory/Data.aspx
3 Metropolitan Council. (Accessed Jan. 31, 2024). 2023 Transportation system performance evaluation, fig. 8.3. https://metropolitan-council.github.io/tspe-quarto/
4 Andrew Owen, et al. (July 2023). Access across America: Auto 2021. University of Minnesota, Center for Transportation Studies. https://www.cts.umn.edu/publications/report/access-across-america-auto-2021
5 People for Bikes (2023). 2023’s best places to bike. https://www.peopleforbikes.org/news/2023s-best-places-to-bike
6 Metropolitan Council (2024). 2021 travel behavior inventory household survey. https://metrotransitmn.shinyapps.io/travel-survey-explorer/
7 Minnesota Pollution Control Agency (2022). Health impacts of air pollution. In Life and Breath: Metro. https://data.web.health.state.mn.us/web/mndata/life_and_breath
8 Metropolitan Council, Toole Design (2022). Regional safety action plan,” p. 25 https://metrocouncil.org/Transportation/System/Bicycle-and-Pedestrian/Studies/Regional-Pedestrian-Safety-Action-Plan/Regional-Pedestrian-Safety-Action-Plan.aspx; NHTSA Fatality Analysis Reporting System, 2014-2018 https://www.nhtsa.gov/research-data/fatality-analysis-reporting-system-fars; American Community Survey 2014-2018 5-year estimates. https://www.census.gov/programs-surveys/acs/technical-documentation/table-and-geography-changes/2018/5-year.html
9 Johnson, S. (March 21, 2024). U.S. life expectancy gains ground despite another overdose record. U.S. News and World Report. https://www.usnews.com/news/health-news/articles/2024-03-21/u-s-life-expectancy-gains-ground-despite-another-overdose-record
10 Minnesota Department of Transportation. (April 14, 2023). Strategic Highway Safety Program performance measures summary file.
11 Federal Highway Administration (January 2024). Zero deaths and safe system. https://safety.fhwa.dot.gov/zerodeaths/zero_deaths_vision.cfm
12 Federal Highway Administration (2021). Safe system approach brochure. https://safety.fhwa.dot.gov/zerodeaths/docs/FHWA_SafeSystem_Brochure_V9_508_200717.pdf
13 Xu, G. et al. (2022). Speed management is key to road safety. In Public Roads, 85(4) (Report no. FHWA-HRT-22-002). https://rosap.ntl.bts.gov/view/dot/67989
14 Collaborative Sciences Center for Road Safety (n.d.) What is a safe systems approach? University of North Carolina, Chapel Hill. https://www.roadsafety.unc.edu/home/prof-dev-focus-area/top10sspitfalls/
15 Collaborative Sciences Center for Road Safety. (n.d.) Top 10 safe system implementation pitfalls and suggestions for how to avoid them. University of North Carolina, Chapel Hill. https://www.roadsafety.unc.edu/home/prof-dev-focus-area/top10sspitfalls/
16 Ibid. https://www.roadsafety.unc.edu/home/prof-dev-focus-area/top10sspitfalls/
17 Freemark, Y. & Jenkins, W. (June 2022). In the US, could taxing heavy cars be a first step toward reducing pedestrian fatalities? Urban Institute. https://www.urban.org/urban-wire/us-could-taxing-heavy-cars-be-first-step-toward-reducing-pedestrian-fatalities
18 Insurance Institute for Highway Safety. (November 2023). Vehicles with higher, more vertical front ends pose greater risk to pedestrians. https://www.iihs.org/news/detail/vehicles-with-higher-more-vertical-front-ends-pose-greater-risk-to-pedestrians
19 Ederer, D. et al. (September 2023). The safe systems pyramid: A new framework for traffic safety. Transportation Research Interdisciplinary Perspectives. https://www.sciencedirect.com/science/article/pii/S2590198223001525
20 Vue, K. (March 2021). A surge of hate crimes has left many Asian Americans feeling vulnerable. A new Minnesota safety patrol aims to stop that fear in the streets.” Sahan Journal. https://sahanjournal.com/race/anti-asian-hate-minnesota-safety-patrol/
21 Institute on Metropolitan Opportunity. (2003). The Minnesota statewide racial profiling study. University of Minnesota Law School. https://scholarship.law.umn.edu/cgi/viewcontent.cgi?article=1113&context=imo_studies
22 U.S. Dept. of Justice Civil Rights Division and U.S. Attorney’s Office Dist. of Minnesota. Investigation of the City of Minneapolis and the Minneapolis Police Department. https://www.justice.gov/d9/2023-06/minneapolis_findings_report.pdf
23 Ross, K. (June 7, 2023). Reducing pretextual stops leads to more equitable traffic policing. Justice Innovation Lab. https://www.justiceinnovationlab.org/news-and-updates/ramsey-county-reports-on-traffic-stop-policy-2023-0607
24 Carson, J. R., et al. (July 2023). Neighborhood walkability, neighborhood social health, and self-selection among U.S. adults. Health & Place, Vol. 82. https://doi.org/10.1016/j.healthplace.2023.103036
25 Chatterjee, R. (Aug. 23, 2023). Why a stranger’s hello can do more than just brighten your day. National Public Radio: All Things Considered. https://www.npr.org/sections/goatsandsoda/2023/08/23/1193148718/why-a-strangers-hello-can-do-more-than-just-brighten-your-day
26 Schweninger, E. et al. (2021). Transportation: A community driver of health. American Public Health Association. https://www.apha.org/-/media/Files/PDF/pubs/Transportation_Health_Community_Driver.pdf
27 Wilder Foundation (November 2020). Transportation is a key component of equitable food access. Wilder Foundation. https://www.wilder.org/articles/transportation-key-component-equitable-food-access
28 Urban Institute (2021). Transportation access. Urban Institute. https://upward-mobility.urban.org/transportation-access
29 Minnesota Pollution Control Agency. (n.d.). Air quality and health. https://www.pca.state.mn.us/air-water-land-climate/air-quality-and-health
30 Patel, K. (July 9, 2023). Why tires – not tailpipes – are spewing more pollution from your cars. The Washington Post. https://www.washingtonpost.com/climate-environment/2023/07/09/tire-brake-tailpipes-emissions-pollution-cars/
31 Zipper, D. (July 2023). EVs are sending toxic tire particles into the water, soil, and air. The Atlantic. https://www.theatlantic.com/technology/archive/2023/07/electric-vehicles-tires-wearing-out-particulates/674750/
32 Baumgaertner, E. et al. (June 9, 2023). Noise could take years off your life. Here’s how. The New York Times. https://www.nytimes.com/interactive/2023/06/09/health/noise-exposure-health-impacts.html
33 Doan-Nguyen, R. (June 13, 2023). When wildfires make your air unhealthy. Harvard Magazine. https://www.harvardmagazine.com/2023/06/wildfire-air-pollution-public-health
34 City of St. Paul. (May 2024). Speed limits. https://www.stpaul.gov/departments/public-works/traffic-lighting/speed-limit
35 Owen, A. et al. (July 2023). Access across America: Auto 2021. University of Minnesota Center for Transportation Studies. https://www.cts.umn.edu/publications/report/access-across-america-auto-2021
36 Owen, A. et al. (July 2023). Access across America: Transit 2021. University of Minnesota Center for Transportation Studies. https://www.cts.umn.edu/publications/report/access-across-america-transit-2021
37 Owen, A. et al. (July 2023). Access across America: Biking 2021. University of Minnesota Center for Transportation Studies. https://www.cts.umn.edu/publications/report/access-across-america-biking-2021
38 Metropolitan Council. (n.d.). 2021 Transit on-board survey pilot results: Transit trends. https://metrocouncil.org/Transportation/Performance/Travel-Behavior-Inventory/Data/Onboard-Survey-pilot-results-2021.aspx
39 Metropolitan Council (accessed 2024). Community profile: 7-county region. https://stats.metc.state.mn.us/profile/detail.aspx?c=R11000
40 Metropolitan Council (2024). 2022 TBI on-board survey. Peak-hour commutes include trips taken to work from home between 6 a.m. and 9 a.m. and trips taken from work to home between 3 p.m. and 6:30 p.m.
41 People for Bikes (June 2023). 2023’s best places to bike. https://www.peopleforbikes.org/news/2023s-best-places-to-bike
42 National Association of City Transportation Officials. (December 2017). Designing for all ages & abilities: Contextual guidance for high-comfort bicycle facilities. https://nacto.org/wp-content/uploads/2017/12/NACTO_Designing-for-All-Ages-Abilities.pdf
43 Spack, M. et al. (January 2010). Travel demand management: An analysis of the effectiveness of TDM plans in reducing traffic and parking in the Minneapolis-St. Paul metropolitan area. Spack Consulting. https://trid.trb.org/View/1307149
44 Gopalakrishna, D. et al. (2012). Integrating demand management into the transportation planning process: A desk reference - Chapter 10. (Report No. FHWA-HOP-12-035). Federal Highway Administration. https://ops.fhwa.dot.gov/publications/fhwahop12035/chap10.htm
45 Wilson, A. & Crimmins, A.R. (Ed.) (2023). Midwest U.S. global change research program. https://doi.org/10.7930/NCA5.2023.CH24
46 Khatami, D. & Shafei, B. (2021). Impact of climate conditions on deteriorating reinforced concrete bridges in the US midwest region. Journal of Performance of Constructed Facilities, 35(1), 9-10. https://doi.org/10.1061/(ASCE)CF.1943-5509.0001528
47 Liban, C. & Crimmins, A.R. (Ed.) (2023). Transportation U.S. global change research program. https://doi.org/10.7930/NCA5.2023.CH13
48 Owen, A. et al. (July 2023). Access across America: Auto 2021. University of Minnesota Center for Transportation Studies. https://www.cts.umn.edu/publications/report/access-across-america-auto-2021
49 Metropolitan Council. (Accessed Jan. 21, 2024). 2023 Transportation system performance evaluation (fig. 8.3). https://metrocouncil.org/METC/media/TSPE/index.html
50 Minnesota Pollution Control Agency. (2023). Greenhouse gas emissions in Minnesota 2005-2020: Biennial report to the Legislature tracking the state’s contribution to emissions contributing to climate change. https://www.pca.state.mn.us/sites/default/files/lraq-2sy23.pdf
51 Minnesota Pollution Control Agency (July 2022). Greenhouse gas emissions data. https://public.tableau.com/app/profile/mpca.data.services/viz/GHGemissioninventory/GHGsummarystory
52 International Energy Agency (n.d.). Electric vehicles. https://www.iea.org/energy-system/transport/electric-vehicles
53 Rocky Mountain Institute (September 2023). EVs to surpass two-thirds of global car sales by 2030, putting at risk nearly half of oil demand, new research finds. https://rmi.org/press-release/evs-to-surpass-two-thirds-of-global-car-sales-by-2030-putting-at-risk-nearly-half-of-oil-demand-new-research-finds/
54 State of Minnesota Climate Change Subcabinet (n.d.). The next step in our clean energy transition. https://climate.state.mn.us/next-step-our-clean-energy-transition
55 U.S. Department of Energy. (Accessed September 2023). Alternative Fuels Data Center: Emissions from electric vehicles. https://afdc.energy.gov/vehicles/electric-emissions
56 Atlas Public Policy. (Accessed January 2024). EValuateMN dashboard. https://atlaspolicy.com/evaluatemn/
57 Associated Press (Oct. 13, 2023). Xcel Energy, Heartland Hydrogen Hub selected for up to $925 million federal award. CBS News. https://www.cbsnews.com/minnesota/news/xcel-energy-heartland-hydrogen-hub-selected-for-up-to-925-million-federal-award/
58 Currier, B. (August 2020). History of regulation of stormwater runoff from transportation. TR News, 5-8. https://www.trb.org/Main/Blurbs/181815.aspx
59 Minnesota Pollution Control Agency (July 20, 2022). What is stormwater and why does it need to be managed? In Minnesota Stormwater Manual. https://stormwater.pca.state.mn.us/index.php?title=What_is_stormwater_and_why_does_it_need_to_be_managed%3F
60 Metropolitan Council (November 2022). Water Quality Executive Summary. https://metrocouncil.org/Wastewater-Water/Planning/2050-Water-Policy-Plan/Research/Water-Quality/Water-Quality-Executive-Summary.aspx
61 Minnesota Pollution Control Agency (Nov. 23, 2022). Environmental impacts of road salt and other de-icing chemicals. In Minnesota Stormwater Manual. https://stormwater.pca.state.mn.us/index.php?title=Environmental_impacts_of_road_salt_and_other_de-icing_chemicals
62 Minnesota Pollution Control Agency (Oct. 20, 2020). Statewide chloride management plan. https://www.pca.state.mn.us/sites/default/files/wq-s1-94a.pdf
63 Minnesota Pollution Control Agency (Feb. 20, 2023). Street sweeping for trees. In Minnesota Stormwater Manual. https://stormwater.pca.state.mn.us/index.php?title=Street_sweeping_for_trees
64 Huijser, M.P. et al. (August 2008). Executive summary in wildlife-vehicle collision reduction study: Report to Congress (Report no. FHWA-HRT-08-034). Montana State University Western Transportation Institute. https://www.fhwa.dot.gov/publications/research/safety/08034/exec.cfm
65 Note: Estimated costs are provided for general context and come from a variety of sources including MnDOT, the region’s Transportation Improvement Program and sponsor agencies.
66 Project costs for the METRO Blue Line Extension and METRO Purple Line represent figures for the adopted locally preferred alternative in the plan, but it is anticipated that these figures will be updated in 2025 through plan amendments in development at the time of the plan’s adoption.
67 Metropolitan Council (2024). 2021 Travel Behavior Inventory household survey. https://metrocouncil.org/Transportation/Performance/Travel-Behavior-Inventory/Data.aspx
68 2019 Quetica Freight Intelligence Tracker data provided by MnDOT.
Transportation Policy Plan Overview Contacts
Amy Vennewitz
Deputy Director, Planning & Finance, Metropolitan Transportation Services
[email protected]
Cole Hiniker
Senior Manager, Multimodal Planning, Metropolitan Transportation Services
[email protected]
