Appendix G – Community and regional water demand projections
A key part of planning for regional water supply is knowing how much water has been used in the past, how much is being used now, and how much will be needed in the future. The Met Council has developed a method to project water demand for communities in the Twin Cities metropolitan area for the years 2030, 2040, and 2050. This method includes projections for both municipal community public water supply systems and for privately owned high-capacity wells.
The approach is explained below along with Version 1 of the results for the municipal community public water supply systems (Tables 6.6, 6.7, 6.8). Currently, the results show water demand projections for every municipal community public water supply system in the metro region. Work is underway to project water demand for privately owned high-capacity wells, which are permitted by the Minnesota Department of Natural Resources (DNR) and pump more than 10,000 gallons per day on average or more than one million gallons of groundwater per year.
How water use projections support regional and local water supply planning
The Met Council has projected water use for the updated Metro Area Water Supply Plan. This information helps water supply planners get a sense of how much and where water will be used in the future. These projections also help provide data for technical studies, like regional groundwater models and other water supply analyses, to predict potential resource limits and evaluate different approaches for future water management.
Future water use was estimated for the years 2030, 2040, and 2050. By projecting water demand for these years, water supply planning aligns with the broader regional development guide, Imagine 2050, which includes population forecasts for 2030, 2040, and 2050.
The water demand projections are intended to:
- Assist Met Council planners and policy makers, state agencies, and community planners to plan for future growth and address regional issues. These projections can help us understand where future water demand might bump up against or exceed capacity, or where there is sufficient capacity to support growth.
- Provide subregional and regional water demand data for Met Council’s groundwater modeling projects, surface water analyses, and other studies.
- Provide guidance for communities as they develop content for the water supply section of their comprehensive plan to project water utility revenue, plan for water infrastructure improvements, and request DNR appropriation permit amendments as needed to serve growth.
Overview of the projection method
The total water use in the metro region is the sum of water pumped by each municipal community water supply system from groundwater and surface water sources, plus the water pumped by privately owned, high-capacity wells. This is calculated using the following equation:
Total Metro Region Water Use = Projected municipal community public water system use + projected privately owned high-capacity well use
The projection method uses historical water use data from the DNR and the Minnesota Department of Health (MDH), along with population forecasts developed by the Met Council.
These water demand projections for 2030, 2040, and 2050 help link regional water supply planning to the broader regional development framework, Imagine 2050, by using the same population forecasts for those years.
Method for projecting a range of water use
Simplifying assumptions
The approach does not include estimates for low-capacity, privately owned wells that use less than 10,000 gallons per day and less than one million gallons per year. This is because they make up less than five percent of the total water use in the region and the majority of this water is returned to the local groundwater system through individual subsurface sewage treatment systems.
The approach assumes that water-use patterns from 2013 and 2022 in the metro region are representative of how water will continue to be used in the future. For example, this approach assumes that the average amount of water used per person per day from 2013 to 2022 will stay the same in 2030, 2040, and 2050.
This approach further assumes the growth rate for water use by privately owned high-capacity wells, which have water appropriation permits from and report annual water use to the DNR, will follow the average annual growth rate that occurred from 2013-2022.
Lastly, this approach assumes that future population served by each community’s municipal community public water system can be calculated by adding Met Council’s projected population increases for 2030, 2040, and 2050 to the MDH’s 2020 water service population data.
Analysis of historical data as input to projections
Historical municipal community public water supply system total use per person per day
The Met Council calculated the total water use per person per day for each year from 2013 to 2022 for municipal community public water supply systems. This was done by dividing the total annual water use for each year by the population served in that year, and then dividing that result by 365 days.
Input data:
- Total annual water use data for municipal community water supply systems was obtained from the DNR Permitting and Reporting System (MPARS). Annual water use data between 2013 and 2022 was downloaded from the DNR Minnesota Water Use data website. Total annual municipal community public water supply system water use is the sum of the year’s residential, commercial, governmental, institutional, and unaccounted for water, as reported by the municipal community public water supply system to the DNR.
- The population served by the municipal community public water supply for each community was obtained from Local Water Supply Plans submitted by communities to the DNR for years that data was available (generally through 2018) and from the MDH’s Minnesota Public Health Data Access Drinking Water Quality dataset where data was not available in Local Water Supply Plans and for years 2019-2022.
Results for each municipal community water supply system are reported in Tables 6.6, 6.7, 6.8 and were used to calculate the regional average total water use per person per day (Table 6.5 and Figure 6.1). The 2013-2022 regional average was 100.81 gallons per person per day.
While the average total water use per person per day was 100.81 during this period, it is important to recognize that water use varied significantly from year to year between 2013 and 2022 due to factors such as development, wet versus dry years, changes in water efficiency, and other variable factors affecting water use.
Met Council recommends that regional water use results should be reported with a minimum variable range of plus or minus 10% to reflect uncertainty due to regionwide shifts in population and industrial changes, changes in water efficiency, extreme weather patterns (wet and dry), and other variable conditions that could affect water demand (Figure 6.1).
| Year | Total Use (Gallons/Person/Day) |
|---|---|
| 2013 | 111.03 |
| 2014 | 103.55 |
| 2015 | 100.34 |
| 2016 | 99.27 |
| 2017 | 98.53 |
| 2018 | 99.22 |
| 2019 | 91.90 |
| 2020 | 97.34 |
| 2021 | 104.36 |
| 2022 | 102.58 |
| Range | 91.90-111.03 |
| Average (2013-2022) | 100.81 |
| % Above Average | 10.13 |
| % Below Average | -8.84 |
Figure 6.1: Average annual municipal water use
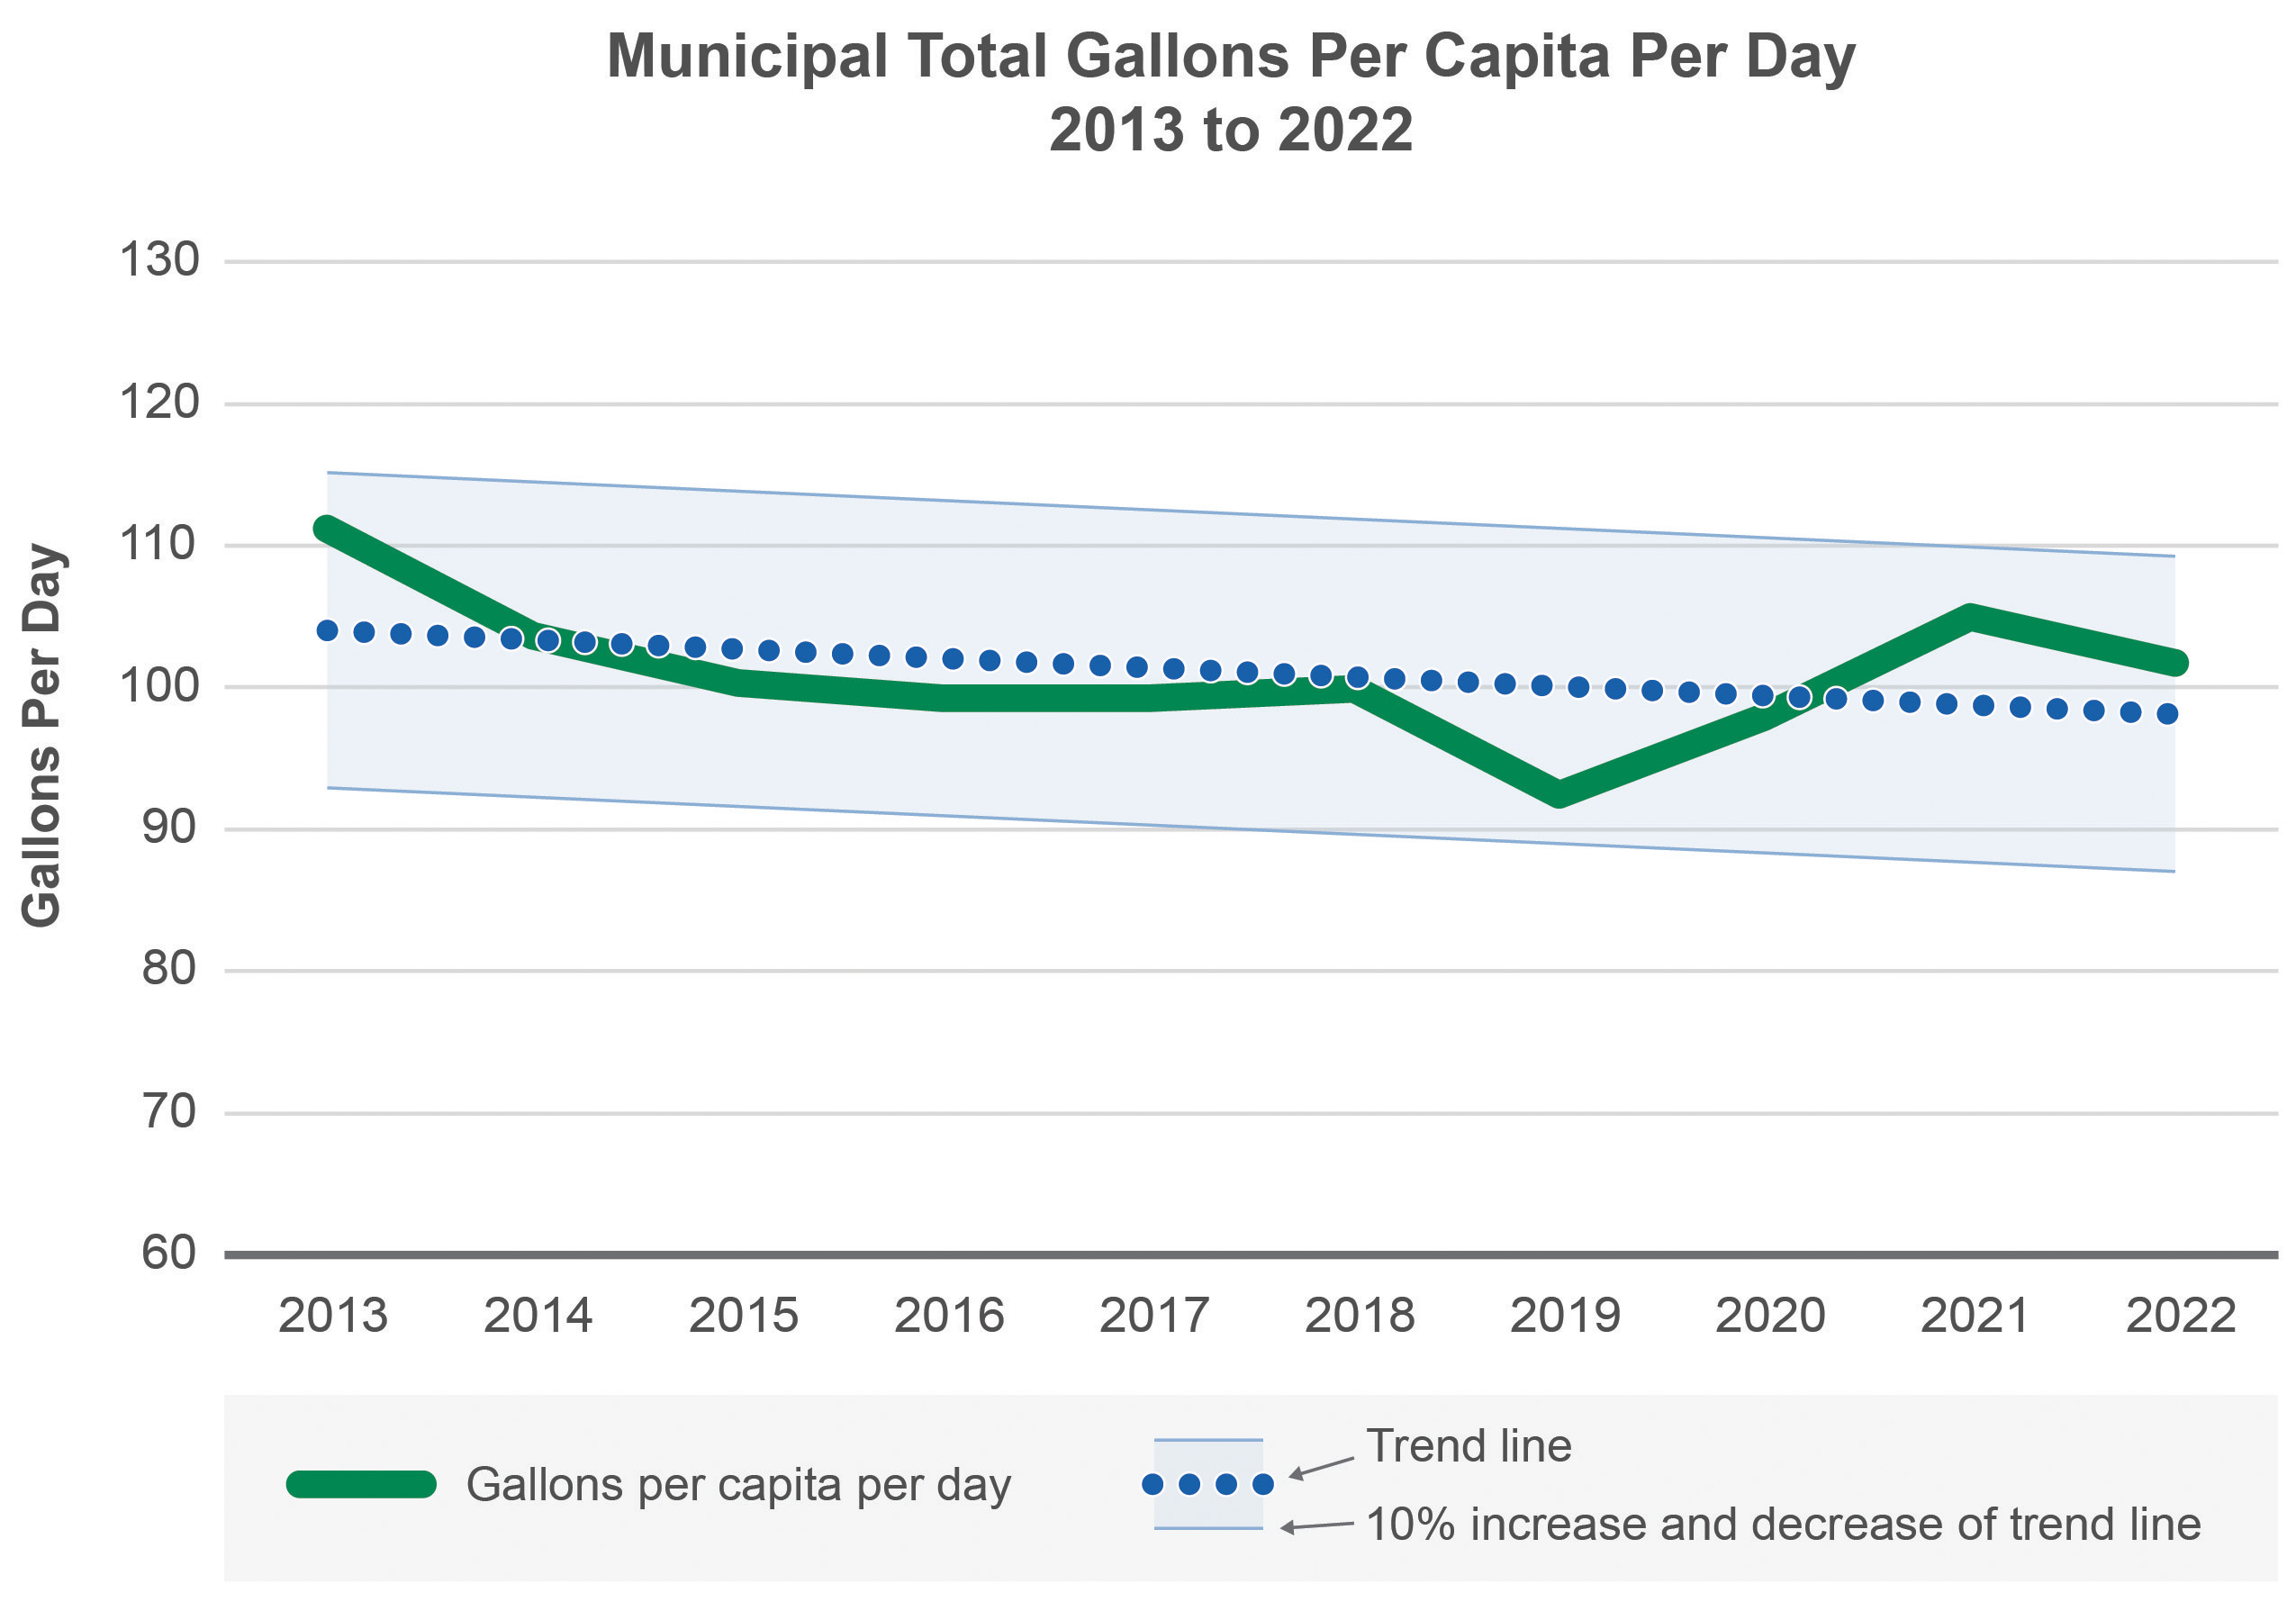
Data are per person per day across the entire metro region for municipal community public water supply systems for the years 2013-2022 (blue line). The annual average total gallons per person per day ranged by approximately plus and minus 10% below the trend line (dotted blue line). Data sources: Minnesota DNR’s MPARS, MDH, and community local water supply plans
Historical privately owned, high-capacity well use
Privately owned, high-capacity well use is being calculated by Met Council for each community in the metro region for each year from 2013 to 2022.
Input data:
- Annual water use data for privately owned, high-capacity wells is being obtained from the Minnesota Department of Natural Resources (DNR) Permitting and Reporting System (MPARS). Annual water use data between 2013 and 2022 was downloaded from the DNR Minnesota Water Use data website.
Met Council will calculate the average annual increase in pumping observed for each water use category for the privately owned, high-capacity well use for each community from 2013 to 2022. Results for privately owned, high-capacity well use will be reported for each community in the metro region and used to project future water use for 2030, 2040, and 2050.
Projecting privately owned, high-capacity well use
Water pumped volumes from private high-capacity wells, which produce more than 10,000 gallons per day or more than one million gallons per year, are also being projected for the metro region for 2030, 2040, and 2050. The estimated amount of future water use for privately owned, high-capacity wells will be calculated for each water use category for each community for 2030, 2040, and 2050 using the following equation:
Projected privately owned, high-capacity wells water pumped = [current total annual high-capacity wells pumped volume] X [2013-2022 average annual increase percentage in water pumped volume] with a variable range
Input data:
- Current total annual high-capacity wells pumped volume is available through the DNR Permitting and Reporting System (MPARS) because these wells require a permit from the MN DNR, and their annual pumping is reported in MPARS. Annual water use data between 2013 and 2022 was downloaded from the DNR Minnesota Water Use data website.
- 2013-2022 average annual increase percentage in water pumped volume, to be determined
The Met Council recommends using a variable range of +/-10 to 20% for estimating water pumped from privately owned, high-capacity wells. This approach helps in planning that can adapt to changes such as in industrial development, changes in water efficiency, extreme weather, and other factors that could impact future water use.
Projecting population served
Population served by each municipal community public water supply system was calculated by adding Met Council’s forecasted increase in total population from 2020 to 2030, 2020 to 2040, and 2020 to 2050 to the 2020 population served reported by MDH.
Input data:
- The forecasted increase in population was obtained from Met Council preliminary forecasts for 2030, 2040, and 2050 (published in the spring of 2024).
- The population served by the municipal community public water supply for each community in 2020 was obtained from MDH’s Minnesota Public Health Data Access Drinking Water Quality dataset.
Projected 2030, 2040, and 2050 population served by each municipal community public water supply system are reported in Tables 6.6, 6.7, 6.8.
Projecting municipal community public water supply system use
The estimated amount of future water use for each municipal community public water supply system in the metro region was calculated for 2030, 2040, and 2050 using the following equation:
Projected municipal community public water supply system water use for YEAR = [projected population served for YEAR] X [2013-2022 average municipal community public water supply system total water use per person per day] X 365 days
Input data:
- Projected population served, reported in Tables 6.6, 6.7, 6.8
- 2013-2022 average total water use per person per day, reported in Tables 6.6, 6.7, 6.8
Projected 2030, 2040, and 2050 municipal community public water supply system total use is reported in Tables 6.6, 6.7, 6.8.
The Met Council recommends that individual communities should consider using a variable range of +/-20% for projecting water use when planning for improvements to water system infrastructure and adjusting water utility billing rates. This accounts for potential increases in population and industrial growth beyond projections, changes in water efficiency, varying weather patterns (both wet and dry), and other factors that could affect future water demands. This recommendation is supported by the fact that several communities in the metro region experienced fluctuations in water demand that were closer to +/-20% rather than just the +/-10% that was experienced for the metro region as a whole from 2013 to 2022. These fluctuations were mainly due to significant changes in industrial water use and unexpected rapid growth in residential areas.
Projecting future total water use in the metro region
The projected total amount of water use in the seven-county Twin Cities metropolitan area will be calculated for 2030, 2040, and 2050 by adding together the projected future water use for each community’s municipal community public water supply systems and privately owned, high-capacity wells.
Total estimated water use for the metro region will be calculated using the following basic equation:
Total metro region water use = projected municipal community public water system use + projected privately owned high-capacity well use
Conclusions
The Twin Cities metropolitan area is estimated to need 283 to 346 million gallons per day (MGD) in 2030, 301 to 367 MDG by 2040, and 323 to 395 MGD by 2050 for municipal community public water supply systems and privately owned, high-capacity wells (Figure 6.2). The reported range reflects uncertainty due to regionwide shifts in population and industrial changes, changes in water efficiency, extreme weather patterns (wet and dry), and other variable conditions that could affect water demand.
Figure 6.2: Projected water demand
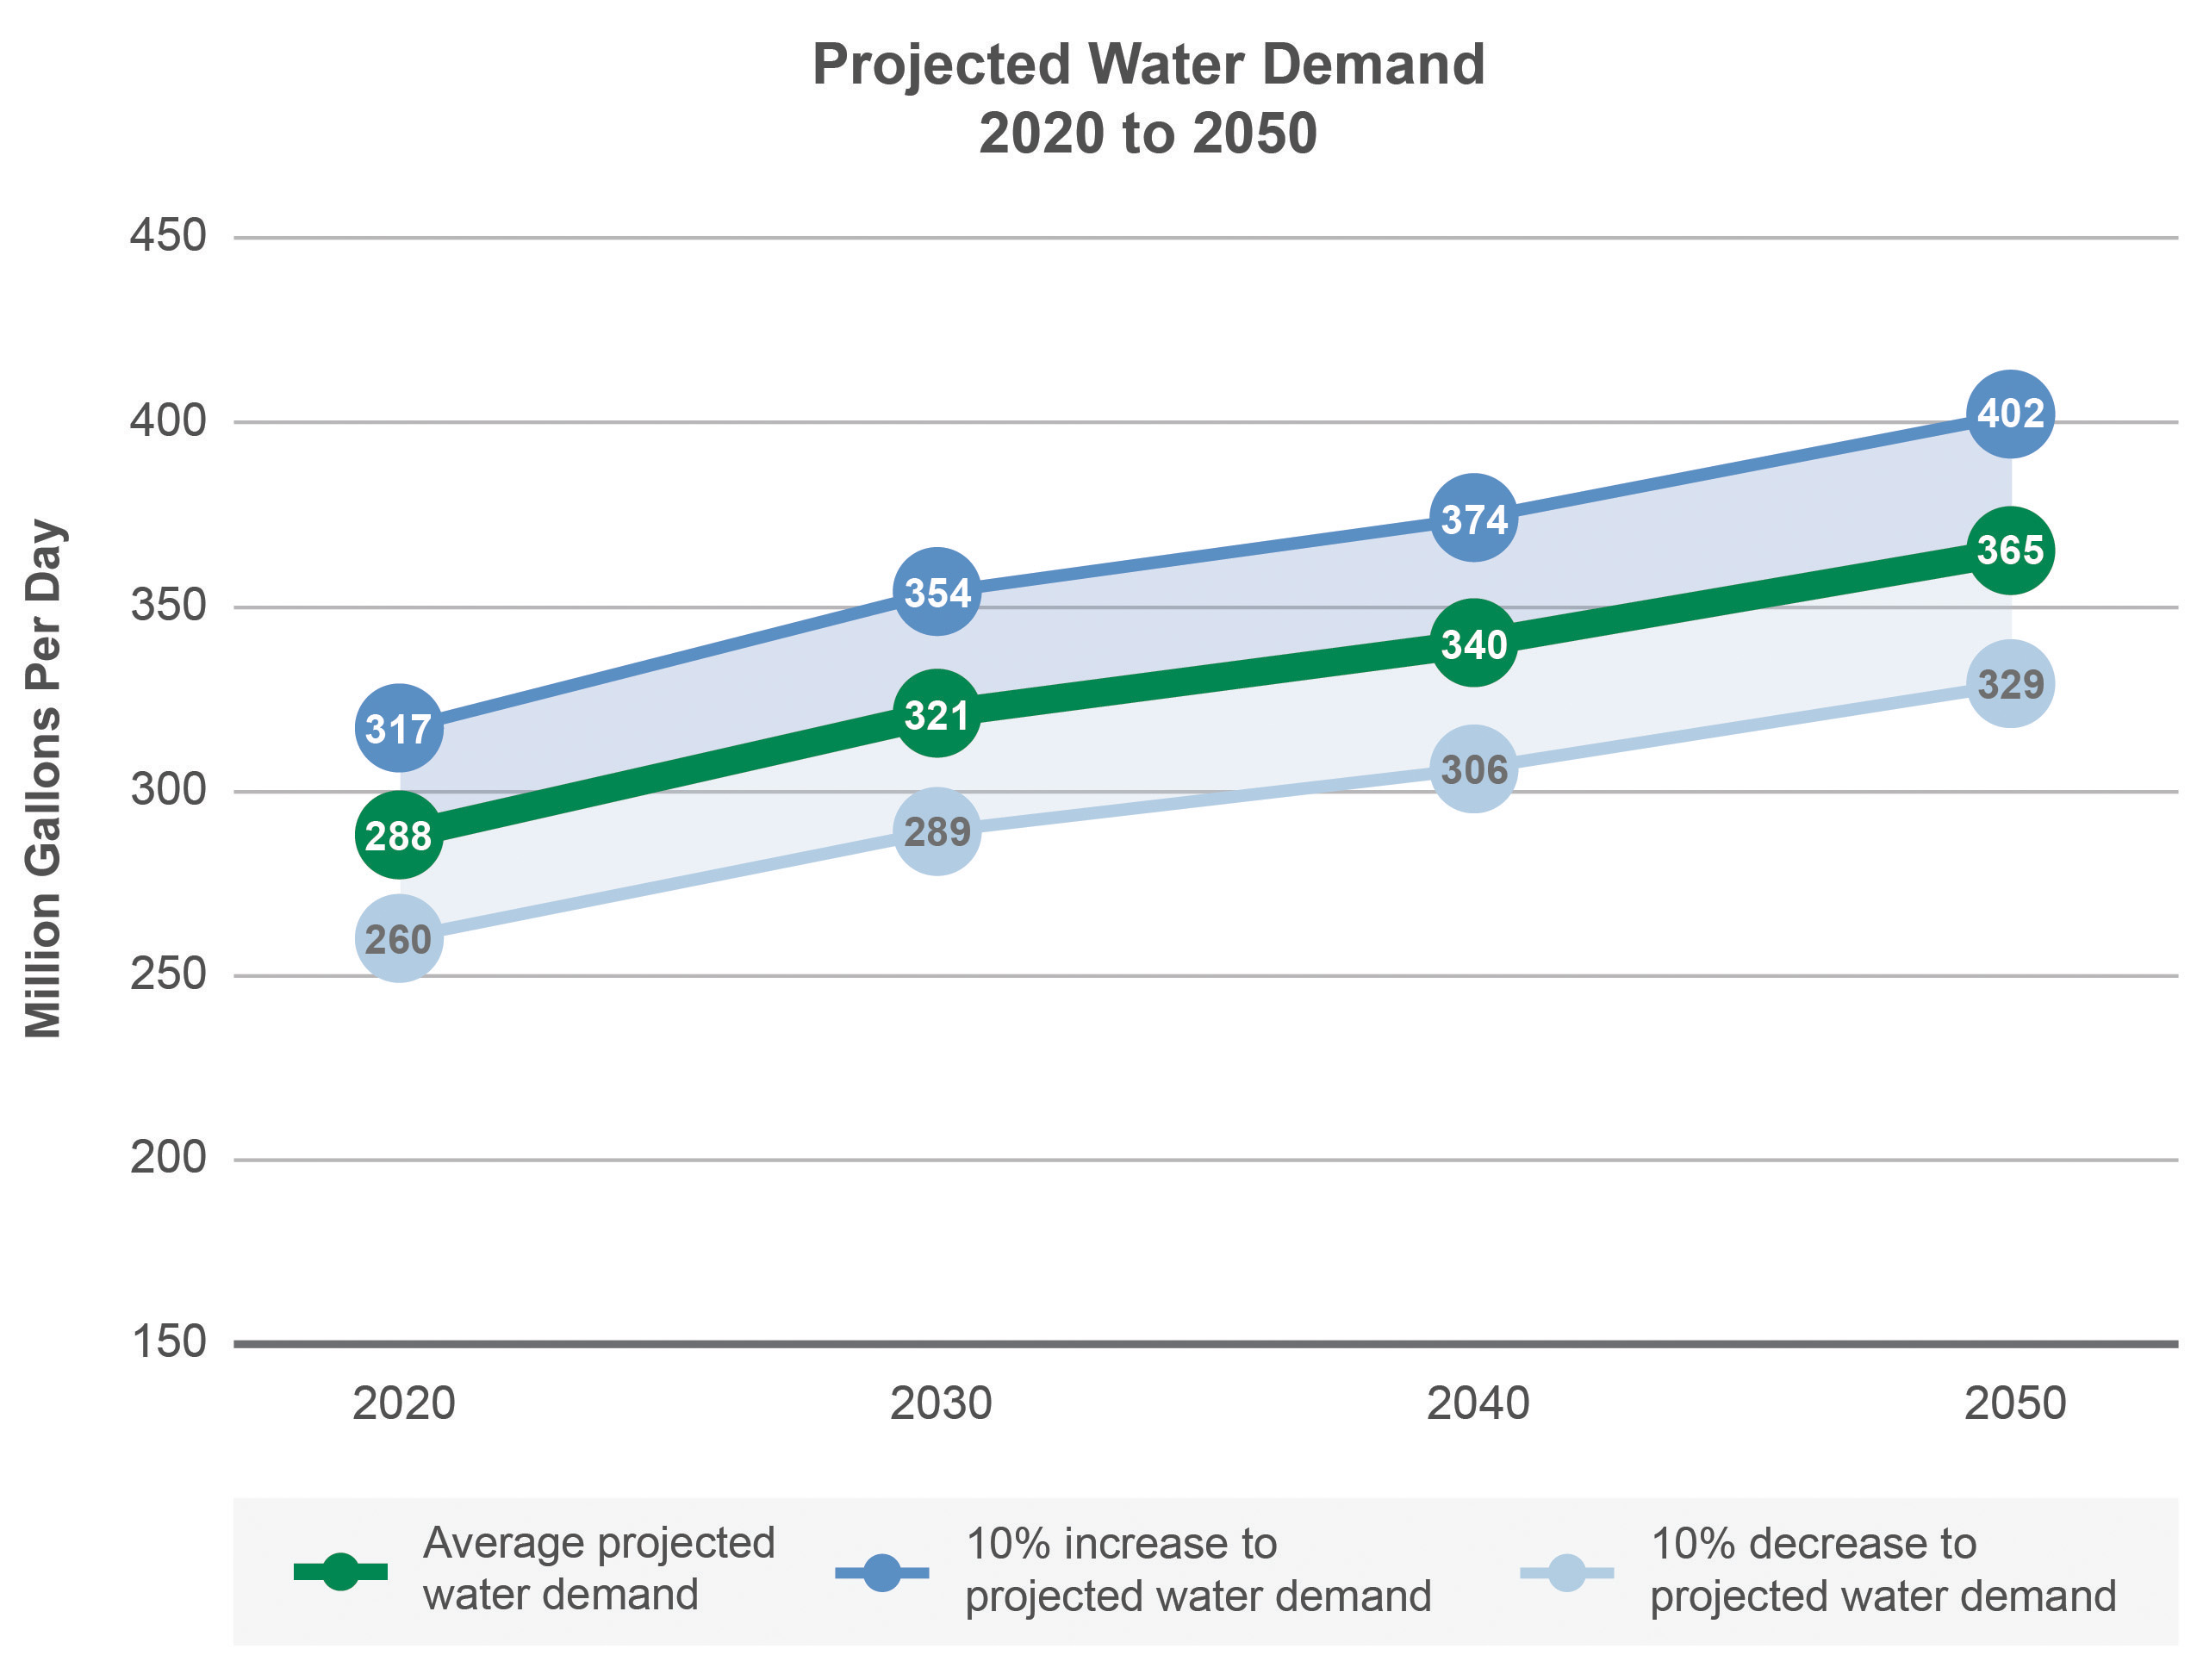
Projected water demand by municipal community public water supply systems from a baseline in 2020 to 2030, 2040, and 2050. A range of +/-10% is recommended to reflect uncertainty due to region-wide shifts in population and industrial changes, changes in water efficiency, extreme weather patterns (wet and dry), and other variable conditions that could affect water demand. Data source: Met Council
The estimated amount of future water use for each municipal community public water supply system in the metro region was calculated for 2030, 2040, and 2050 as reported in Tables 6.6, 6.7, 6.8 to support local water supply planning efforts. The Met Council recommends that individual communities should consider using a variable range of +/-20% for projecting water use, and these values are also included in Tables 6.6, 6.7, 6.8.
These water demand projections are intended to:
- Help community planners and Met Council planners, policymakers, and state agencies prepare for future growth and tackle regional issues.
- Guide communities in developing the water supply section of their comprehensive plans, estimating water utility revenue, planning for water infrastructure improvements, and requesting DNR appropriation permit amendments to support growth.
- Provide water demand data for Met Council’s groundwater modeling projects, surface water analyses, and other studies.
| Community | 2013‐2022 Average Total Water Use (Gallons/ Peron/ Day) | 2030 Projected Population Served | 2030 Projected Average Daily Water Use (Million Gallons/Day) | ‐10% | +10% | ‐20% | +20% |
|---|---|---|---|---|---|---|---|
| Andover | 127.19 | 23,711 | 3.016 | 2.714 | 3.317 | 2.413 | 3.619 |
| Anoka | 123.50 | 21,732 | 2.684 | 2.416 | 2.952 | 2.147 | 3.221 |
| Apple Valley | 112.12 | 56,040 | 6.283 | 5.655 | 6.912 | 5.027 | 7.540 |
| Bayport | 114.64 | 2,559 | 0.293 | 0.264 | 0.323 | 0.235 | 0.352 |
| Belle Plaine | 91.59 | 8,630 | 0.790 | 0.711 | 0.869 | 0.632 | 0.948 |
| Bloomington | 103.69 | 72,247 | 7.491 | 6.742 | 8.240 | 5.993 | 8.990 |
| Brooklyn Center | 94.46 | 30,241 | 2.857 | 2.571 | 3.142 | 2.285 | 3.428 |
| Brooklyn Park | 103.91 | 84,112 | 8.740 | 7.866 | 9.614 | 6.992 | 10.488 |
| Burnsville | 141.30 | 66,605 | 9.411 | 8.470 | 10.353 | 7.529 | 11.294 |
| Carver | 86.82 | 5,951 | 0.517 | 0.465 | 0.568 | 0.413 | 0.620 |
| Centerville | 70.78 | 4,434 | 0.314 | 0.282 | 0.345 | 0.251 | 0.377 |
| Champlin | 98.34 | 24,451 | 2.405 | 2.164 | 2.645 | 1.924 | 2.885 |
| Chanhassen | 107.44 | 28,231 | 3.033 | 2.730 | 3.336 | 2.426 | 3.640 |
| Chaska | 112.47 | 28,544 | 3.210 | 2.889 | 3.531 | 2.568 | 3.852 |
| Circle Pines | 80.63 | 5,140 | 0.414 | 0.373 | 0.456 | 0.332 | 0.497 |
| Cologne | 77.51 | 2,231 | 0.173 | 0.156 | 0.190 | 0.138 | 0.208 |
| Columbus | 100.00 | 632 | 0.055 | 0.050 | 0.061 | 0.044 | 0.066 |
| Coon Rapids | 106.60 | 66,049 | 7.041 | 6.336 | 7.745 | 5.632 | 8.449 |
| Cottage Grove | 93.91 | 40,070 | 3.763 | 3.387 | 4.139 | 3.010 | 4.515 |
| Dayton | 61.15 | 7,485 | 0.458 | 0.412 | 0.503 | 0.366 | 0.549 |
| Eagan | 118.21 | 74,798 | 8.842 | 7.958 | 9.726 | 7.073 | 10.610 |
| Eden Prairie | 113.13 | 69,010 | 7.807 | 7.027 | 8.588 | 6.246 | 9.369 |
| Edina | 119.60 | 61,853 | 7.398 | 6.658 | 8.138 | 5.918 | 8.877 |
| Elko New Market | 63.09 | 5,843 | 0.369 | 0.332 | 0.406 | 0.295 | 0.442 |
| Empire Township | 99.28 | 2,691 | 0.267 | 0.240 | 0.294 | 0.214 | 0.321 |
| Excelsior | 122.88 | 2,075 | 0.255 | 0.229 | 0.280 | 0.204 | 0.306 |
| Farmington | 85.19 | 23,726 | 2.021 | 1.819 | 2.223 | 1.617 | 2.425 |
| Forest Lake | 111.09 | 14,497 | 1.611 | 1.449 | 1.772 | 1.288 | 1.933 |
| Fridley | 94.21 | 29,661 | 2.794 | 2.515 | 3.074 | 2.236 | 3.353 |
| Greenfield | 121.04 | 668 | 0.081 | 0.073 | 0.089 | 0.065 | 0.097 |
| Hamburg | 58.44 | 587 | 0.034 | 0.031 | 0.038 | 0.027 | 0.041 |
| Hampton | 66.06 | 706 | 0.047 | 0.042 | 0.051 | 0.037 | 0.056 |
| Hastings | 102.93 | 25,905 | 2.666 | 2.400 | 2.933 | 2.133 | 3.200 |
| Hopkins | 108.23 | 21,442 | 2.321 | 2.089 | 2.553 | 1.857 | 2.785 |
| Hugo | 84.72 | 14,764 | 1.251 | 1.126 | 1.376 | 1.001 | 1.501 |
| Inver Grove Heights | 79.74 | 39,620 | 3.159 | 2.843 | 3.475 | 2.527 | 3.791 |
| Jordan | 86.84 | 6,824 | 0.593 | 0.533 | 0.652 | 0.474 | 0.711 |
| Lake Elmo | 98.70 | 10,296 | 1.016 | 0.915 | 1.118 | 0.813 | 1.219 |
| Lakeland | 65.29 | 3,257 | 0.213 | 0.191 | 0.234 | 0.170 | 0.255 |
| Lakeville | 102.59 | 69,909 | 7.172 | 6.455 | 7.889 | 5.738 | 8.607 |
| Lexington | 88.99 | 2,551 | 0.227 | 0.204 | 0.250 | 0.182 | 0.272 |
| Lino Lakes | 87.00 | 21,043 | 1.831 | 1.648 | 2.014 | 1.465 | 2.197 |
| Long Lake | 103.62 | 1,900 | 0.197 | 0.177 | 0.217 | 0.157 | 0.236 |
| Loretto | 81.24 | 728 | 0.059 | 0.053 | 0.065 | 0.047 | 0.071 |
| Mahtomedi | 83.44 | 7,282 | 0.608 | 0.547 | 0.668 | 0.486 | 0.729 |
| Maple Grove | 114.38 | 85,679 | 9.800 | 8.820 | 10.780 | 7.840 | 11.760 |
| Maple Plain | 88.93 | 2,368 | 0.211 | 0.190 | 0.232 | 0.168 | 0.253 |
| Marine on St. Croix | 69.93 | 149 | 0.010 | 0.009 | 0.011 | 0.008 | 0.013 |
| Mayer | 83.84 | 2,203 | 0.185 | 0.166 | 0.203 | 0.148 | 0.222 |
| Medina | 121.21 | 5,230 | 0.634 | 0.571 | 0.697 | 0.507 | 0.761 |
| Minneapolis | 101.93 | 594,630 | 60.611 | 54.550 | 66.672 | 48.489 | 72.733 |
| Minnetonka Beach | 148.99 | 435 | 0.065 | 0.058 | 0.071 | 0.052 | 0.078 |
| Minnetonka | 113.58 | 61,175 | 6.948 | 6.253 | 7.643 | 5.559 | 8.338 |
| Minnetrista | 120.29 | 5,363 | 0.645 | 0.581 | 0.710 | 0.516 | 0.774 |
| Mound | 64.46 | 9,181 | 0.592 | 0.533 | 0.651 | 0.473 | 0.710 |
| Mounds View | 93.39 | 12,971 | 1.211 | 1.090 | 1.332 | 0.969 | 1.454 |
| New Brighton | 104.80 | 22,987 | 2.409 | 2.168 | 2.650 | 1.927 | 2.891 |
| New Germany | 59.47 | 548 | 0.033 | 0.029 | 0.036 | 0.026 | 0.039 |
| New Prague | 88.26 | 8,912 | 0.787 | 0.708 | 0.865 | 0.629 | 0.944 |
| New Trier | 72.77 | 149 | 0.011 | 0.010 | 0.012 | 0.009 | 0.013 |
| Newport | 82.97 | 4,767 | 0.396 | 0.356 | 0.435 | 0.316 | 0.475 |
| North St. Paul | 74.17 | 12,134 | 0.900 | 0.810 | 0.990 | 0.720 | 1.080 |
| Norwood Young America | 67.86 | 4,405 | 0.299 | 0.269 | 0.329 | 0.239 | 0.359 |
| Oak Grove | 83.36 | 118 | 0.010 | 0.009 | 0.011 | 0.008 | 0.012 |
| Oak Park Heights | 127.23 | 4,678 | 0.595 | 0.536 | 0.655 | 0.476 | 0.714 |
| Oakdale | 84.75 | 29,618 | 2.510 | 2.259 | 2.761 | 2.008 | 3.012 |
| Orono | 89.98 | 4,424 | 0.398 | 0.358 | 0.438 | 0.318 | 0.478 |
| Prior Lake | 68.30 | 29,667 | 2.026 | 1.824 | 2.229 | 1.621 | 2.432 |
| Plymouth | 105.43 | 79,030 | 8.332 | 7.499 | 9.165 | 6.665 | 9.998 |
| Prior Lake | 68.30 | 29,667 | 2.026 | 1.824 | 2.229 | 1.621 | 2.432 |
| Ramsey | 131.70 | 18,501 | 2.437 | 2.193 | 2.680 | 1.949 | 2.924 |
| Randolph | 167.42 | 443 | 0.074 | 0.067 | 0.082 | 0.059 | 0.089 |
| Richfield | 76.13 | 38,110 | 2.901 | 2.611 | 3.192 | 2.321 | 3.482 |
| Robbinsdale | 78.92 | 15,251 | 1.204 | 1.083 | 1.324 | 0.963 | 1.444 |
| Rockford | 80.55 | 4,484 | 0.361 | 0.325 | 0.397 | 0.289 | 0.433 |
| Rogers | 134.88 | 14,307 | 1.930 | 1.737 | 2.123 | 1.544 | 2.316 |
| Rosemount | 101.37 | 36,472 | 3.697 | 3.328 | 4.067 | 2.958 | 4.437 |
| Savage | 54.24 | 33,515 | 1.818 | 1.636 | 1.999 | 1.454 | 2.181 |
| Shakopee Public Utilities | 121.48 | 45,376 | 5.512 | 4.961 | 6.064 | 4.410 | 6.615 |
| Shoreview | 88.49 | 28,240 | 2.499 | 2.249 | 2.749 | 1.999 | 2.999 |
| Shorewood | 99.51 | 4,095 | 0.408 | 0.367 | 0.448 | 0.326 | 0.489 |
| South St. Paul | 111.45 | 20,373 | 2.271 | 2.043 | 2.498 | 1.816 | 2.725 |
| Spring Lake Park | 106.94 | 6,804 | 0.728 | 0.655 | 0.800 | 0.582 | 0.873 |
| Spring Park | 104.97 | 2,305 | 0.242 | 0.218 | 0.266 | 0.194 | 0.290 |
| St. Anthony Village | 86.61 | 10,105 | 0.875 | 0.788 | 0.963 | 0.700 | 1.050 |
| St. Bonifacius | 82.60 | 2,353 | 0.194 | 0.175 | 0.214 | 0.155 | 0.233 |
| St. Francis | 107.49 | 7,181 | 0.772 | 0.695 | 0.849 | 0.618 | 0.926 |
| St. Louis Park | 110.70 | 51,666 | 5.719 | 5.147 | 6.291 | 4.575 | 6.863 |
| St. Paul Park | 90.80 | 6,390 | 0.580 | 0.522 | 0.638 | 0.464 | 0.696 |
| Saint Paul Regional Water Services | 91.49 | 476,120 | 43.559 | 39.203 | 47.915 | 34.847 | 52.271 |
| Stillwater | 100.35 | 22,297 | 2.238 | 2.014 | 2.461 | 1.790 | 2.685 |
| Tonka Bay | 96.42 | 1,747 | 0.168 | 0.152 | 0.185 | 0.135 | 0.202 |
| Vadnais Heights | 95.76 | 14,122 | 1.352 | 1.217 | 1.488 | 1.082 | 1.623 |
| Vermillion | 92.85 | 502 | 0.047 | 0.042 | 0.051 | 0.037 | 0.056 |
| Victoria | 109.26 | 9,984 | 1.091 | 0.982 | 1.200 | 0.873 | 1.309 |
| Waconia | 82.89 | 17,579 | 1.457 | 1.311 | 1.603 | 1.166 | 1.748 |
| Watertown | 66.92 | 5,493 | 0.368 | 0.331 | 0.404 | 0.294 | 0.441 |
| Wayzata | 158.44 | 5,791 | 0.918 | 0.826 | 1.009 | 0.734 | 1.101 |
| White Bear Lake | 86.90 | 26,068 | 2.265 | 2.039 | 2.492 | 1.812 | 2.718 |
| White Bear Township | 98.72 | 11,271 | 1.113 | 1.001 | 1.224 | 0.890 | 1.335 |
| Woodbury | 101.56 | 77,462 | 7.867 | 7.081 | 8.654 | 6.294 | 9.441 |
| TOTAL | 3,115,626 | 314.092 | 282.683 | 345.501 |
2030 municipal community public water supply system projections, including estimated 10% and 20% higher and lower projections to reflect uncertainty due to potential shifts in population and industrial changes, changes in water efficiency, extreme weather patterns (wet and dry), and other variable conditions that could affect water demand. This information is expected to be updated periodically with community input. These values were published on 2/15/2025, the date of the 2050 Water Policy Plan adoption. Values may be updated and available through the Met Council Environmental Services Planning Water Resources Policy and Planning group.
| Community | 2013‐2022 Average Total Water Use (Gallons/ Peron/ Day) | 2040 Projected Population Served | 2040 Projected Average Daily Water Use (Million Gallons/Day) | ‐10% | +10% | ‐20% | +20% |
|---|---|---|---|---|---|---|---|
| Andover | 127.19 | 25,091 | 3.191 | 2.872 | 3.510 | 2.553 | 3.830 |
| Anoka | 123.50 | 22,146 | 2.735 | 2.462 | 3.009 | 2.188 | 3.282 |
| Apple Valley | 112.12 | 58,180 | 6.523 | 5.871 | 7.175 | 5.219 | 7.828 |
| Bayport | 114.64 | 2,795 | 0.320 | 0.288 | 0.352 | 0.256 | 0.385 |
| Belle Plaine | 91.59 | 10,139 | 0.929 | 0.836 | 1.021 | 0.743 | 1.114 |
| Bloomington | 103.69 | 76,420 | 7.924 | 7.132 | 8.716 | 6.339 | 9.509 |
| Brooklyn Center | 94.46 | 31,752 | 2.999 | 2.699 | 3.299 | 2.400 | 3.599 |
| Brooklyn Park | 103.91 | 87,458 | 9.088 | 8.179 | 9.997 | 7.270 | 10.905 |
| Burnsville | 141.30 | 70,310 | 9.935 | 8.941 | 10.928 | 7.948 | 11.922 |
| Carver | 86.82 | 7,236 | 0.628 | 0.565 | 0.691 | 0.503 | 0.754 |
| Centerville | 70.78 | 4,701 | 0.333 | 0.299 | 0.366 | 0.266 | 0.399 |
| Champlin | 98.34 | 25,021 | 2.461 | 2.215 | 2.707 | 1.968 | 2.953 |
| Chanhassen | 107.44 | 29,992 | 3.222 | 2.900 | 3.545 | 2.578 | 3.867 |
| Chaska | 112.47 | 31,034 | 3.490 | 3.141 | 3.839 | 2.792 | 4.188 |
| Circle Pines | 80.63 | 5,429 | 0.438 | 0.394 | 0.482 | 0.350 | 0.525 |
| Cologne | 77.51 | 2,702 | 0.209 | 0.189 | 0.230 | 0.168 | 0.251 |
| Columbus | 100.00 | 1,109 | 0.055 | 0.050 | 0.061 | 0.044 | 0.066 |
| Coon Rapids | 106.60 | 70,738 | 7.540 | 6.786 | 8.294 | 6.032 | 9.048 |
| Cottage Grove | 93.91 | 43,105 | 4.048 | 3.643 | 4.453 | 3.238 | 4.857 |
| Dayton | 61.15 | 9,094 | 0.556 | 0.500 | 0.612 | 0.445 | 0.667 |
| Eagan | 118.21 | 77,329 | 9.141 | 8.227 | 10.055 | 7.313 | 10.969 |
| Eden Prairie | 113.13 | 73,171 | 8.278 | 7.450 | 9.106 | 6.622 | 9.934 |
| Edina | 119.60 | 63,474 | 7.592 | 6.832 | 8.351 | 6.073 | 9.110 |
| Elko New Market | 63.09 | 8,658 | 0.546 | 0.492 | 0.601 | 0.437 | 0.656 |
| Empire Township | 99.28 | 3,271 | 0.325 | 0.292 | 0.357 | 0.260 | 0.390 |
| Excelsior | 122.88 | 2,315 | 0.284 | 0.256 | 0.313 | 0.228 | 0.341 |
| Farmington | 85.19 | 25,212 | 2.148 | 1.933 | 2.363 | 1.718 | 2.577 |
| Forest Lake | 111.09 | 16,792 | 1.865 | 1.679 | 2.052 | 1.492 | 2.239 |
| Fridley | 94.21 | 30,731 | 2.895 | 2.606 | 3.185 | 2.316 | 3.474 |
| Greenfield | 121.04 | 954 | 0.115 | 0.104 | 0.127 | 0.092 | 0.139 |
| Hamburg | 58.44 | 605 | 0.035 | 0.032 | 0.039 | 0.028 | 0.042 |
| Hampton | 66.06 | 745 | 0.049 | 0.044 | 0.054 | 0.039 | 0.059 |
| Hastings | 102.93 | 26,985 | 2.778 | 2.500 | 3.055 | 2.222 | 3.333 |
| Hopkins | 108.23 | 23,567 | 2.551 | 2.296 | 2.806 | 2.041 | 3.061 |
| Hugo | 84.72 | 16,893 | 1.431 | 1.288 | 1.574 | 1.145 | 1.717 |
| Inver Grove Heights | 79.74 | 42,352 | 3.377 | 3.039 | 3.715 | 2.702 | 4.052 |
| Jordan | 86.84 | 7,461 | 0.648 | 0.583 | 0.713 | 0.518 | 0.777 |
| Lake Elmo | 98.70 | 12,007 | 1.185 | 1.067 | 1.304 | 0.948 | 1.422 |
| Lakeland | 65.29 | 3,511 | 0.229 | 0.206 | 0.252 | 0.183 | 0.275 |
| Lakeville | 102.59 | 74,062 | 7.598 | 6.838 | 8.358 | 6.079 | 9.118 |
| Lexington | 88.99 | 2,642 | 0.235 | 0.212 | 0.259 | 0.188 | 0.282 |
| Lino Lakes | 87.00 | 23,146 | 2.014 | 1.812 | 2.215 | 1.611 | 2.416 |
| Long Lake | 103.62 | 2,033 | 0.211 | 0.190 | 0.232 | 0.169 | 0.253 |
| Loretto | 81.24 | 746 | 0.061 | 0.055 | 0.067 | 0.048 | 0.073 |
| Mahtomedi | 83.44 | 7,840 | 0.654 | 0.589 | 0.720 | 0.523 | 0.785 |
| Maple Grove | 114.38 | 93,066 | 10.645 | 9.580 | 11.709 | 8.516 | 12.774 |
| Maple Plain | 88.93 | 2,706 | 0.241 | 0.217 | 0.265 | 0.193 | 0.289 |
| Marine on St. Croix | 69.93 | 223 | 0.016 | 0.014 | 0.017 | 0.012 | 0.019 |
| Mayer | 83.84 | 2,774 | 0.233 | 0.209 | 0.256 | 0.186 | 0.279 |
| Medina | 121.21 | 5,989 | 0.726 | 0.653 | 0.799 | 0.581 | 0.871 |
| Minneapolis | 101.93 | 626,466 | 63.856 | 57.470 | 70.241 | 51.085 | 76.627 |
| Minnetonka Beach | 148.99 | 452 | 0.067 | 0.061 | 0.074 | 0.054 | 0.081 |
| Minnetonka | 113.58 | 66,773 | 7.584 | 6.826 | 8.342 | 6.067 | 9.101 |
| Minnetrista | 120.29 | 5,955 | 0.716 | 0.645 | 0.788 | 0.573 | 0.860 |
| Mound | 64.46 | 9,608 | 0.619 | 0.557 | 0.681 | 0.495 | 0.743 |
| Mounds View | 93.39 | 13,465 | 1.257 | 1.132 | 1.383 | 1.006 | 1.509 |
| New Brighton | 104.80 | 23,732 | 2.487 | 2.238 | 2.736 | 1.990 | 2.984 |
| New Germany | 59.47 | 661 | 0.039 | 0.035 | 0.043 | 0.031 | 0.047 |
| New Prague | 88.26 | 9,232 | 0.815 | 0.733 | 0.896 | 0.652 | 0.978 |
| New Trier | 72.77 | 152 | 0.011 | 0.010 | 0.012 | 0.009 | 0.013 |
| Newport | 82.97 | 5,742 | 0.476 | 0.429 | 0.524 | 0.381 | 0.572 |
| North St. Paul | 74.17 | 12,557 | 0.931 | 0.838 | 1.024 | 0.745 | 1.118 |
| Norwood Young America | 67.86 | 4,672 | 0.317 | 0.285 | 0.349 | 0.254 | 0.380 |
| Oak Grove | 83.36 | 118 | 0.010 | 0.009 | 0.011 | 0.008 | 0.012 |
| Oak Park Heights | 127.23 | 5,006 | 0.637 | 0.573 | 0.701 | 0.510 | 0.764 |
| Oakdale | 84.75 | 30,636 | 2.596 | 2.337 | 2.856 | 2.077 | 3.116 |
| Orono | 89.98 | 5,223 | 0.470 | 0.423 | 0.517 | 0.376 | 0.564 |
| Prior Lake | 68.30 | 33,174 | 2.266 | 2.039 | 2.492 | 1.813 | 2.719 |
| Plymouth | 105.43 | 83,573 | 8.811 | 7.930 | 9.692 | 7.049 | 10.573 |
| Prior Lake | 68.30 | 33,174 | 2.266 | 2.039 | 2.492 | 1.813 | 2.719 |
| Ramsey | 131.70 | 21,306 | 2.806 | 2.525 | 3.087 | 2.245 | 3.367 |
| Randolph | 167.42 | 489 | 0.082 | 0.074 | 0.090 | 0.065 | 0.098 |
| Richfield | 76.13 | 38,732 | 2.949 | 2.654 | 3.244 | 2.359 | 3.539 |
| Robbinsdale | 78.92 | 16,197 | 1.278 | 1.150 | 1.406 | 1.023 | 1.534 |
| Rockford | 80.55 | 4,521 | 0.364 | 0.328 | 0.401 | 0.291 | 0.437 |
| Rogers | 134.88 | 16,743 | 2.258 | 2.032 | 2.484 | 1.807 | 2.710 |
| Rosemount | 101.37 | 38,073 | 3.860 | 3.474 | 4.245 | 3.088 | 4.631 |
| Savage | 54.24 | 36,624 | 1.986 | 1.788 | 2.185 | 1.589 | 2.384 |
| Shakopee Public Utilities | 121.48 | 51,411 | 6.246 | 5.621 | 6.870 | 4.997 | 7.495 |
| Shoreview | 88.49 | 29,184 | 2.582 | 2.324 | 2.841 | 2.066 | 3.099 |
| Shorewood | 99.51 | 4,581 | 0.456 | 0.410 | 0.501 | 0.365 | 0.547 |
| South St. Paul | 111.45 | 20,879 | 2.327 | 2.094 | 2.560 | 1.862 | 2.792 |
| Spring Lake Park | 106.94 | 7,015 | 0.750 | 0.675 | 0.825 | 0.600 | 0.900 |
| Spring Park | 104.97 | 2,495 | 0.262 | 0.236 | 0.288 | 0.210 | 0.314 |
| St. Anthony Village | 86.61 | 10,249 | 0.888 | 0.799 | 0.976 | 0.710 | 1.065 |
| St. Bonifacius | 82.60 | 2,405 | 0.199 | 0.179 | 0.219 | 0.159 | 0.238 |
| St. Francis | 107.49 | 9,700 | 1.043 | 0.938 | 1.147 | 0.834 | 1.251 |
| St. Louis Park | 110.70 | 54,692 | 6.054 | 5.449 | 6.660 | 4.843 | 7.265 |
| St. Paul Park | 90.80 | 6,926 | 0.629 | 0.566 | 0.692 | 0.503 | 0.755 |
| Saint Paul Regional Water Services | 91.49 | 498,888 | 45.642 | 41.078 | 50.206 | 36.514 | 54.771 |
| Stillwater | 100.35 | 24,240 | 2.432 | 2.189 | 2.676 | 1.946 | 2.919 |
| Tonka Bay | 96.42 | 1,860 | 0.179 | 0.161 | 0.197 | 0.143 | 0.215 |
| Vadnais Heights | 95.76 | 14,805 | 1.418 | 1.276 | 1.559 | 1.134 | 1.701 |
| Vermillion | 92.85 | 500 | 0.046 | 0.042 | 0.051 | 0.037 | 0.056 |
| Victoria | 109.26 | 12,117 | 1.324 | 1.191 | 1.456 | 1.059 | 1.589 |
| Waconia | 82.89 | 19,302 | 1.600 | 1.440 | 1.760 | 1.280 | 1.920 |
| Watertown | 66.92 | 6,575 | 0.440 | 0.396 | 0.484 | 0.352 | 0.528 |
| Wayzata | 158.44 | 6,344 | 1.005 | 0.905 | 1.106 | 0.804 | 1.206 |
| White Bear Lake | 86.90 | 27,256 | 2.369 | 2.132 | 2.605 | 1.895 | 2.842 |
| White Bear Township | 98.72 | 12,123 | 1.197 | 1.077 | 1.316 | 0.957 | 1.436 |
| Woodbury | 101.56 | 82,050 | 8.333 | 7.500 | 9.167 | 6.667 | 10.000 |
| TOTAL | 3,314,365 | 333.967 | 300.570 | 367.364 |
2040 municipal community public water supply system projections, including estimated 10% and 20% higher and lower projections to reflect uncertainty due to potential shifts in population and industrial changes, changes in water efficiency, extreme weather patterns (wet and dry), and other variable conditions that could affect water demand. This information is expected to be updated periodically with community input.
| Community | 2013‐2022 Average Total Water Use (Gallons/ Peron/ Day) | 2050 Projected Population Served | 2050 Projected Average Daily Water Use (Million Gallons/Day) | ‐10% | +10% | ‐20% | +20% |
|---|---|---|---|---|---|---|---|
| Andover | 127.19 | 27,287 | 3.471 | 3.124 | 3.818 | 2.777 | 4.165 |
| Anoka | 123.50 | 23,422 | 2.893 | 2.603 | 3.182 | 2.314 | 3.471 |
| Apple Valley | 112.12 | 60,351 | 6.767 | 6.090 | 7.443 | 5.413 | 8.120 |
| Bayport | 114.64 | 3,000 | 0.344 | 0.310 | 0.378 | 0.275 | 0.413 |
| Belle Plaine | 91.59 | 14,127 | 1.294 | 1.164 | 1.423 | 1.035 | 1.553 |
| Bloomington | 103.69 | 86,358 | 8.955 | 8.059 | 9.850 | 7.164 | 10.745 |
| Brooklyn Center | 94.46 | 32,891 | 3.107 | 2.796 | 3.418 | 2.486 | 3.728 |
| Brooklyn Park | 103.91 | 91,295 | 9.486 | 8.538 | 10.435 | 7.589 | 11.384 |
| Burnsville | 141.30 | 75,200 | 10.626 | 9.563 | 11.688 | 8.501 | 12.751 |
| Carver | 86.82 | 11,065 | 0.961 | 0.865 | 1.057 | 0.769 | 1.153 |
| Centerville | 70.78 | 5,058 | 0.358 | 0.322 | 0.394 | 0.286 | 0.430 |
| Champlin | 98.34 | 24,894 | 2.448 | 2.203 | 2.693 | 1.958 | 2.938 |
| Chanhassen | 107.44 | 31,990 | 3.437 | 3.093 | 3.781 | 2.750 | 4.124 |
| Chaska | 112.47 | 35,938 | 4.042 | 3.638 | 4.446 | 3.233 | 4.850 |
| Circle Pines | 80.63 | 5,700 | 0.460 | 0.414 | 0.506 | 0.368 | 0.552 |
| Cologne | 77.51 | 3,432 | 0.266 | 0.239 | 0.293 | 0.213 | 0.319 |
| Columbus | 100.00 | 1,666 | 0.055 | 0.050 | 0.061 | 0.044 | 0.066 |
| Coon Rapids | 106.60 | 76,659 | 8.172 | 7.354 | 8.989 | 6.537 | 9.806 |
| Cottage Grove | 93.91 | 49,259 | 4.626 | 4.163 | 5.088 | 3.701 | 5.551 |
| Dayton | 61.15 | 12,253 | 0.749 | 0.674 | 0.824 | 0.599 | 0.899 |
| Eagan | 118.21 | 81,266 | 9.606 | 8.646 | 10.567 | 7.685 | 11.528 |
| Eden Prairie | 113.13 | 78,285 | 8.857 | 7.971 | 9.742 | 7.085 | 10.628 |
| Edina | 119.60 | 66,302 | 7.930 | 7.137 | 8.723 | 6.344 | 9.516 |
| Elko New Market | 63.09 | 11,481 | 0.724 | 0.652 | 0.797 | 0.580 | 0.869 |
| Empire Township | 99.28 | 3,860 | 0.383 | 0.345 | 0.422 | 0.307 | 0.460 |
| Excelsior | 122.88 | 2,656 | 0.326 | 0.294 | 0.359 | 0.261 | 0.392 |
| Farmington | 85.19 | 28,580 | 2.435 | 2.191 | 2.678 | 1.948 | 2.922 |
| Forest Lake | 111.09 | 20,266 | 2.251 | 2.026 | 2.477 | 1.801 | 2.702 |
| Fridley | 94.21 | 32,376 | 3.050 | 2.745 | 3.355 | 2.440 | 3.660 |
| Greenfield | 121.04 | 1,286 | 0.156 | 0.140 | 0.171 | 0.125 | 0.187 |
| Hamburg | 58.44 | 613 | 0.036 | 0.032 | 0.039 | 0.029 | 0.043 |
| Hampton | 66.06 | 783 | 0.052 | 0.047 | 0.057 | 0.041 | 0.062 |
| Hastings | 102.93 | 28,280 | 2.911 | 2.620 | 3.202 | 2.329 | 3.493 |
| Hopkins | 108.23 | 25,477 | 2.757 | 2.482 | 3.033 | 2.206 | 3.309 |
| Hugo | 84.72 | 20,547 | 1.741 | 1.567 | 1.915 | 1.393 | 2.089 |
| Inver Grove Heights | 79.74 | 45,765 | 3.649 | 3.284 | 4.014 | 2.919 | 4.379 |
| Jordan | 86.84 | 8,227 | 0.714 | 0.643 | 0.786 | 0.572 | 0.857 |
| Lake Elmo | 98.70 | 14,527 | 1.434 | 1.290 | 1.577 | 1.147 | 1.721 |
| Lakeland | 65.29 | 3,489 | 0.228 | 0.205 | 0.251 | 0.182 | 0.273 |
| Lakeville | 102.59 | 84,015 | 8.619 | 7.757 | 9.481 | 6.895 | 10.343 |
| Lexington | 88.99 | 2,702 | 0.240 | 0.216 | 0.264 | 0.192 | 0.289 |
| Lino Lakes | 87.00 | 26,474 | 2.303 | 2.073 | 2.533 | 1.843 | 2.764 |
| Long Lake | 103.62 | 2,103 | 0.218 | 0.196 | 0.240 | 0.174 | 0.261 |
| Loretto | 81.24 | 770 | 0.063 | 0.056 | 0.069 | 0.050 | 0.075 |
| Mahtomedi | 83.44 | 7,770 | 0.648 | 0.583 | 0.713 | 0.519 | 0.778 |
| Maple Grove | 114.38 | 103,428 | 11.830 | 10.647 | 13.013 | 9.464 | 14.196 |
| Maple Plain | 88.93 | 3,111 | 0.277 | 0.249 | 0.304 | 0.221 | 0.332 |
| Marine on St. Croix | 69.93 | 281 | 0.020 | 0.018 | 0.022 | 0.016 | 0.024 |
| Mayer | 83.84 | 3,098 | 0.260 | 0.234 | 0.286 | 0.208 | 0.312 |
| Medina | 121.21 | 6,837 | 0.829 | 0.746 | 0.912 | 0.663 | 0.994 |
| Minneapolis | 101.93 | 656,264 | 66.893 | 60.204 | 73.582 | 53.514 | 80.272 |
| Minnetonka Beach | 148.99 | 449 | 0.067 | 0.060 | 0.074 | 0.054 | 0.080 |
| Minnetonka | 113.58 | 73,365 | 8.333 | 7.500 | 9.166 | 6.666 | 9.999 |
| Minnetrista | 120.29 | 6,726 | 0.809 | 0.728 | 0.890 | 0.647 | 0.971 |
| Mound | 64.46 | 9,656 | 0.622 | 0.560 | 0.685 | 0.498 | 0.747 |
| Mounds View | 93.39 | 13,998 | 1.307 | 1.177 | 1.438 | 1.046 | 1.569 |
| New Brighton | 104.80 | 24,885 | 2.608 | 2.347 | 2.869 | 2.086 | 3.129 |
| New Germany | 59.47 | 817 | 0.049 | 0.044 | 0.053 | 0.039 | 0.058 |
| New Prague | 88.26 | 9,638 | 0.851 | 0.766 | 0.936 | 0.680 | 1.021 |
| New Trier | 72.77 | 154 | 0.011 | 0.010 | 0.012 | 0.009 | 0.013 |
| Newport | 82.97 | 6,605 | 0.548 | 0.493 | 0.603 | 0.438 | 0.658 |
| North St. Paul | 74.17 | 12,552 | 0.931 | 0.838 | 1.024 | 0.745 | 1.117 |
| Norwood Young America | 67.86 | 5,083 | 0.345 | 0.310 | 0.379 | 0.276 | 0.414 |
| Oak Grove | 83.36 | 118 | 0.010 | 0.009 | 0.011 | 0.008 | 0.012 |
| Oak Park Heights | 127.23 | 5,408 | 0.688 | 0.619 | 0.757 | 0.550 | 0.826 |
| Oakdale | 84.75 | 32,974 | 2.795 | 2.515 | 3.074 | 2.236 | 3.353 |
| Orono | 89.98 | 5,895 | 0.530 | 0.477 | 0.583 | 0.424 | 0.636 |
| Prior Lake | 68.30 | 36,976 | 2.525 | 2.273 | 2.778 | 2.020 | 3.031 |
| Plymouth | 105.43 | 89,566 | 9.443 | 8.498 | 10.387 | 7.554 | 11.331 |
| Prior Lake | 68.30 | 36,976 | 2.525 | 2.273 | 2.778 | 2.020 | 3.031 |
| Ramsey | 131.70 | 25,018 | 3.295 | 2.965 | 3.624 | 2.636 | 3.954 |
| Randolph | 167.42 | 565 | 0.095 | 0.085 | 0.104 | 0.076 | 0.114 |
| Richfield | 76.13 | 40,031 | 3.048 | 2.743 | 3.352 | 2.438 | 3.657 |
| Robbinsdale | 78.92 | 16,490 | 1.301 | 1.171 | 1.431 | 1.041 | 1.562 |
| Rockford | 80.55 | 4,579 | 0.369 | 0.332 | 0.406 | 0.295 | 0.443 |
| Rogers | 134.88 | 20,199 | 2.724 | 2.452 | 2.997 | 2.180 | 3.269 |
| Rosemount | 101.37 | 40,517 | 4.107 | 3.697 | 4.518 | 3.286 | 4.929 |
| Savage | 54.24 | 39,211 | 2.127 | 1.914 | 2.339 | 1.701 | 2.552 |
| Shakopee Public Utilities | 121.48 | 61,731 | 7.499 | 6.749 | 8.249 | 5.999 | 8.999 |
| Shoreview | 88.49 | 30,623 | 2.710 | 2.439 | 2.981 | 2.168 | 3.252 |
| Shorewood | 99.51 | 4,623 | 0.460 | 0.414 | 0.506 | 0.368 | 0.552 |
| South St. Paul | 111.45 | 21,603 | 2.408 | 2.167 | 2.648 | 1.926 | 2.889 |
| Spring Lake Park | 106.94 | 7,345 | 0.785 | 0.707 | 0.864 | 0.628 | 0.943 |
| Spring Park | 104.97 | 2,721 | 0.286 | 0.257 | 0.314 | 0.228 | 0.343 |
| St. Anthony Village | 86.61 | 10,314 | 0.893 | 0.804 | 0.983 | 0.715 | 1.072 |
| St. Bonifacius | 82.60 | 2,390 | 0.197 | 0.178 | 0.217 | 0.158 | 0.237 |
| St. Francis | 107.49 | 11,133 | 1.197 | 1.077 | 1.316 | 0.957 | 1.436 |
| St. Louis Park | 110.70 | 58,459 | 6.471 | 5.824 | 7.118 | 5.177 | 7.765 |
| St. Paul Park | 90.80 | 7,701 | 0.699 | 0.629 | 0.769 | 0.559 | 0.839 |
| Saint Paul Regional Water Services | 91.49 | 519,437 | 47.522 | 42.770 | 52.274 | 38.018 | 57.027 |
| Stillwater | 100.35 | 24,282 | 2.437 | 2.193 | 2.680 | 1.949 | 2.924 |
| Tonka Bay | 96.42 | 1,970 | 0.190 | 0.171 | 0.209 | 0.152 | 0.228 |
| Vadnais Heights | 95.76 | 14,743 | 1.412 | 1.271 | 1.553 | 1.129 | 1.694 |
| Vermillion | 92.85 | 501 | 0.047 | 0.042 | 0.051 | 0.037 | 0.056 |
| Victoria | 109.26 | 15,780 | 1.724 | 1.552 | 1.896 | 1.379 | 2.069 |
| Waconia | 82.89 | 23,882 | 1.979 | 1.782 | 2.177 | 1.584 | 2.375 |
| Watertown | 66.92 | 7,591 | 0.508 | 0.457 | 0.559 | 0.406 | 0.610 |
| Wayzata | 158.44 | 6,931 | 1.098 | 0.988 | 1.208 | 0.879 | 1.318 |
| White Bear Lake | 86.90 | 27,521 | 2.392 | 2.152 | 2.631 | 1.913 | 2.870 |
| White Bear Township | 98.72 | 12,175 | 1.202 | 1.082 | 1.322 | 0.962 | 1.442 |
| Woodbury | 101.56 | 88,885 | 9.028 | 8.125 | 9.930 | 7.222 | 10.833 |
| TOTAL | 3,563,556 | 359.160 | 323.244 | 395.076 |
2050 municipal community public water supply system projections, including estimated 10% and 20% higher and lower projections to reflect uncertainty due to potential shifts in population and industrial changes, changes in water efficiency, extreme weather patterns (wet and dry), and other variable conditions that could affect water demand. This information is expected to be updated periodically with community input.
